November 1, 2019 Vol. 29, No. 7
Global climate trend since Dec. 1 1978: +0.13 C per decade
October Temperatures (preliminary)
Global composite temp.: +0.46 C (+0.83 °F) above seasonal average
Northern Hemisphere.: +0.64 C (+1.15 °F) above seasonal average
Southern Hemisphere.: +0.27 C (+0.49°F) above seasonal average
Tropics.: +0.30 C (+0.54°F) above seasonal average
September Temperatures (final)
Global composite temp.: +0.61 C (+1.10 °F) above seasonal average
Northern Hemisphere.: +0.64 C (+1.15 °F) above seasonal average
Southern Hemisphere.: +0.59 C (+1.06°F) above seasonal average
Tropics.: +0.60 C (+1.08°F) above seasonal average
Notes on data released November 1, 2019 (v6.0)
October’s globally-averaged, bulk-layer atmospheric temperature anomaly of +0.46°C (+0.83°F) represented the second warmest October reading of the past 41 Octobers in our satellite record, though it is statistically tied with two other years. The global temperature departure was a quarter degree cooler in October than September, however, the land area of the earth tied 2017 for the warmest October land in the record (+0.74°C, 1.33°F).

The conterminous U.S. as a whole experienced an average October (-0.03°C, -0.05 °F) with north central and northwestern portions well below average (see below). The warmth in Alaska lifted the 49 continental states’ average to +0.25°C (+0.45°F).
Globally, locations with sustained warmer-than-average temperatures for the month appeared over the NE Pacific Ocean northward through the Alaskan Arctic as well as along eastern North America. Nations in southeastern Europe eastward through Kazakhstan were well above average as was Japan, South Africa and Eastern Antarctica where the planet’s warmest departure from average occurred near Dome Fuji at +4.4 °C (+8.0 °F).

The planet’s coldest departure from average this month was -3.3 °C (-6.0 °F) near Rosebud Montana in the center of a stubborn area of cold air in central/western North America. Other areas of cooler than average temperatures occurred over Scandinavia and the South Atlantic Ocean.
Spoiler Alert first published March 2019: As noted over the past several months in this report, the drifting of satellites NOAA-18 and NOAA-19, whose temperature errors were somewhat compensating each other, will be addressed in this updated version of data released from March 2019 onward. As we normally do in these situations we have decided to terminate ingestion of NOAA-18 observations as of 1 Jan 2017 because the corrections for its significant drift were no longer applicable. We have also applied the drift corrections for NOAA-19 now that it has started to drift far enough from its previous rather stable orbit. These actions will eliminate extra warming from NOAA-18 and extra cooling from NOAA-19. The net effect is to introduce slight changes from 2009 forward (when NOAA-19 began) with the largest impact on annual, global anomalies in 2017 of 0.02 °C. The 2018 global anomaly changed by only 0.003°C, from +0.228°C to +0.225°C. These changes reduce the global trend by -0.0007 °C/decade (i.e. 7 ten-thousandths of a degree) and therefore does not affect the conclusions one might draw from the dataset. The v6.0 methodology is unchanged as we normally stop ingesting satellites as they age and apply the v6.0 diurnal corrections as they drift.
To-Do List: There has been a delay in our ability to utilize and merge the new generation of microwave sensors (ATMS) on the NPP and JPSS satellites. As of now, the calibration equations applied by the agency have changed at least twice, so that the data stream contains inhomogeneities which obviously impact the type of measurements we seek. We are hoping this is resolved soon with a dataset that is built with a single, consistent set of calibration equations. In addition, the current non-drifting satellite operated by the Europeans, MetOP-B, has not yet been adjusted or “neutralized” for its seasonal peculiarities related to its unique equatorial crossing time (0930). While these MetOP-B peculiarities do not affect the long-term global trend, they do introduce error within a particular year in specific locations over land.
As part of an ongoing joint project between UAH, NOAA and NASA, Christy and Dr. Roy Spencer, an ESSC principal scientist, use data gathered by advanced microwave sounding units on NOAA, NASA and European satellites to produce temperature readings for almost all regions of the Earth. This includes remote desert, ocean and rain forest areas where reliable climate data are not otherwise available. Research Associate Rob Junod assists in the preparation of these reports.
The satellite-based instruments measure the temperature of the atmosphere from the surface up to an altitude of about eight kilometers above sea level. Once the monthly temperature data are collected and processed, they are placed in a “public” computer file for immediate access by atmospheric scientists in the U.S. and abroad.
The complete version 6 lower troposphere dataset is available here:
http://www.nsstc.uah.edu/data/msu/v6.0/tlt/uahncdc_lt_6.0.txt
Archived color maps of local temperature anomalies are available on-line at:
Neither Christy nor Spencer receives any research support or funding from oil, coal or industrial companies or organizations, or from any private or special interest groups. All of their climate research funding comes from federal and state grants or contracts.
-30-
The temperature of ozone that falls from the tropopause is very low because the temperature in the tropopause above the 60th parallel is below :-50 degrees C.
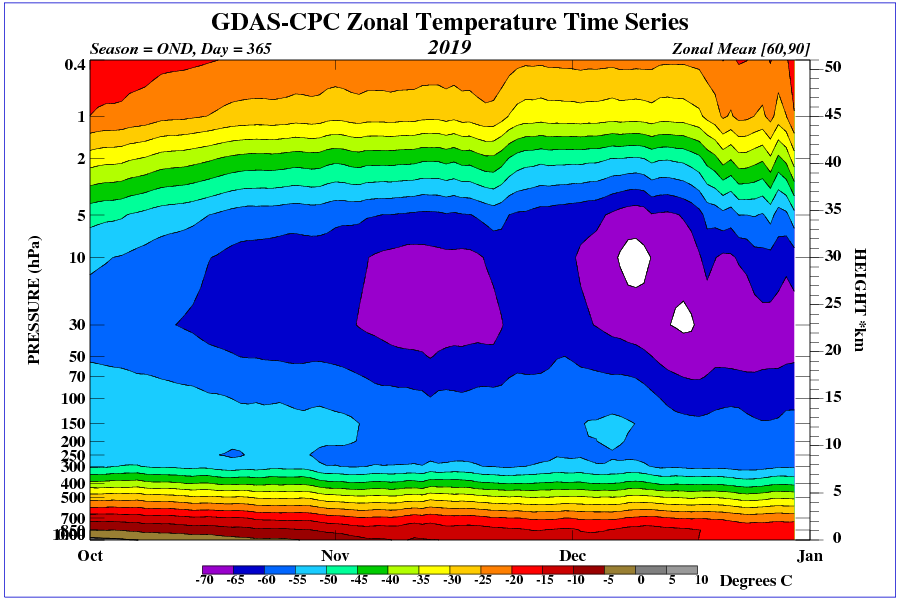
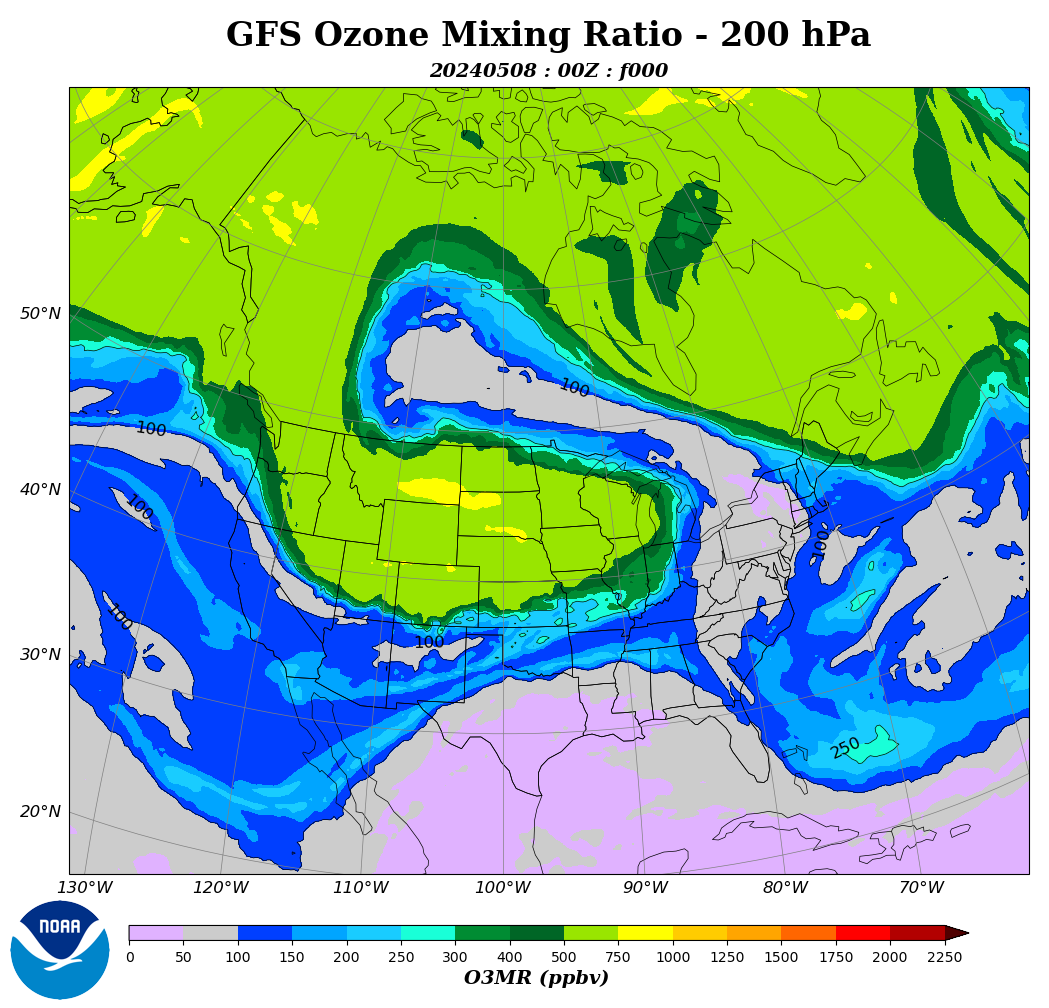
Another stratospheric intrusion this year, visible in the Midwest.

There should be more of these in the SH, after that huge SSW.
To the south is stronger geomagnetic field.
https://dlmultimedia.esa.int/download/public/videos/2016/05/031/1605_031_AR_EN.mp4
Based on results from ESA’s Swarm mission, the animation shows how the strength of Earth’s magnetic field has changed between 1999 and mid-2016. Blue depicts where the field is weak and red shows regions where the field is strong. The field has weakened by about 3.5% at high latitudes over North America, while it has grown about 2% stronger over Asia. The region where the field is at its weakest field – the South Atlantic Anomaly – has moved steadily westward and further weakened by about 2%. In addition, the magnetic north pole is wandering east.
https://www.bbc.co.uk/news/science-environment-50302392#comment_137090849
Many times that number of real scientists say there is no such emergency.
As one would expect in a hottest October ever, among US midwest farmers there’s a run on propane.
https://www.reuters.com/article/us-usa-propane-demand/scramble-for-propane-marks-mother-natures-latest-challenge-for-u-s-farmers-idUSKBN1XF1FA
Everyone is harvesting soggy corn after both spring and fall were cold and wet. Now everyone’s chasing propane to dry the harvested produce (and stay warm themselves) and propane is getting scarce and expensive.
Heres the latest climate report (doom and gloom)https://academic.oup.com/bioscience/advance-article/doi/10.1093/biosci/biz088/5610806
Heres the BBC’s take on it (alarmism) https://www.bbc.co.uk/news/science-environment-50302392
It is very interesting how the equator is very close to average as the solar plane of maximum heating passes the equator moving South. You can almost visualize the Hadley cells rising from that warmth and circulating North and South in tubes of rising and descending air currents. Distributing the warmth in circular tubes of air that allow the excess warmth of the tropics to prolong the growing seasons in the temperate zones. What a wonderful climate we have, and I feel blessed and thankful, to live in a time when the climate has contributed to the health and beneficial living conditions for the inhabitants of this Earth.
Thank you Dr. Spencer and Dr. Christy. Your hard work does not go unnoticed, or unappreciated.
You don’t have to imagine it. Look at the graphics.
http://ds.data.jma.go.jp/tcc/tcc/products/clisys/STRAT/gif/zt_nh.gif
http://ds.data.jma.go.jp/tcc/tcc/products/clisys/STRAT/gif/zu_nh.gif
http://ds.data.jma.go.jp/tcc/tcc/products/clisys/STRAT/
Is “seasonal average” 1981 to 2010?
This global map looks strange when you consider most of Siberia and northern Russia are covered in snow.
An average October in Siberia is cold. A slightly warmer than average October in Siberia is still cold.
99.9% of the human population would not notice the difference. Frozen parts of your body, do not care that it took slightly more time to freeze than average.
That is where the warmth goes to die:
https://en.wikipedia.org/wiki/Siberia
A little slice of the real Siberian climate. Not the cities where people can prosper.
The cities where survival is challenged for half the year:
https://en.wikipedia.org/wiki/Verkhoyansk
Consensus is a political term (word) and cannot be used in science as science is very rigid and requires the verification of a hypothesis by colleagues and fellow scientists. If one scientist cannot achieve the same results from the same experiment then the hypothesis is INCORRECT. Using the word consensus to describe agreement among scientists is the equivalent to saying some scientists do not agree therefor the hypothesis (climate emergency) is INCORRECT. Please print this so EVERYONE can see it regularly on this website. Michael Mann is a fraud as he wishes not disclose the data by which he produces his computer model (hockey stick graph). He has been exposed unofficially as a fraud by the BC supreme court where he would not produce data to prove his work. He was forced to pay Dr. Tim Ball all court costs. In Canada he could not hide behind proprietary law which his protects his work is in USA. He has no data and there is no data anywhere on earth to support his hockey stick computer model climate emergency. He has fraudulently rewritten the historical temperature graph.