I’ve been saying for years that surface temperature measurements (and long term trends) have been affected by encroachment of urbanization on the placement of weather stations used to measure surface air temperature, and track long term climate. In doing so we found some hilariously bad examples of climate science in action, such as the official USHCN climate monitoring station at the University of Arizona, Tucson:

I have published on the topic in the scientific literature, and found this to be true based on the science we’ve done of examining the USHCN and applying the siting methodology of Leroy 2010.
In Fall et al, 2011 we discovered that there was a change to the diurnal temperature range (DTR). It decreased where stations had been encroached upon, because of the heat sink effect of man-made materials (asphalt, concrete, bricks, etc.) that were near stations.
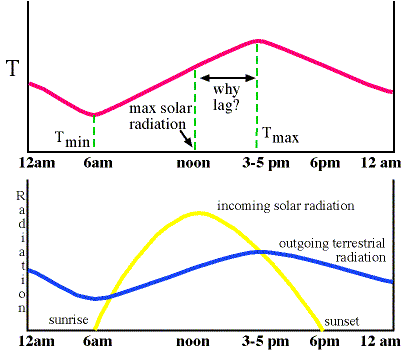
For layman readers that don’t know what diurnal variation is, it is the daily variation of temperature due to the variation of incoming solar radiation from rotation of the earth on its axis.
It looks like this:
Here is what we found; in the best-sited stations, the diurnal temperature range in the lower 48 states has no century-scale trend, but the poorly sited stations had a reduction in DTR:
These results suggest that the DTR in the United States has not decreased due to global warming, and that analyses to the contrary were at least partly contaminated by station siting problems. Indeed, DTR tended to increase when temperatures were fairly stable and tended to decrease when temperatures rose.
Fall, S., A. Watts, J. Nielsen-Gammon, E. Jones, D. Niyogi, J. Christy, and R.A. Pielke Sr., 2011: Analysis of the impacts of station exposure on the U.S. Historical Climatology Network temperatures and temperature trends. J. Geophys. Res., in press. Copyright (2011) American Geophysical Union.
A few years back in 2012, I noted that NOAA was doing an experiment to prove or disprove what we learned.
Initial funding was provided this year by the USRCRN Program for a multi-year experiment to better understand the thermal impacts of buildings with parking lots on air temperature measurements. A site near the offices of ATDD will be instrumented to measure accurately the air temperature and other variables at multiple distances from the potential thermal heat source, corresponding to the distances from thermal sources used in classifying USCRN stations (Figure 7).

This study will have several applied and practical outcomes. Determining the downwind range of influence of a typical building will be important for understanding built environment impacts on surface air temperature measurements. Other measurements of radiation and heat fluxes will help illuminate the physical processes responsible for any detected heat transfers. Finally, this information will help influence future USCRN/USRCRN siting decisions. Additional insight is being sought by collaborating with National Weather Service (NWS) and National Institute for Standards and Technology (NIST) on extensions of the basic project. This effort promises to be greatly useful to understanding climate quality temperature measurements and how they can be influenced by the station site environment.
They have finally published. (h/t to Steve Mosher) Guess what? Like I’ve said all along (and been excoriated for saying so) they found exactly what we did.
Impacts of Small-Scale Urban Encroachment on Air Temperature Observations
Ronald D. Leeper, John Kochendorfer, Timothy Henderson, and Michael A. Palecki
https://journals.ametsoc.org/doi/10.1175/JAMC-D-19-0002.1
Abstract (bold mine)
A field experiment was performed in Oak Ridge, TN, with four instrumented towers placed over grass at increasing distances (4, 30, 50, 124, and 300 m) from a built-up area. Stations were aligned in such a way to simulate the impact of small-scale encroachment on temperature observations. As expected, temperature observations were warmest for the site closest to the built environment with an average temperature difference of 0.31 and 0.24 °C for aspirated and unaspirated sensors respectively. Mean aspirated temperature differences were greater during the evening (0.47 °C) than day (0.16 °C). This was particularly true for evenings following greater daytime solar insolation (20+ MJDay−1) with surface winds from the direction of the built environment where mean differences exceeded 0.80 °C. The impact of the built environment on air temperature diminished with distance with a warm bias only detectable out to tower-B’ located 50 meters away.
The experimental findings were comparable to a known case of urban encroachment at a U. S. Climate Reference Network station in Kingston, RI. The experimental and operational results both lead to reductions in the diurnal temperature range of ~0.39 °C for fan aspirated sensors. Interestingly, the unaspirated sensor had a larger reduction in DTR of 0.48 °C. These results suggest that small-scale urban encroachment within 50 meters of a station can have important impacts on daily temperature extrema (maximum and minimum) with the magnitude of these differences dependent upon prevailing environmental conditions and sensing technology.
And, we’ve published at AGU on the effects of siting on 30 year temperature trends:
The quality of temperature station siting matters for temperature trends
Anthony Watts / December 17, 2015
30 year trends of temperature are shown to be lower, using well-sited high quality NOAA weather stations that do not require adjustments to the data.
NEW STUDY OF NOAA’S U.S. CLIMATE NETWORK SHOWS A LOWER 30-YEAR TEMPERATURE TREND WHEN HIGH QUALITY TEMPERATURE STATIONS UNPERTURBED BY URBANIZATION ARE CONSIDERED

Figure 4 – Comparisons of 30 year trend for compliant Class 1,2 USHCN stations to non-compliant, Class 3,4,5 USHCN stations to NOAA final adjusted V2.5 USHCN data in the Continental United States
EMBARGOED UNTIL 13:30 PST (16:30 EST) December 17th, 2015
SAN FRANCISCO, CA – A new study about the surface temperature record presented at the 2015 Fall Meeting of the American Geophysical Union suggests that the 30-year trend of temperatures for the Continental United States (CONUS) since 1979 are about two thirds as strong as officially NOAA temperature trends.

Figure 3 – Tmean Comparisons of well sited (compliant Class 1&2) USHCN stations to poorly sited USHCN stations (non-compliant, Classes 3,4,&5) by CONUS and region to official NOAA adjusted USHCN data (V2.5) for the entire (compliant and non-compliant) USHCN dataset.
Using NOAA’s U.S. Historical Climatology Network, which comprises 1218 weather stations in the CONUS, the researchers were able to identify a 410 station subset of “unperturbed” stations that have not been moved, had equipment changes, or changes in time of observations, and thus require no “adjustments” to their temperature record to account for these problems. The study focuses on finding trend differences between well sited and poorly sited weather stations, based on a WMO approved metric Leroy (2010)1for classification and assessment of the quality of the measurements based on proximity to artificial heat sources and heat sinks which affect temperature measurement. An example is shown in Figure 2 below, showing the NOAA USHCN temperature sensor for Ardmore, OK.

Figure 1 – USHCN Temperature sensor located on street corner in Ardmore, OK in full viewshed of multiple heatsinks.
Dare I call this new NOAA paper vindication?
Or, by doing so will the rabble of global warming zealots led by schmucks like Dr. Michael Mann find yet another reason to label me a “Koch funded science denier”?
I could use a beer right about now. You can support the work here.
Yes, you should call the NOAA paper vindication. Congratulations, Anthony.
Hear hear!
How quickly will “The Team” act to “Vanish” this paper of “Inconvenient Truth”?
Here is the paper
https://www.dropbox.com/s/x12j51a7ws5riyd/Leeper%20impacts%20of%20small-scale%20urban%20encrochment.pdf?dl=0
Thanks Lance
“Any” normal person would know this just using common sense. Rocket science it ain’t.
Yes, but actual data is preferable to common sense. For a long time, common sense said heavy objects fall faster than light ones. Heavier than air vehicles could never fly.
Anthony provided such hard data years ago. Now, NOAA is aware of this fact.
Yeah, well the last thing we need now is a bunch of empirical data when we have all of the computer models to paint the picture…
The world is awash in “actual data” and “professional” scientific analysis as well as “detached” reporting from “professional” journalists. So how come it’s B.S. from top to bottom?
Science and reality have been hijacked by people who think their subjective truth makes the real facts irrelevant.
I note that the test towers are supposedly on “grass”. I wouldn’t turn the cows out on that if that’s what they’re calling it. It certainly doesn’t look like a natural environment to me.
Your comment “Science and reality have been hijacked by people who think their subjective truth makes the real facts irrelevant.” is true but needs a bit more explanation: Scientists – at least some of them who call themselves that – have fallen into the trap the media created. For years now the media have learned to assume that if any one of them reported something, it must be true. If something is reported as fact, no one else thinks they need to check.
So this happens: A “scientist’ says something. If the media reports it – even if they miss-report the statement – other media pick up on it and repeat the error. Within about 10 seconds it becomes ‘fact’ and ‘consensus’.
The challenge is to get the TV indoctrinated to realize what both of you have iterated. “Most visited website on climate change” can’t quite compete with network TV.
I am sure NOAA was aware years ago…just could not find a reliable way to disappear it.
It is difficult for these zealots to grasp common sense when they are invested so heavily in a fraud, just look at all the Democrats running to gain the Democrat nomination or CNN. Same widespread illness.
Vindication yes, but will there be a effort to develop a systematic way to adjust past temperature records at compromised stations to properly account for these UHI effects or should we just throw them out?
Throw them out, as whoever who makes the the adjustments to data from badly placed weather stations controls the results according to their expectations.
There needs to be a new series of measuring stations based N,N,E and W of UHIs at a range of distances to measure the effect of distance from the UHI as well as seeing what the effect of prevailing wind on temperature is.
The cost should not be too great in comparison to building windmills or solar farms, and we would at least have some firm data.
The local weather forecasters over here in the UK always finish their evening forecasts with ‘ the temperature in rural areas will be a degree or two lower than their previous forecast which is based on urban areas ‘.
I compared the unadjusted readings over the last 70 years or so between Sao Paolo in Brazil vs. Curitiba just down the coast. Curitiba does not show any warming pattern. Sao Paolo, on the other hand, is a good 3-4 degrees C warmer today than it was in the 1950s. So I will go out on a bit of a limb and assert that UHI is in the 3-4 degree range for the largest cities, not just fractions of a degree.
https://www.facebook.com/dan.tige.927/posts/437226997094518?comment_id=437414840409067&comment_tracking=%7B%22tn%22%3A%22R%22%7D
[Photo of a Stevenson Screen inside a fence on asphalt inside a parking lot. .mod]
Yes, they will adjust the highs upward at poorly sited stations to match the diurnal at well sited stations
BS! I talked to a farmer this week that said they have to buy different seed now because its so late and the ground is still too cold to germinate the usual seed!
And this is because of Global Warming?
This new NOAA paper investigation is certainly a resounding vindication of the great work carried out by Anthony Watts over so many years. When even NOAA admits this, the message is finally getting through.
“When even NOAA admits this, the message is finally getting through”
When it gets through the thick head of “Lord Deben”, aka John Selwyn Gummer of the UK’s Climate Change Committee, I might feel a little less depressed.
“The deniers have lost the battle because the science is fundamentally clear”
He might be right about “Crap” houses, but still wrong about everything else.
https://www.dailymail.co.uk/news/article-6987201/Stop-building-c-p-houses-Climate-change-chiefs-tirade-energy-wasting-properties.html
exactly……without their adjusting the past down….there would be no global warming at all
I will be charitable and presume that NOAA is looking for a graceful retreat from an untenable scientific position. This will allow them to ‘re-examine’ their past records and pronouncements with a plausible excuse of mere sloppiness and laxity.
Perhaps an Emily Latella moment?
Who would have suspected that NOAA was being funded by nefarious oil interests? Shocking!
Cheers, well done
Big congrats Anthony!
Enjoy that beer . . .
Thank you Anthony! This Bud is for you!
Anthony, I’ve always had faith in your work on the siting of surface temperature stations. Every photo of a station that you have given as examples of the distortion caused by station siting has turned out to be validated by data derived in this latest study. You have every reason to say “I told you so.” Congratulations!
In the wake of this result, it appears that the entire temperature record used by NOAA and GISS has been significantly overstated. It also appears to me that some of the warming that has been shown is more characteristic of UHI than of carbon dioxide. But will this quell the doomsayers? Probably not. Because this has always been more about power and control over human affairs than about climate.
There are a lot of stations a lot worse then the sample used in this experiment.
Those of us living out here in Realville stopped listening to doomsayers a long time ago. When Democrat Socialists (they finally came out of the closet) are selling global warming instinct tells us it’s all about power and control over our lives. Also, I have noticed that where I live in Southern Arizona the summer highs have been slowly dropping since 1991. The lows have been getting slightly warmer due to increased moisture from the warm Pacific. This has been real climate change.
Congratulations!
Berkley Earth looked at tens of thousands of weather stations and concluded that urban heat wasn’t distorting the overall figures and that there was a clear warming trend.
continuing to cherry pick urban weather stations and claiming this shows the evidence is not there for warming is not science or an adequate refutation of the scientific evidence.
Griff, shut up.
+42 x 1042
You made Diet Coke shoot out of my nose, I laughed so hard!
Well deserved!
Yeah, griff deserved that — trying to lecture you of all people about temp measurement. Even patient people have limits of tolerance.
Oh Griff PLEASE… Where exactly in this article did you read someone “claiming this shows the evidence is not there for warming”?
You know, I always thought “griff” aka Edward Griffin was dense, but this comment of his really takes the cake.
By his comment, Griff shows he is incapable of assimilating new information, even when it comes from an official source.
That’s the mark of a paid troll. Now, get the hell off my site. I’m done being nice to you.
Can we dance on the metaphorical grave?
There might be a little ‘fertilizer’ on the site.
Anthony – you might be the most patient, armor-skinned human being I’ve ever come to be aware of.
Dammit! You booting griff the troll just FORCED me to donate $20 to your cause of ridding WUWT of trolls.
Thank you for the work you’ve done and the work you continue to do. Like I said above, this Bud is for you!
Never thought I would see this day! NOAA doing actual science to check their surface station networks accuracy followed by an admission that it has a bias that runs counter to the warming meme? Then Anthony throwing the Grifftard off his site? Somebody wake me up, I must be dreaming!
Most of the time I just laugh at Griff’s non sequiturs and carry on reading down the line. For a while I was almost looking forward to his chiming in with the lamest of warmunist positions just so I could laugh and move on. Lately though, he has gotten just bothersome.
We do need some pure doctrinal warmunists on the site though. Sometimes there is more good information in the rebuttals given by other commenters than there was in the original article. (Many of the articles, while informative, are on aspects of the problem I’ve already looked at, while the comments provide sources I’ve sometimes never seen.)
We still have Mosh and Nick, though Mosh has been reduced to drive by’s lately and Nick isn’t showing up very often.
I also do not want to see skeptic purity enforced as alarmist purity is enforced with an iron hand at various alarmists sites and “news” organs. However there is a big difference between thoughtful and informed counterpoints or just posting a joke on the subject at hand and the just plain ridged ideological bull hockey that Griff spouts. It is already difficult enough to sift through the chaff to get to the wheat in the comments in some places. Dr. Spencer’s otherwise excellent blog being a case in point where a few wackos inundate the site with their never ending arguments over the same points over and over and over again on most every post.
Yes, I could almost miss Griff. It’s the high-volume spammers like David Appell who can make a good blog like Roy Spencer’s become almost unreadable.
To be fair, Steven and Nick have their own sites and work to do, which I’m sure occupies a lot of their time. How many of us here have spent much time on their sites to see what they’re up to, and comment on their work on their home ground?
Sometimes they don’t get treated very well here, and there’s a bit of name-calling and insinuation that I’d rather not see directed toward people who are doing serious work. I know I’d trust results from them more than I would from Mann or The Gang.
But this is Anthony’s Day of Affirmation, and a hearty congratulations to him and everyone who worked on that effort. A great job all around!
I’m with you, Owen. His comments were usually silly, and provided a guffaw. I also agree we need serious rebuttal consisting of real logic. Mosh is not bad at this, although his arguments have not been sufficient to do more than make me do more research – and conclude his comments were either inadequate of just misleading.
“…To be fair, Steven and Nick have their own sites and work to do, which I’m sure occupies a lot of their time. How many of us here have spent much time on their sites to see what they’re up to, and comment on their work on their home ground?…”
They historically have posted frequently on any number of sites. Seems like Nick’s full-time hobby was posting 99% on sites other than his own.
I have visited it many times. Usually he takes an argument he is losing here and spins it to his echo chamber to make it appear the opposite. At least he has not recently claimed that Anthony was deleting his posts here and swearing to never return here. “Comment on their work on their home ground?” Lol, give it a shot.
Thank you Anthony, again!
Good riddance to brain-dead fools!
Here, here! Griff should have been booted a long ago after he slandered Dr Crockford and Willie Soon! He is a slime and does not deserve any time on any site.
Anthony koodos for your continuing efforts to try a hold back the hoards of crazies from taking over this world and for constantly trying to bring reason, facts and integrity to the debate.
He’s not incapable of assimilating new information, he is unwilling to; especially new information that might not confirm his existing bias.
Anthony – you should “Suffer fools gladly”. Otherwise, we risk becoming as closed minded as the climate alarmists.
How about suffering slanderers?
Walt,
Griff is not a simple fool, he is either willfully ignorant, or more likely, here to disrupt serious conversation with outright lies and slander. Either way, I think we have all suffered him long enough.
He’s not ‘dense’ – he’s a deliberate hack and he damn well knows it.
Perhaps Griff is a lesson in Orwellian doublespeak. I think he should stay as an exercise of our critical thinking skills.
While I can’t recall ever agreeing with (or even respecting) anything Griff has posted, I think having people like him here is a good thing. If nothing else, it highlights our willingness to hear the other side.
Of course, it also puts the other side on display, which is often laughable.
It’s true, Anthony. If Griff provides the best arguments for CAGW, then it is obvious to all what a waste that belief is.
Anthony, do you mean GRIFF HAS LEFT THE BUILDING-PERMANENTLY?
Now if Dr Spencer would just boot appel from his site reading the comments might be just that nicer !
Spoken like “The Great One” Mark Levin, who is known for telling obnoxious callers to his talk radio program; “get off my phone, you big jerk!” Griff deserves it.
Anthony – Thank you for your final decision regarding ‘ole Griff (and thanks for the insider info in that he is in fact a he – I think the kids have a word for this – ‘Doxxing”? Did I get that right?). Over the years, Griffy-baby and I have have a few back-and-forths over his inane stances on most things regarding ‘sustainability’ (such as bio-fuel usage by the US Armed Forces during a future wartime situation) and a number of his dig-in-your-heels views on CAGW.
However, on some level I will miss taking him out to the verbal woodshed from time to time. But, for the sanity of all concerned, probably best that he is gone.
Regards,
MCR
awww, don’t ban griff.. what will we do for laughs?
I’ll do what I can
God Bless you Anthony Watts. You took time to help your staff and neighbors through the fires and all of us Americans who love liberty and truth by looking for the warming trend in plain site. Be not weary in well doing.
Griff is so funny! Don’t kick him out please. His hilarious statements always spark interesting reactions. I understand your frustration, but why should you think he will ever change?
He’s an errand boy, sent by grocery clerks.
How sad. He was our village idiot.
This work demonstrates that not only urban stations but also rural stations can be influenced by small-scale urban encroachment.
Indeed small-scale. But it is not only that. Small scale stuff other that buildings affect temperature. When a building is built, anomaly increases. When it is demolished the anomaly decreases. A statistical processing meant to remove these artifacts might actually end up detecting only one half (like painting the wall, fast process), but not the other half (paint slowly deteriorating). Which way these asymmetrical changes work, I have no idea. Stevenson screens at least would be affected.
That’s why the proper response when discovering such a problem is to increase the error bars. Not try to fix the data. Whenever you start fiddling with the data, you might make the data “better” for some periods, but you will end up making it worse for others.
Beyond that, there will always be questions of timing as you point out.
MarkW
The problem is, ‘climatologists’ rarely even use error bars. And, the general Rule of Thumb is that in adding numbers with different precision, all the numbers in the data set should be rounded off to the same precision as the least precise. That creates a whole lot of trouble for those trying to push two or three orders of magnitude greater precision for averages than the actual readings.
Hugs, your “detecting only one half” argument is one of the two objections I have to the Berkeley Earth process. As highlighted in one post from 2015, https://wattsupwiththat.com/2014/06/28/problems-with-the-scalpel-method/, we discussed how the scalpel could, ne should, cut a temperature at the rapid change of conditions at a station site, yet treat the gradual change (deteriorating paint, growth of nearby bushes and trees, population growth nearby) as real climate signal. However, the instances of site recalibration (replacement of thermometers, repainting, plant trimming), would be seen as discontinuities rather than vital recalibration information .
The other half of my objection is firmly in the Fourier Space information content argument. A scalpel is a low cut filter — it removes low frequency information content. High frequency information content cannot be used to predict low frequency content. Climate is a low frequency signal. Therefore the BEST process removes the most critical information from the records before homogenizing.
See: https://wattsupwiththat.com/2011/03/31/expect-the-best-plan-for-the-worst/#comment-568866
MarkW: Amen, Brother! It is amazing how many people forget that a “correction” is the addition of a signed value which itself has uncertainty. Errors always add. Covariance can mitigate, but variance adds! With every correction, the error bars must increase without very strong evidence.
“there was a clear warming trend.”
The question is not if there is a warming trend. At least if you get your science from scientists. The question is (according to the IPCC) if the trend is 4.5C per doubling or 1.5C per doubling. That’s is a big difference. At the moment, it appears theory (models) give higher numbers. This finding lowers observed “real” temperatures where people live, which gives us more certainty that the models are just too sensitive and the warming is less than 3C per doubling. That means a lot when impacts of 3C is unknown, but in the end, we are talking about this not because we disagree on warming or impacts, but because we disagree on climate politics: the amount of money used and how that money is used to tackle climate issues.
My take is that money is best used to adapt. We can’t stop using energy because that would be an economical disaster, and eventually, a disaster in non-economical terms.
There never has been a question about our current warming trend. The questions would be. Is the trend unprecedented or unusual, is the duration long enough to be significant, is the warming trend likely to continue, accelerate or decelerate, and are there any dangers associated with this extent of warming.
Related questions are. Is the warming caused by humanity and is CO2 the primary driver, and is it necessary, possible, or desirable for warming to be stopped or lessened.
Clearly the political will for action is evident in only a few jurisdictions and their combined actions are not likely to have a significant effect, if any.
If someone is a true believer in CAGW, I would suggest they take action to reduce their own vulnerability rather than waste time and energy trying to change the world.
Some of the warming is caused by the humanity. More than 50 % since 1950 says the IPCC. Could be near 100 per cent, Gavin says over 100%.
But even if it is 150%, it appears not to be a reason to panic. Humanity can adapt. It must adapt since we don’t have an ongoing energy revolution. Cheap solar is not here, only worthless solar. And that’s the fact.
griff May 3, 2019 at 1:45 am
Actually griff ,,, it is scientific . Game over
BEST never went out in the field and tested this. Complete misleading BS.
Might be useful if you read the Fall and Watts paper.
I did a study of 2013 records from the CRN top rated US surface stations, as rated by surfacestations.org. It was published Aug. 20, 2014 at No Tricks Zone. Most remarkable about these records is the extensive local climate diversity that appears when station sites are relatively free of urban heat sources. 35% (8 of 23) of the stations reported cooling over the century. Indeed, if we remove the 8 warmest records, the average rate flips from +0.16°C to -0.14°C. In order to respect the intrinsic quality of temperatures, I calculated monthly slopes for each station, and averaged them for station trends.
Later I updated that study with 2014 data and compared adjusted to unadjusted records. The analysis shows the effect of GHCN adjustments on each of the 23 stations in the sample. The average station was warmed by +0.58 C/Century, from +.18 to +.76, comparing adjusted to unadjusted records. 19 station records were warmed, 6 of them by more than +1 C/century. 4 stations were cooled, most of the total cooling coming at one station, Tallahassee. So for this set of stations, the chance of adjustments producing warming is 19/23 or 83%.
https://rclutz.wordpress.com/2015/04/26/temperature-data-review-project-my-submission/
Ron
Do I understand correctly that your analysis showed greater variance in the high quality stations than those influenced (buffered) by thermal ballast?
Clyde, not sure what you mean by “thermal ballast.” It is the case that the well-sited stations records (uncontaminated by UHI) displayed local climate diversity, until of course that was adjusted away.
I should have added, the results from the unadjusted data confirmed the trends in the Fall and Watts paper.
Griff,
Berkley Earth sorted urban and rural stations by use of satellite measurements of nigh time lights. They provide no information regarding the validity of that means of sorting. For example a temperature station to a building which operates during the day and is closed at night may have few lights a night but would remain a source of man-made heat nonetheless. They concluded from this work that the urban effect is small. What NOAA has shown by running an experiment whereby temperature stations were placed at increasing distances from a known building heat source is that the urban effect is quite large.
I’ll have to go with NOAA on this one. It seems that Berkley Earth, despite being at a great university, is simply careless.
This site would have counted as rural under the Berkeley Earth standard.
I’ve checked the “night-light” method for Swedish GHCN sites. It’s completely useless. The GHCN coordinates are not nearly precise enough. They can be off by anything up to several kilometers.
You have to verify the coordinates by actually finding the measurement site on air/satellite photos, plus have access to reliable metadata about site shifts.
Berkeley Earth isn’t Berkeley U. Berkeley Earth is an independent non-profit.Note this one donor: Charles G. Koch Charitable Foundation ($150,000)
Even rich guys can get fooled by charlatans.
Griff – do you have a real study here written by people? If so, cite it. At least give us the year and lead or corresponding author’s name so we don’t get confused with some other Berkley Earth study, of which there are many.
Why do I suspect “confusing us” is exactly your aim?
I live a mile outside of a small 6,000 person rural town. On cold mornings in the winter I’ve seen the temperature 12 degrees Fahrenheit cooler where I live than in town. Yes I’m using the thermometer from my car dash, but it goes up as I go into town and down when I leave town. Most days there is no real noticeable difference but on some of those cold winter days there is a big difference and all that UHI is caused by a small rural town that grew from from 700 people in 1880 to 6,000 today.
…and Berkley adjusts 0.2 degrees for UHI
and get to claim adjustments lower the temp
Serious question: Does anyone know what the surface pixel size of the satellite temperature data is? If it is ~100 meters or less (10 ideally), I propose the following experiment: Every time the satellite flies over a weather station (that is not blocked by clouds), the data from the satellite is recorded with the weather station’s temperature, humidity, wind speed and direction, along with the satellite temperature for the pixels going out a kilometer or so. After a while, with variable winds directions and speeds, a good map of the transported UHI heat at various times of day and lighting (or night) conditions would be created that would allow the clever to put the weather station temperature record in much better calibration and context. (I use to work for an organization that was developing space based sub-ten meter multi-spectral imaging sensor.)
I agree, but remember…it is the change over time of urban development around a sensor that is key to the ‘trendline’. If the sensor was always there and no further development occurred than we might be able to use its trend with some sort of confidence, but if development increased over time then we cannot have confidence and in most cases, development has increased or sensors were moved etc…
My place is about 5 miles northwest as the crow flies from the closest town, which also is a small (less than 5000) country community. Lately, I have been using weather underground for my local forecast. There is a PWS in the town,near thew school complex, and another PWS about a mile due west of me. There is a consistent temperature difference of 3-5 degrees (f) every time I go to the site and toggle between the 2 stations. It should be obvious to anyone open minded that even small rural development has more of an effect on temperature than CO2 ever can.
In the Phoenix area in summer nighttime temperatures vary greatly: hot in the metro areas, warm in the desert, and cool in the groves and fields. Placement is everything.
I wonder what Berkley Earth and NOAA did differently that the NOAA concluded that temperature trends ARE being distorted. And by that I mean, what did Berkley Earth NOT do that they failed to identify what was going on?
See post above….they did not inspect each site’s location directly, they used satellite ‘night light’.
Griff, what is it about you acolytes that you insist on lying about what others are saying.
Nobody is saying that there is NO warming. What we are saying is that the tiny amount of real warming (as opposed to the artificially generated warming) is well within the range of normal and is not in any way dangerous.
The problems with Berkeley Earth and there well cooked and seasoned books has been documented over and over again.
I’ve used this quote from Richard Lindzen innumerable times:
“Stated briefly, I will simply try to clarify what the debate over climate change is really about. It most certainly is not about whether climate is changing: it always is. It is not about whether CO2 is increasing: it clearly is. It is not about whether the increase in CO2, by itself, will lead to some warming: it should. The debate is simply over the matter of how much warming the increase in CO2 can lead to, and the connection of such warming to the innumerable claimed catastrophes. The evidence is that the increase in CO2 will lead to very little warming, and that the connection of this minimal warming (or even significant warming) to the purported catastrophes is also minimal. The arguments on which the catastrophic claims are made are extremely weak – and commonly acknowledged as such. They are sometimes overtly dishonest.”
But the marching brooms just pause… and then just keep right on going.
Not to hurt anyone’s feelings, including the knowledgeable scientists contributing to this site, but Richard Lindzen, years ago, had already told us everything we need to know about global warming, CO2 and unworkable biofuels, wind and solar. Continuing to beat this dead horse is a gross waste of time and money-including me reading almost every word of every posting on WUWT. I’m retired so me wasting my time on these subjects is no different than reading fiction. But to continue to waste tax $billions studying this “dead horse” and subsidizing building monuments of stupidity: Ethanol plants, wind towers, and solar panels is senseless. I’d love to be wrong. Please tell me any meaningful, significant new finding that disputes Lindzen.
You-Are-an-ID EEE IT!
His computer likely has an ID-10t operator issue; The IT people tell me that this problem is (after initial investigation) somewhat easy to diagnose, but it is very difficult to correct.
(they gave up trying to fix mine & told me I just have to live with it.)
The “real warming” is more accurately represented by the compliant stations that it is by the non-complaint stations.
What part of THAT statement do you want to take issue with, Griff?
The temperatures of non-complaint stations are influenced by their surrounding environment to show a warming trend. This warming trend is of a greater magnitude in non-compliant stations than in complaint stations!
Once you accept what the data is telling you, then wisdom can find a home between your ears.
Actually, Berkeley was rejected because they failed to consider that delta T varies as delta Urbanization.
Instead Berkeley looked at delta T versus sum(delta Urbanization).
Berkeley made the classic mistake of comparing acceleration to distance rather than speed and thus missed the correlation.
When looking for correlations you must consider derivatives and integrals. Otherwise Time can obscure the relationship.
Berkeley Earth doesn’t even know to include the resolution limits of the historical instruments. That is a freshman mistake. They are literally inventing data out of thin air.
Also, the USHCN sensors are unaspirated. Even well-sited stations will have an uncertainty range of about ±0.4 C, because of uncompensated irradiance and wind-speed effects.
The global average air temperature record is a monument to false precision. The people involved are incompetent.
Griff, BEST looked a urban vs. non-urban but many non-urban stations have been effected by artificial changes to the local environment.
Griff,
it appears you forgot a few things, you didn’t post the source, failed to back up your cherrypick claims, not address the post, and that you show no intention to be involved in a meaningful debate with anyone.
This means you will NOT be missed around here.
It’s funny when you call picking unbiased sites “cherry picking.” Also ironic.
Thank you, Griff, for demonstrating through your insightful comment that the Berkley Earth analysis is dishonest and not to be trusted.
I take this message to heart. Although, in truth, it has been demonstrated before, it really must be given even more credence when a catastrophist admits it.
===|==============/ Keith DeHavelle (@DeHavelle)
Griff
The UK met office recognises UHI. They make an allowance for it in CEntral England temperature dating to 1659 . The general records they use dating to 1910 Do not allow for it which is why they generally run too high and temperatures break records sometimes
We are a very small country with 65 million people. Of course millions of buildings and road will make a difference. The impact of UHI was recognised in ancient Rome
Tonyb
It took NOAA long enough, but the wait was worth it.
Congrats, Anthony, et al.
Regards,
Bob
It will take griff considerably longer…
“It is difficult to get a man to understand something, when his salary depends on his not understanding it.”
Like a Black Hole…The denser the object, the harder it is to escape
In their defense, to do this study right would take 10 years or more to get enough data to make statistical significance determinations.
Kudos to them for finally undertaking a real scientific experiment to quantify the effect. I have a feeling this will have to run for quite a while to nail the numbers down with any precision. Also they will probably need to do the same sort of thing for station siting near asphalt paved surface and various field plantings and irrigation setups. (I don’t think doing it for burn barrel positioning is really needed, that one was always one of my favorites.)
I don’t think it would take 10 years. If you blanket an area with hundreds of weather stations in a grid, you could quickly piece together the thermal profile of the area. If you do that in several different areas you would learn a lot within a single year. Whether that’s enough may depend on the data.
Given the stakes and the spending levels being proposed, it’s imperative that such a study be commenced immediately.
While qualitatively you can get answers in a year, it really takes all the different seasonal types, complete with rainy years and drought years, El Nino/La Nina years, to quantify how the different weather patterns quantitatively affected the readings.
Of course if they don’t do that they need to just admit the current database is not fit for the purpose of climate assessment and start over. They probably need to do that anyway. Real adjustments will need real data that is quantified on all the various parameters of a site. Or they can wait for the USCRN to get enough data for climate use and project from there. If the Climate Reference Network is showing less warming, then likely the databases currently in use are wrong.
I think after one year you’d have enough to justify a restatement of the data. Another nine years will get you more accuracy, but I suspect you’ll be 90% of the way there after a relatively short period of time.
Anthony looks like vindication to me. And when ever I hear about the “official” adjustments to the temperature record, the adage “figures lie and liars figure” comes to mind. It’s always struck me that you posses that rare commodity “common sense” when you look at the AGW claims. It’$$$ pretty clear who the real “climate denier$$$ are”. I hope you enjoyed that beer, would buy you one if I could.
Anthony, looks like vindication to me. Whenever I hear about the adjustments to the “official” temperature record, the adage “figures lie and liars figure” comes to mind. Wish I could buy you that beer.
Congratulations. Had Anthony Watts and the surfacestations project not highlighted this issue years ago, this would not have happened today. Many thanks.
Greg
I think we have to assume this is true. I don’t see that anyone else has put in the time to make a convincing argument. We realise there were many others participating in the citizen science reassessment of station performance. Absent that, who would have thought NOAA or other highly touted services were not doing their jobs properly, especially something as simple as recording temperatures.
I tip my hat to all those who literally went the extra mile to examine the condition of these national data-gathering assets.
Good man Anthony! I’ve just put enough for a bottle of “Vin”dication in the top jar. Cheers!
…tip…
Science 101 , yous means of collecting data must be at least as good as the certainty of the statements you make based on that data.
Let us be honest and clear for years climate ‘science’ has got away with a ‘better then nothing ‘ standard in various areas such has oceans , proxies , land measurements etc The use of airport based system never intended to be used in this manner being merely on example while ‘magic tree rings ‘ is perhaps both the most hilarious and missed-used . Given the difficulty of accurate weather predictions for years when all of issue where near this did not matter. Now with the claims of ‘settled science’ and the demands based on this claim . This ‘better than nothing ‘ system really is a bloody problem that needs addressing , and so its oddity given the hug sums of money poured into the area and the claims of ‘most important event ever and no time to lose ‘ and the data collection system which really would allow us to understand what is going on , remains a long way below the scientific standard required to take measurements in a meaningful way .
You have earned that beer!
I’ve been following this since the beginning and always knew you were right. I live just outside of a small town and , particularly in winter, when I drive the mile into town the car’s external thermometer always increases by 1 or 2 degrees C. Congratulations.
Same for me. I live outside a small rural town. Typically in winter it’s a few degrees Fahrenheit warmer in town than outside of town. I’ve seen it up to 12 degrees F warmer in town than just outside of town on extremely cold winter mornings. Just a small 6,000 person rural town.
There’s a reason they call it “Berzerkly”………
GOOOOAAAAAAALLLLLLLL!!!!!
Just about all I can say.
very good stuff!
despite the lack of an x-axis, the trends in Fig4 are also appear interesting – the “pause” and recent downward trends might be worthy of comment….
yup thats vindication in spades!! 😉
it was damned obvious and your work really showed it up.
as for griffs comment… facepalm mate! Anthonys proved correct and sometimes you should man up and admit that the clisci mob are WRONG
Congratulations, Anthony! The Griffs of the world are groaning…
Surface Station rules! Congratulation. But didn’t adjustments take care of poor locations. LOL
Not so fast
‘The impact of the built environment on air temperature diminished with distance with a warm bias only detectable out to tower-B’ located 50 meters away.”
Now, one major problem with the Le Roy standard that anthony has used is the the Le Roy
standard ( CRN 1,2,3,4,5) was never FIELD TESTED.
So now we have a good first test of how far away from a built structure you should be.
50 meters at least.
So this is just the beginning. But its good news because the Le Roy standard has never been tested.
and now it would be a good time to go revist all of the station ratings
And, how many of your other givens have never been field tested?
Here’s one:
http://www.globalwarming.org/wp-content/uploads/2013/06/CMIP5-73-models-vs-obs-20N-20S-MT-5-yr-means1.png
And here’s another:
https://wattsupwiththat.com/2019/04/05/whats-the-worst-case-climate-sensitivity/
Time to review all your beliefs, my boy.
Sceptical Sam – “And, how many of [Steven Mosher’s] other givens have never been field tested?
Steven Mosher commented on a recent article here, and in an effort to imply that CO2 can be dangerous at high concentrations, he said water becomes toxic at high concentrations. I’m curious if Steven Mosher is aware of the marine ecosystem.
Food is lethal over time if you eat too little or too much.
We need a food tax to fix this.
!!! BREAD IS DANGEROUS !!!
Research on bread indicates that:
1. More than 98 percent of convicted felons are bread users.
2. Fully HALF of all children who grow up in bread-consuming households score below average on standardized tests.
3. In the 18th century, when virtually all bread was baked in the home, the average life expectancy was less than 50 years; infant mortality rates were unacceptably high; many women died in childbirth; and diseases such as typhoid, yellow fever, and influenza ravaged whole nations.
4. More than 90 percent of violent crimes are committed within 24 hours of eating bread.
5. Bread is made from a substance called “dough.” It has been proven that as little as one pound of dough can be used to suffocate a mouse. The average American eats more bread than that in one month!
6. Primitive tribal societies that have no bread exhibit a low incidence of cancer, Alzheimer’s, Parkinson’s disease, and osteoporosis.
7. Bread has been proven to be addictive. Subjects deprived of bread and given only water to eat begged for bread after as little as two days.
8. Bread is often a “gateway” food item, leading the user to “harder” items such as butter, jelly, peanut butter, and even cold cuts.
9. Bread has been proven to absorb water. Since the human body is more than 90 percent water, it follows that eating bread could lead to your body being taken over by this absorptive food product, turning you into a soggy, gooey bread-pudding person.
10. Newborn babies can choke on bread.
11. Bread is baked at temperatures as high as 400 degrees Fahrenheit! That kind of heat can kill an adult in less than one minute.
12. Most American bread eaters are utterly unable to distinguish between significant scientific fact and meaningless statistical babbling.
In light of these frightening statistics, it has been proposed that the following bread restrictions be made:
1. No sale of bread to minors.
2. A nationwide “Just Say No To Toast” campaign, complete celebrity TV spots and bumper stickers.
3. A 300 percent federal tax on all bread to pay for all the societal ills we might associate with bread.
4. No animal or human images, nor any primary colors (which may appeal to children) may be used to promote bread usage.
5. The establishment of “Bread-free” zones around schools.
But the dangers of dehydrogenase monoxide are well recognized.
https://www.dhmo.org/facts.html
You mean Dihydrogen Monoxide.
dehydrogenase is an enzyme.
Have you ever read the Safety Data Sheet for DiHydrogen Oxide? You would never touch another drop of that stuff its so hazardous. Especially dangerous are the acute respirational effects and excessive ingestion leading to the thinning of vascular electrolytes. Bad stuff.
Did you know that fresh dihydrogen Monoxide is some 1800% more acidic than sea water !!
‘The impact of the built environment on air temperature diminished with distance with a warm bias only detectable out to tower-B’ located 50 meters away.”
That is the impact from a building at only one quadrant. What happens when encroachment occurs on one or more other sides, as towns and roads are built? The second parking lot will have less of an impact as the first, but nevertheless, detection of a warming bias well past 50 meters away seems logical. Few stations will be unaffected by UHI bias for 100 years. Anthony has been on the right track all along. There is undoubtedly a warm bias in the official record, probably significant.
Great news – well done. I flashed back to the NOAA/NASA warmest year ever press release a few years ago (2015?). The global temp was 0.04C higher, with a 38% probably. One can only imagine how badly located many of the “global sites” used are (and homogenized, pasteurized etc). Surely the location of a sensor could easily result in a 0.04 difference. When records and averages are based on 0.001, 0.01 and 0.10Ts, results and press releases are meaningless. Every government and academic “scientist” should take a course in the climate near the ground based on Geiger’s classic text.
with a 38% probably….and no gamble would bet on those odds
Seconding BobM’s observation!
N.B. The picture demonstrates this with a single almost linear line of stations in one direction out of 360+ directions.
“downwind” is only valid when downwind happens to align with USRCRN’s feeble attempt to assess downwind UHI temperature influences.
An attempt that is so feeble that one can be surprised USRCRN admitted any UHI influences as the research experiment appears to minimize ability to assess downwind exposures.
Why didn’t NOAA install an array of sensors around their somewhat UHI isolated building? An array that should have thoroughly covered 360° of downwind influences.
Leaving us with an emphasis upon USRCRN’s “small-scale encroachment on temperature observations”!
That is; these research observations are strictly for small building complexes.
Undetermined are those UHI influences for small towns up through urban centers and airports. Small-scale encroachment on temperature observations should be considered the minimum UHI possible.
These results clarify the need for USRCRN to fully and properly investigate UHI throughout the range of human developments.
ATheoK,
RE: “Undetermined are those UHI influences for small towns up through urban centers and airports. Small-scale encroachment on temperature observations should be considered the minimum UHI possible.”
As I was reading Anthony’s article and the related posts and comments, I came to the same conclusions that you so succinctly stated above.
The Le Roy Standards: Class 1 > 100m from heat sources, Class 2 > 30m
Class 1 • Flat, horizontal land, surrounded by an open space, slope less than 1/3 (19°). • Ground covered with natural and low vegetation (< 10 cm) representative of the region. • Measurement point situated: o at more than 100 m from heat sources or reflective surfaces (buildings, concrete surfaces, car parks etc.) o at more than 100 m from an expanse of water (unless significant of the region) o away from all projected shade when the Sun is higher than 5°. A source of heat (or expanse of water) is considered to have an impact if it occupies more than 10 % of the surface within a circular area of 100 m surrounding the screen, makes up 5% of an annulus of 10m-30m, or covers 1% of a 10 m circle.
Class 2 • Flat, horizontal land, surrounded by an open space, slope inclination less than 1/3 (19°). • Ground covered with natural and low vegetation ( 10m, Class 4 “close” to sources, Class 5 everything not included in Class 4…
So this study shows that even Le Roy Class 2 stations have some warming bias, and Anthony’s study using Class 1 and 2 may be understating the actual bias.
Steven Mosher, you’re absolutely correct. Now let’s test the impact of different size communities. If 1 building is 50 meters how about a small 6,000 person community? Or …
Anyone living in a rural environment knows there’s a significant difference, now let’s put some some numbers to “significant” and apply them to the current stations.
One thing it does do is prove mankind’s BIGGEST impact on temperature is LAND USE, but adds a series of questions to the science as currently practiced.
Exactly. The next phase of study should be to select a test area to blanket with weather stations to measure all those various impacts.
Politicians are proposing to spend trillions of dollars. Any funds expended here will be money well spent.
My understanding is the experiment assessed the presence of a building. Were a big city adjacent to the to the building out of the picture, it would have an effect beyond 50m.
Gary
Yes, Dale Quotrochi (NASA remote sensing scientist) studied Atlanta and found evidence that weather was being affected out to 20 miles (if I remember correctly) downwind. I would guess that the affected distance is proportional to the size of the city, and may vary with the climate.
That was a small building and parking lot. Many of the stations are being encroached by much bigger buildings and parking lots, and on multiple sides as well. Many have been surrounded as well.
The well documented trend difference between stations that actually are well sited vs the rest is well documented and can’t be explained away with your standard wishful thinking.
Secondly, there’s a big gap between the second station and the third. 50 meters to 124 meters.
An honest scientist would say that the difference is not detectable at 124 meters.
A dishonest scientist would say, as Steve does, that the difference isn’t detected past 50 meters.
Correct the first measurement you see no change at is the one that should be used as the standard
+10!
Now would also be the time to specify the measurement uncertainty at the 95% confidence limit for all stations used all over the world. Now would be the time to demonstrate how these uncertainties would be combined. Now would be the time to include the combined uncertainty in all temperature graphs as upper and lower bounds. Now would also be the time to demonstrate how these uncertainties are calculated and publish the methods for critical examination by other scientists, mathematicians, engineers and metrologists.
Mr. Mosher:
I just wanted to thank you for bringing this NOAA study to Mr. Watts attention. I agree with you that “now it would be a good time to go revisit all of the station ratings”. Also, I agree with Sceptical Sam that it would also be a good time to review all of the assumption that go into the theory of Global Warming.
“So now we have a good first test of how far away from a built structure you should be.”
Certainly, this is just a first step to determining what sort of adjustments need to be made to the data.
As a first pass, could we simply discard all the data from all the stations that became compromised over time? The difference between the temperature rise of the uncompromised stations and the discarded stations should be close to the average required downward adjustment.
I have thought for many years that statistical outliers due to UHI should be removed from the temperature calculations instead of adjusted and subsequently averaged back. There has never been any real attempt to calculate an accurate UHI for any site, only estimates and conjecture. Without a highly reliable downward adjustment, those data points are useless for any purpose. The data points should be excluded from any calculation. Inclusion of any data that is known to be incorrect is poor procedure and produces a specious result. Guessing at an adjustment and then using the data anyway is fraud.
Agreed.
I found on the NOAA site, in 2010, information describing how they handle and compensate for what they call “Urbanization Effects.”
The link I saved is no longer active. I wonder why!
http://www.ncdc.noaa.gov/oa/climate/research/ushcn/
I wish that I would have captured the text, but assumed the link would be preserved.
NOAA explained that temperatures which are used (and then called data) go through “several algorithms” to give the results. The algorithms adjusted for population change and some other indirect measurements to improve the data. There was a statement in there that they knew the algorithms worked because the results were what they expected.
Send a FOIA (Freedom of Information Act) request to NOAA and they will send you the paper.
I’d like more help on this.
I found this, Mario. Hope you find it helpful…
In the fourth paragraph from the top, “urbanization effects” are mentioned. While this is only the “Introduction,” it may provide you with papers/search terms to find out more.
https://www.ncdc.noaa.gov/ushcn/introduction
That Karl guy, as you likely recall, proved to be a shyster. See WUWT articles about him — you can find some by searching for “Karl” in Watts Up With That and the Battle for Science — The First Ten Years , compiled and edited by me and offered as a donation to Anthony to raise money for WUWT and to celebrate in 2016. I don’t think he is making it available anymore — no mention of it or link to it anywhere on WUWT that I could find, so, here is the link to the 2016 page where the pdf is linked to: https://wattsupwiththat.com/2016/11/17/wuwt-milestone-10-years/
I hope this was helpful. You did ask for Moore help, didn’t you? What??? Oh. (smile)
I am looking for the specific article which spoke to several algorithms to give the results. In that article, NOAA explained that they knew the algorithms were correct because the results were as expected.
Sorry that wasn’t helpful, Mario.
When I go to my mom’s apartment where my laptop is, I will use her wifi and try to find that article for you.
If this thread is closed before I can do that, I will try to find you somewhere else on WUWT.
Dear Mario,
I’m writing this little note to let you know that I’ve tried and tried for hours today here at my mom’s apartment to find that NOAA quote. I can only find related articles and blog entries and some “Page Not Found” Error messages. I’m sorry to disappoint you, but, I am giving up. So bummed… I really wanted to find that for you. Grr. I think I will swear like that old loser, Nye — NOT 🙂
Rather, I will focus on the positive: I learned quite a bit from all that reading! 🙂
I hope that all is well with you.
Janice
I think NOAA disappeared the evidence of their hokum.
Dear Mario,
I’m writing this little note to let you know that I’ve tried and tried for hours today here at my mom’s apartment to find that NOAA quote. I can only find related articles and blog entries and some “Page Not Found” Error messages. I’m sorry to disappoint you, but, I am giving up. So bummed… I really wanted to find that for you. Grr. I think I will swear like that old loser, N.y.e. — NOT 🙂
Rather, I will focus on the positive: I learned quite a bit from all that reading! 🙂
I hope that all is well with you.
Janice
Dear Mario (P.S. I left a lot out of this third attempt — trying to get past spm bin!)
I’m writing this little note to let you know that I’ve tried and tried for hours today here at my mom’s apartment to find that quote. I can only find related articles and blog entries and other stuff. I’m sorry to disappoint you, but, I am giving up. So bummed… I really wanted to find that for you. Grr. I think I will swear like that old loser, N-word (heh) — NOT 🙂
Rather, I will focus on the positive: I learned quite a bit from all that reading! 🙂
I hope that all is well with you.
Janice
Now that’s funny. Usually, if necessary, you put lipstick on a pig that is not of your own face. Mosher says “ Not so fast”, then goes on to say positive things about the study. Ergo, lipstick on a pig.
Mosher
Well now, if we take many readings over a long period of time we can add another one or two significant figures and we might well discern an influence (albeit small) out to Station C! After all, what is what is done routinely for reporting global averages. /sarc
The time to review the station ratings was long ago when they were chosen as being representative of global trends.
That works fine for me. I placed my VPII 300 feet away. The other problem this doesn’t deal with is rapid build out in local cities that become a much larger heat sink than a single building.
Unfortunately all we have learned is that an otherwise pristine site needs to be further than 50 metres from any new building. This in no way provides guidance on how much we can rely on any sites that are located near larger build structures, like for example airports, new developments, cities etc. It is likely that the influence is far greater that 50m for larger thermal sinks like airports.
Attempting to claim that the limit is a minimum of 50m is ignoring the fact that size of the built structure is likely very important.
What it does say is that there are very few sites that are currently in use that aren’t adversely affected by development.