Guest Post by Javier
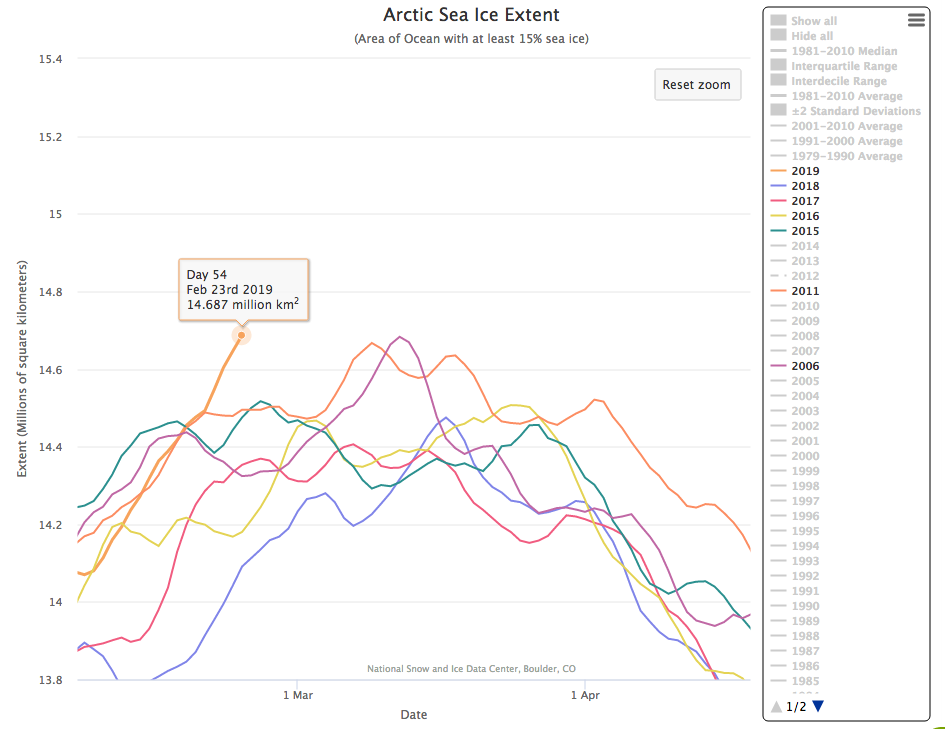
February is not over, and Arctic sea-ice extent is already over half a million square kilometers higher than last year at this day.
The growing season has not ended, and 2019 Arctic sea-ice extent is already higher than the previous four years and six out of the last 14 years.
 Figure 1. Arctic sea-ice extent. Note the left edge of the graph is February 1, not January 1. http://nsidc.org/arcticseaicenews/charctic-interactive-sea-ice-graph/
Arctic sea-ice has stubbornly resisted the very warm years between 2015-2017 caused by the big El Niño. Are we going to see an increase in Arctic sea-ice over the next few years? Only time will tell, but the idea cannot be discarded.
Antarctic sea-ice is also growing this year with respect to last year, so global sea-ice extent is going to see an important jump this year.
Stay tuned for the March results but the “Arctic melting pause” is alive and kicking 12 years later. It started the year Al Gore said Arctic sea-ice was doomed. Talk about timing.
While Al Gore makes a profit, he’s obviously not a prophet.
How utterly inconvenient of the climate not to obey king “Big Al” Canute.
One of the best climate scientist I’ve followed for 20 years is Dr Don Easterbrook, Geologist Emeritus at WWU with 45 years experience. He was the first to determine with accuracy from ice cores, that the Earth goes thru warm and cool cycles approx every 30 years. He also predicted in 1998, that the Pacific would change from a warm current to a cold current, validated by satellite. He also believes this cool cycle we’re in may last until 2050 with a Grand Minimum. He was called “The Scientist That Got It Right” in 2005. Over 30,000 actual climate related scientists have signed off on his research. He has UTube videos and his website is excellent. He explains CO2 quite well – it trails all other atmospheric gases for warming our climate and has zero affect on it.
Fastest way to “grow” sea ice is spray hydrophilic film on arctic/antarctic water surface. It will ice up rapidly. Paper is perfect. A non polar gas will worrk as well.
Rumor is that Al Gore is busy doing revisions to old videos and an old book, to reflect an “updated understanding” of climate change.
I hear that the phrase “The fever has resulted in Earth catching a cold” will be featured prominently.
Could be another Nobel Peace prize for Al if sales are brisk.
Nobel piece prize?
Given Al’s a prior customer of a “rub & tug” establishment, I’m kinda hoping he might have a few words to say about the recent Florida kerfuffle.
You know, something like “just trying to give a couple billionaire a helping hand…”.
The decline in Arctic ice shown on some graphs is largely due to loss of ice in the Barents Sea – perhaps due to the Gulf Stream pushing up further.
The Canadian Arctic has been back to normal for a few years
The Great Lakes are more frozen than usual this year – as illustrated by this histogram from Canadian Ice Services showing lake ice vs week of the year. The green line shows the average over 30 years starting in 1980. https://ice-glaces.ec.gc.ca/prods/CVCSWCTGL/20190218180000_CVCSWCTGL_0010461467.pdf
Similar “early” freeze-ups (actually bank-to-normal freeze-ups) occurred farther north.
Summer breakup has become unreliable, which is why there are no more scheduled very large cruise ships.
The only time all 5 Great Lakes froze solid in modern history was 1979. Bet that would mess up there 30 year ice record.
Summer sea ice minimum has been growing since 2012, and flat since 2007. No new, lower low has been registered since 2012, despite the 2015-16 super El Nino, and two late summer cyclones in 2016. The other low years of 2007 and 2012 also saw August cyclones, which pile up and spread out the floes, reducing the area with 15% ice coverage.
From 1979 to 2012, a new, lower low was recorded within at least every five years. Last year was the sixth summer since the record low.
“Summer sea ice minimum has been growing since 2012”
…
Nice cherry you picked Tillman…..2012 sea ice minimum is the lowest in the entire satellite record.
…
2018 minimum was more than 2 standard deviations below average.
2017 minimum was more than 2 standard deviations below average.
2016 minimum was more than 2 standard deviations below average.
2015 minimum was more than 2 standard deviations below average.
2014 minimum was 2 standard deviations below average.
2013 minimum was 2 standard deviations below average.
…
See any pattern here?
Yes. The pattern is that Arctic sea ice bottomed in 2012. No cherry pick. Just the fact. So far.
Of course we’re still below the 1981-2010 baseline. The dedicated satellite observations started when Arctic sea ice was at or near its high for the century, ie 1979. So of course the baseline is higher than now.
But Arctic sea ice fluctuates naturally in about a 30-year cycle. Its average was as low as now during the 1930s and ’40s, then more extensive during the 1960s and ’70s (although there were some lower years then, too).
The maximum extent in 1974 was 14.4 million km sq according to Parkinson:
JOURNAL OF GEOPHYSICAL RESEARCH, VOL. 94, NO. C10, PAGES 14,499-14,523, OCTOBER 15, 1989
“The dedicated satellite observations started when Arctic sea ice was at or near its high for the century,”
…
Nope.
…
You can’t say that, because you are mixing apples (satellites) with oranges (land based obs)
…
PS, it’s a “cherry pick” because you are using the lowest minimum as a comparison point.
…
For example, the most recent time the minimum was at or above the average was 2001. That’s over 15 years ago. What is probability of getting all heads when tossing a coin 15 times?
Using the record lowest minimum to establish a trend is not a cherry pick. When and if there should be a lower low, then the trend would have been broken or possibly reversed. But for now, as noted, the trend is flat since 2007 and up since 2012. Also as noted, from 1979 to 2012, there was a new low at least every five years. It has now been six years since the record low.
If we used the same means of mapping sea ice extent now as in 1939, the result would be the same.
During WWII, the Northern Sea Route along Siberia was open in the summer, as it is now. But after WWII, it was closed. Which is why the USSR built nuclear-powered ice breakers to keep it open.
That 1979 was near the high is visible in satellite data from before the dedicated record, as well as in sea ice extent maps. The PDO flip year of 1977 was probably the high.
We can be sure that CO2 has no discernible effect on sea ice extent, since Antarctic sea ice grew from 1979 to its peak year of 2014, while Arctic sea ice declined from 1979 to 2012. Yet CO2 is supposedly well mixed.
Similarly, there has been no warming at the South Pole since records were kept there, yet that’s exactly where the effect of a fourth molecule of plant food per 10,000 dry air molecules should be the greatest, due to the dryness of the air there.
It’s not a matter of probability. It’s a trend in a natural cycle, which apparently has reversed, as such trends do.
In 2021, a new 30-year baseline will be used, lower than the current one, which includes the high years of the ’80s.
So you’re suggesting annual Arctic sea ice minimums are an independent event? Is that out of convenience or stupidity?
“Using the record lowest minimum to establish a trend is not a cherry pick.”
…
Yes it is. You also forget that 6 years of data doesn’t establish a “trend” when we have almost 40 years of satellite data. The fact is that the past 6 years of “minimums” have ALL been not only below the 30 year average, they have been 2 standard deviations below said average.
“If we used the same means of mapping sea ice extent now as in 1939, the result would be the same.”
…
Citation for this ridiculous claim?
“Antarctic sea ice grew from 1979 to its peak year of 2014, while Arctic sea ice declined from 1979 to 2012.”
…
STRAWMAN ALERT!!!!
…
STRAWMAN ALERT!!!!
…
Arctic ice is floating on water, Antarctic ice is land bound.
Tillman says: “It’s not a matter of probability. ”
…
Actually, you cannot calculate a “trend” without the use of probability and statistics. Trend calculations contain error bands, which are based on probability.
“That’s over 15 years ago. What is probability of getting all heads when tossing a coin 15 times?”
Like most alarmists, David understands neither statistics nor science.
Of the many things that David is ignorant of, one is the fact that there are huge sheets of floating ice surrounding Antarctica.
@David Dirkse – Tillman explicitly stated Antarctic SEA Ice. Read it again
“STRAWMAN ALERT!!!! …Arctic ice is floating on water, Antarctic ice is land bound.”
There are three types of ice in Antarctica: land-based, shelf-ice (floating but attched to a land-based glacier), and sea ice. Antarctic sea is too floating on water.
David tell me you are not a little bit surprised (disappointed?) That the low was 6yrs ago. Think back what your expectations were for the status of arctic ice extent by 2020. See!
In a galloping warming world with 12 yrs left to mass extinction from heat exhaustion, growth of Arctic ice above such a low 6yrs ago, wouldn’t be possible. Maybe, on some level we are in agreement here if you see global warming to not overpower natural variation. Your investment of time in WUWT hasnt berj entirely wasted, then.
David,
NSIDC disagrees with you. Its staff combines pre-satellite observations with satellite:
“Satellite data from the SMMR and SSM/I instruments have been combined with earlier observations from ice charts and other sources to yield a time series of Arctic ice extent from the early 1900s onward. While the pre-satellite records are not as reliable, their trends are in good general agreement with the satellite record…”
Error bars on a linear regression or other trend analysis is not the same as standard deviation from a baseline. As noted, we’ll soon have a new baseline, and Arctic sea ice will be within one SD of it and eventually above the line, if, as is likely, the uptrend continues.
But you don’t even need to draw a trend line. Just compare the average summer minimum for 2007-12 with that for 2013-18. The past six years have averaged higher than the prior six years, despite a super El Nino. Statistical significance is hard to come by with only 40 data points, but the fact remains that no other six year interval since 1979 has been higher than the previous such period.
Clearly, steadily rising CO2 since 1945 has had no measurrable effect. During that time, Arctic sea ice grew, then fell and is now growing again.
What’s the probability that the temperature in February will be below average? After all it will have been perhaps 100+ days since it was above average …
1) MarkW……If Arctic sea ice was not in decline, in the past 15 years, some years the extent would be above average, and some would be below average. The fact is that in the past 15 years EVERY year was below average. The probability of that happening is equal to tossing a coin 15 times and getting heads on each and every toss. My best guess is that you are ignorant of basic probability, never mind understanding rudimentary statistics.
..
2) One of the facts that MarkW is not aware of is that a satellite cannot distinguish between ice that is over water or over land
…
3) Bush: see item number 2
…
4) Knights: see item number 2
…
5) Pearse: I have no expectations for 2020
Tillman posted: “The dedicated satellite observations started when Arctic sea ice was at or near its high for the century”
..
Subsequently Tillman posted a graphic
…
Note the graphic starts in 1953, so please Mr. Tillman, how can you claim that 1979 was the high for the century? In order for you to do this, you would need to post data from 1900 thru the present to make such a claim.
“Statistical significance is hard to come by with only 40 data points”
..
..
..
BINGO
..
..
Thank you very much Mr. Tillman.
David,
Even NOAA admits that Antarctic SEA ice remains in an uptrend, despite the freakish low year of 2017, from 2016 WX events associated with the 2016 super El Nino.
Actually David, the odds are pretty good. I remember one time I was playing Roulette , kept betting black ….. it just kept hitting red …. I lost my ass.
Ya gotta remember, there is no cumulative probability in a coin toss. …. it is 50/50 for each toss. …. and that is all.
Tilman: http://www.addletters.com/pictures/bart-simpson-generator/bart-simpson-generator.php?line=Six+years+does+not+make+a+trend
Are you aware of the meaning of AUTOCORRELATION ? Sea ice is not a coin toss. Neither is OHC or temperature. If sea ice is low this year there is a good chance it will a little higher or a little lower next year. It is not a coin flip that can revert to 1983 levels in one toss.
It is a interesting after the warmest decade “in recorded history” that minimum Arctic sea ice area/extent has been increasing for the last 6 years. Also the ice volume.
So much for the supposed “death spiral” , positive feedbacks and “tipping points” all driven by wicked CO2 .
Remember when we were told that the Arctic was the “canary in the coal mine”. Well the canary is doing fine. The main point of having a canary in a coal mine is keep checking on its condition and heave a sigh of relief when it is not dead.
Climate alarmists just cuss quietly and go to find a new canary to talk about.
Dr Deanster: “the odds are pretty good”
..
..
1/32768 = 0.0000305
..
..
ROTFLMFAO!!!!!!!!!!!!!!!!!!!
“…If Arctic sea ice was not in decline, in the past 15 years, some years the extent would be above average, and some would be below average. The fact is that in the past 15 years EVERY year was below average. The probability of that happening is equal to tossing a coin 15 times and getting heads on each and every toss. My best guess is that you are ignorant of basic probability, never mind understanding rudimentary statistics…”
NO. This is basic stuff.
The coin flip analogue implies that the extent is independent from one year to another…that’s not the case. The sea ice in a given year is dependent on the starting point.
The heads-and-tails analogue works for sea ice going up-and-down from year-to-year. Did minimum sea ice go down without exception every single year for 15 straight years (e.g., heads when tossing the coin 15 times)? NO.
After 2001, it went up in 2003, 2009, 2013, and 2014…and 2017 as well .
Still down more years than up, and of course the magnitude changes from year-to-year (which is another problem with your failed attempt at the coin toss analogy…it doesn’t account for that).
Has the sea ice minimum been in a decline since 2001? Yes, a basic look at a chart makes that clear. Your failed analogy does nothing but make it clear that you need remedial work in probability.
Greg says: ” Sea ice is not a coin toss. ”
…
True, but tell me, what type of probability distribution allows the minimum to be lower than the average 15 years in a row not to mention that the past 6 years have ALL been 2 standard deviations below that average?
Jankowski, the heads-and-tails analogue works for sea ice going up-and-down from year-to-year IF THERE WAS NO UNDERLYING TREND.
…
The basic null hypothesis which is “There is no downward trend” is proven FALSE by observational data.
…
You confuse “going down” with being “below average.”
…
I don’t need remedial work in probability, the observational data clearly shows that Arctic sea ice extent is going down, has been since the advent of the satellite era, and six years doesn’t negate this downward trend.
The majority of the change in Arctic sea ice happened between 1997 and 2007. That was supposed to be enough to decide we must change the way we run the planet and revert to a subsistence lifestyle and serfdom.
http://www.addletters.com/pictures/bart-simpson-generator/bart-simpson-generator.php?line=ten+years+does+make+a+trend
Sea ice is now at the same level is was in 2007.
http://www.addletters.com/pictures/bart-simpson-generator/bart-simpson-generator.php?line=ten+years+does+NOT+make+a+trend
It’s not a probability distribution, it’s a cycle.
David, David, David
The satellites don’t need to tell the difference between sea ice and land ice. That’s what maps are for. Perhaps you’ve heard of them. They are these new inventions that researchers can use to tell where the land is and where the sea is. That way they can plot the data from their satellites and figure out what ice is on land and what ice is on water.
Regardless: Quite moving the freaking goal posts. You are the one who claimed that all Antarctic ice is land bound.
David, imagine a sine wave with noise. That’s what the arctic is doing.
The fact that ice is currently lower than the highest point in the last 100 years may impress you …
What you have here is one of those “accelerating cosines”.

https://climategrog.wordpress.com/warming-cosine/
If you take a snip out of a cyclic series, you will have a “trend” even if the cycle is mean zero.
The whole AGW panic is based on concentrating on the rising part of a cycle and ignoring the rest.
Greg: https://tse2.mm.bing.net/th?id=OIP.Xx66iqYCxP9p0bhqcBPhXwHaE9&pid=Api
MarkW: “The fact that ice is currently lower than the highest point in the last 100 years ”
…
We do not have 100 years of satellite data.
…
..
Are you grafting non-satellite data with satellite data? Seems to me that that type of data-grafting is not appreciated on this blog. (aka hockey stick or Marcott)
Re: Greg says: ” Sea ice is not a coin toss. ”
…
True, but tell me, what type of probability distribution allows the minimum to be lower than the average 15 years in a row not to mention that the past 6 years have ALL been 2 standard deviations below that average?
————-
A 80 year cycle with an added noise component.
There are numerous global series with a 70-90 year quasi-stable cycle.
There is good reason to think Arctic sea ice extent is one of those. If so, a peak ice extent in 1975 decreasing to 2012 then bottoming out to start increasing would be fully expected. And the next peak should be around 2050-2060.
Greg: “If you take a snip out of a cyclic series”
…
You have no proof of any type of cyclic series with regard to Arctic sea ice extent.
..
Please post your data that shows Arctic sea ice extent is cyclic.
“…Jankowski, the heads-and-tails analogue works for sea ice going up-and-down from year-to-year IF THERE WAS NO UNDERLYING TREND…”
So…if it had dropped 1.5 sq km in year 1 then risen 0.1 sq km each year for the next 14 yrs…it is still a net loss of 0.1 sq km overall, and it never reached the value in year 0. In your world of probabilistic incompetence, this is analogous to heads turning-up all 15 times.
Let’s extend this ridiculous notion of yours even further…the minimum extent has been higher than 2007 for all years since except for 1. So while you want to start in 2001 and calculate the odds of 15 heads, how about the odds of getting 10 tails to 1 head since 2007. Sounds like the coin needs to land on its side for several years.
Greg Freemyer please show me the data for an 80-year Arctic sea ice extent cycle.
..
..
Thank you in advance.
Daivd,
As I’ve already pointed out, the US government does the grafting.
But also, you don’t need a graph to know that Arctic sea ice fell during the 1920s to ’40s, grew from then until the late ’70s, then fell again after that. And is now growing again. Historical documents and proxy data confirm these facts.
Besides which, even today’s ice extent, down from the LIA, is still higher than for most of the Holocene and prior interglacials. Forty years isn’t much to go for analysis of climate change.
David,
How many years do we have to go without a new record low before you accept the reality that Arctic sea ice cycles naturally, and that rising CO2 has negligible effect on these fluctuations?
It has been six years. Ten? Twenty? Forty? If we get a lower low in 60 years, that would just show the natural cycle during a natural warming interval, like the Medieval, Roman and Minoan Warm Periods and Holocene Optimum.
Jankowski asks about probabilistic incompetence.
….
The simple fact of the matter, irrespective of your inability to understand basic statistics, is that the Arctic sea ice extent has not been at, or above it’s 30 year average value since 2001.
..
I challenge you to provide a realistic probability distribution that would explain this.
…
If you cannot, then you apparently are incompetent in basic probability theory.
Tillman says: “Arctic sea ice cycles naturally.”
…
…
Tillman provides no evidence for this assertion.
…
Please provide a link to your evidence to support this assertion.
..
Thank you.
Tillman says: “you don’t need a graph to know that Arctic sea ice fell during the 1920s to ’40s”
…
I need data.
…
Show me your data for evidence of this assertion.
…
They didn’t have satellites in the 1920’s or the 40’s.
Tillman: “How many years do we have to go without a new record low before you accept the reality that Arctic sea ice cycles naturally?”
…
I need to see any/all your data that shows it cycles PERIOD.
David Dickes,
Were you trolling on some previous threads under a different name?
Why are you being so disagreeably obtuse David? You say that you had no expectations for sea ice extent in 2020, back in 2012. I’m happy to take you at your word on that. You may not have been crowing about the imminent end of Arctic ice, but certainly Al Gore and his acolytes were doing so. If I’m not mistaken, the claim was that sea ice would be completely gone during summer by 2014.
It would be decent of you to simply acknowledge that Gore was wrong. You can do that without “compromising” on the fact that the linear trend since 1979 is still negative, which I believe everybody here has acknowledged.
If Javier is right that we are looking at a cyclical trend that is about 60-years peak-to-peak, then it is to be expected that there would be a negative trend that would be leveling off and beginning to advance. You do not need to endorse his theory in order to acknowledge that his theory is consistent with the data so far.
Can you do those two things, and earn our respect as an intellectually honest person, or do you intend to demonstrate that you’re not reasonable?
Rich Davis, nobody can verify that Javier is correct about a 60 year cycle. We do not have 60 years worth of satellite data, and you cannot splice non-satellite data with satellite data to show any type of cycle of more than 40 years. There is not enough data to validate his supposed “theory.”
…
Only data we have shows that Arctic sea ice extent has been in decline since the start of satellite measurements.
“…Arctic ice is floating on water, Antarctic ice is land bound…”
Well Mr. Dirkse, NOAA’s National Sea Ice Data Center has measured non-existent Antarctic sea ice since 1979 to the tune of millions of square kilometers daily…up to around 18 million at peaks.
How many head flips in a row would be the equivalent of there actually being zero Antarctic sea ice?
David, David, David. If you were half as smart as you keep telling us you are, you would know that satellites aren’t the only way that the ice extent can be measured.
” satellites aren’t the only way that the ice extent can be measured. “
..
LOL
…
They are the best way to measure it as they have the best coverage.
As I recall, the loudest voices were saying there would be a feedback effect, and the lower the amount of sea ice, the faster it would decline, and nothing could prevent it.
And as a consequence of albedo effects, in the end it would all just melt away very suddenly.
The idea that it is a coin toss is dumb. There is every indication that sea ice varies in the Arctic varies with the AMO.
Sic years after the 2012 low, and the ice is now back to level seen well before 2012.
It is February, and ice is growing.
And as for cherry picking, how about the alarmista focusing on volume when volume gave the largest decline, thickness when thickness gave the largest decline, and extent when extent gave the largest decline.
Extend is not the same as amount of ice.
It has more to do with winds, as the wind can spread the ice out of compact it together.
And lets not forget the dire warnings about multi year ice, which the alarmista said would never reappear once it melted or was broken up.
Well, thick multi year ice is now increased far above levels of 2012.
There are now huge areas of ice over 4 meters thick! Some ice may be as much as 15-20 feet thick.
Last Summer an ice breaker had to turn back after encountering the worst conditions in many year near the pole, and it could not get through it…and that was late Summer!
In any case, what the hell is so great about a frozen wasteland that blocks shipping?
And what is scary about a somewhat less frigidly icebound polar ocean?
It is a frozen hell up there. The sun will not even rise on the pole for another month, after 5 solid months of not one ray of Sunshine. And when it does rise, it will barely break the horizon and circle the sky slightly over the horizon for a long time, giving light but little if any warmth. Which is why greatest ice coverage and volume keeps increasing for many weeks even after the equinox.
Everyone is sick of the crocodile tears and mock hand wringing of alarmists.
The fact is nothing will upset David worse than increasing ice, as he so amply reminds us here, ad nauseum.
Give it a rest…in a few years you will be completely discredited.
Arctic ice will be gaining, and instead of happy the gloomy doomsday forecast of a milder Arctic wasteland will be proven wrong, and the people that said it was a looming disaster will be gloomier than ever.
I’ve never seen a more pathetic attempt at dissembling.
You are totally missing the point.
The ice is meant to be DECREASING. It has been INCREASING consistently from its low, which was below ‘average’. There has been an INCREMENTAL GROWTH as we move forward in time, back TOWARDS the average. You can’t expect ALL the ice lost over the last decades to reappear in one season!
It’s not a coin toss. The conditions under which the ice is being measured are not static! The factor supposedly leading to ice loss – more CO2 – has INCREASED. So why is ice moving in the opposite direction? Ice loss should be ACCELERATING.
NASA itself has pushed out its ice free prediction to the END OF THE CENTURY due to the slowing decline of the ice. ‘Slowing decline’ is Doublespeak for ‘increasing’ ice or stasis.
Why are you so desperate for calamity?
Dirkse, All you are doing is showing that you do not understand what “cherry pick” means
David Dirkse,
Several times now YOU have been told the decline stopped after 2007, despite numerous prediction by scientists that there would be NO Summer ice by 2008, 2013, 2015, 2018 and so on. Since they have been chronically wrong, why continue to resist the evidence?
http://notrickszone.com/2018/07/21/charlatans-of-the-arctic-laughing-stock-ice-free-arctic-predictions-fake-science-at-its-best/
Meanwhile there have been several published papers showing similar lows back in the 1920-1930’s:
Another New Paper Shows Arctic Sea Ice Has Been INCREASING Overall Since The 1930s
The late 1970’s was indeed a high point of Arctic sea ice in the 20th century.
” David Dirkse February 24, 2019 at 2:15 pm
1) MarkW……If Arctic sea ice was not in decline, in the past 15 years, some years the extent would be above average, and some would be below average. The fact is that in the past 15 years EVERY year was below average. The probability of that happening is equal to tossing a coin 15 times and getting heads on each and every toss. ”
David, with respect,
The probability you use only works if the “odds” are equal and stable, and this presumes that your average is correct for a larger sample size. If your original average is taken over a small sample size, and the points are following a trend, then that average is not valid over a larger sample size. In the case you present, you say the odds of “ice extent” should be like a coin toss, but it shouldn’t. The average you use is very likely to be biased to the range you compute it from and not reflective of a larger sample that is trending or even changing to a new trend.
I don’t know if sea ice extent is going to continue to decrease or start increasing – that is what patience and observational data are for. But I would not bet money that all of the observed sea ice decrease were directly caused by CO2 in the atmosphere. I suspect there is a natural cycle and it will make itself known given a long enough time. We will likely see the decrease slow down, or pause, or reverse given that there is very likely a natural cycle involved. If it reverses (which will become clear given enough observations), that will be another nail in the coffin of catastrophic CO2-induced warming.
When most newspapers and networks and many climate scientists and activists cherry pick things like this all the time (for example droughts, high temperatures, and wildfires using the 70’s as their start), can you blame people for thinking that’s the way it’s supposed to be done? 🙂
Warmer in 1922, unless all involved, scientists, seamen and newspapers were global warming deniers.
https://reason.com/blog/2011/04/01/arctic-sea-ice-a-climate-chang
David,
You’ve been shown repeatedly that Arctic sea ice is cyclic. Do you really imagine that it was unchanging before AD 1979?
It has been reconstructed from proxy data for centuries and millennia, if not longer intervals. Here is a fairly short reconstruction:
https://www.eurekalert.org/multimedia/pub/176002.php
Note that the authors attach satellite observations to the end, however warranted or un- that might be:
https://www.eurekalert.org/multimedia/pub/176002.php
Here’s a longer series:
https://www.researchgate.net/profile/Christophe_Kinnard/publication/51825483_Reconstructed_changes_in_Arctic_sea_ice_over_the_past_1450_years/links/0912f5114f04342a57000000.pdf
Please note the ups and downs, aka cycles.
For most of the Holocene Interglacial, thanks to its long Climate Optimum before c. 5200 years ago, and subsequent balmy intervals such as the Egyptian, Minoan, Roman and Medieval Warm Periods, Arctic sea ice extent has been less than now.
I we consider a cycle cos(2πft) where f is 1/30 to give a 30 year cycle, you will find that the average of the six “annual” points around the minima is -0.937. DOes that help you to understand a little better?
Everyone, do us all a favor and don’t feed the troll.
Wazzzamatta Ray, can’t deal with facts?
Ray in SC,
Okay, but can I add this:
From: http://www.john-daly.com/polar/arctic.htm
John died, but someone has kept his site up, may be Jeff Id, but I’ve forgotten.
LONG POST WITH PHOTOS submarines and ice; note the date at the end here.
“It will without doubt have come to your Lordship’s knowledge that a considerable change of climate, inexplicable at present to us, must have taken place in the Circumpolar Regions, by which the severity of the cold that has for centuries past enclosed the seas in the high northern latitudes in an impenetrable barrier of ice has been during the last two years, greatly abated.
(This) affords ample proof that new sources of warmth have been opened and give us leave to hope that the Arctic Seas may at this time be more accessible than they have been for centuries past, and that discoveries may now be made in them not only interesting to the advancement of science but also to the future intercourse of mankind and the commerce of distant nations.”
President of the Royal Society, London, to the Admiralty, 20th November, 1817 [13]
*13 President of the Royal Society, Minutes of Council,
Volume 8. pp.149-153, Royal Society, London.
20th November, 1817.
Why not? He is driving the comment count through the roof. That makes the article go to the top post list. He is actually making it more relevant.
Trolls aren’t known for thinking things. Just for having a lot of disposable time.
Javier, if you cannot deal with someone that has facts backing up his arguments, please go away. Calling me a “troll” and not confronting my facts makes you look weak.
….
Hultquist one picture of a submarine proves what?
David, is that what you call the nonsense you’ve been trolling?
Heck, you got some nerve, asking me to go away from my own article.
I am not impressed by your supposed facts. Your knowledge of the issue appears quite superficial.
“(This) affords ample proof that new sources of warmth have been opened and give us leave to hope that the Arctic Seas may at this time be more accessible than they have been for centuries past, and that discoveries may now be made in them not only interesting to the advancement of science but also to the future intercourse of mankind and the commerce of distant nations.”
Unfortunately the Royal Navy expedition dispatched to Spitzbergen six months after found this not to be the case.
@Phil;
Do you suppose the general conditions might have changed after 30 years, or were you expecting climate stasis from 1818 to 1848?
Don’t expect warmists to understand math and statistics. If they did they’d see right through their paper-thin religion.
Or 60 years from peak to peak or trough to trough, rather than from peak to trough.
Yes. The decline in Arctic sea ice stopped. The Arctic sea ice coverage is now increasing.
The cult of CAGW ignored the fact that the Arctic sea changes cyclically. The past decreases and increase in Arctic sea obviously were not caused by changes in atmospheric CO2.
http://notrickszone.com/wp-content/uploads/2019/02/Arctic-sea-ice-extent-1900-2017.png
Looks like it has been declining since 2014.
The 2012 low caused so much open water to lose heat that 2013 and 2014 rebounded strongly, despite steadily rising CO2 and allegedly global average air T.
But the growing trend was so strong that even during the El Nino years of 2015 and 2016, which latter suffered two late summer cyclones, no new low record was set.
Thus confirming the reversal of downtrend, just as students of the history of Arctic sea ice predicted.
If the theory of AGW had any validity, the ice should have kept shrinking, setting new lows every year.
2012 was also the year of several huge late autumn storms that broke up sea the sea ice.
PS, the satellite era began with some of the highest sea ice in a century. So you are also guilty of cherry picking.
“If the theory of AGW had any validity, the ice should have kept shrinking, setting new lows every year.”
Weather conditions have quite a strong influence on annual extent, as noted by several above and below. Annual fluctuations that are larger than a multidecadal trend are normal. What would be very odd is seeing monotonous year-on-year change in one direction with no ups and downs. If that were the case for Arctic sea ice, you could be sure that the data was being fudged.
“PS, the satellite era began with some of the highest sea ice in a century.”
You really should provided something to back that up.
http://www.carbonbrief.org/wp-content/uploads/2016/08/Walsh-et-al.-2016-Fig8.png
The first graph is from NSIDC, mentioned above, the second from the old Cryosphere Today website (now defunct, I believe), and the third with various sources detailed here.
Always cite your sources, if you can.
I think you are missing the main point. We were told 12 years ago that the Arctic was melting so fast that we were in real danger of loosing Arctic summer sea-ice in just a few years. That message was based on expert assessment of polar climate.
12 years later there is the same sea-ice extent. Either we were lied or the experts weren’t so, or both.
And that is the problem with climate change. There aren’t experts on it. And we are asked to make fundamental changes to our economy and our energy production system based on bad assessment.
There should be a pause in climate change policies until we have a better understanding and some real experts that know what they talk about. Meanwhile we can put all that people in climate change to a better use. Perhaps they could generate electricity by pedalling on a pedal-power generator. Right now all they eat is wasted.
“There should be a pause in climate change policies until we have a better understanding and some real experts that know what they talk about.”
But where are we going to get those people from? Most of the real climate scientists are ageing, retired, or hounded out. We are left with a generation of C-grade sycophants with their snouts in the global warming trough. Worse still, it has already contaminated the rest of publicly-funded science and will probably take at least another generation to correct.
If someone were to reassign funding priorities from CO2 induced global warming and the current models to ocean dynamics, emergent phenomena, solar radiation effects, land use climatic effects etc., many of the current “climate scientists” would become experts overnight. There are thousands of “climate scientists” working in government, universities and institutes (centres of excellence!) that need big government money to pay the rent.
Javier,
Well said Sir!
Javier, please stop confounding past predictions with current data.
..
Arctic sea ice decline has not reversed course since the advent of satellite measurements.
…
Get with the program. The past six years have ALL been 2 standard deviations below the 30 year average.
That has an easy solution, David Dirkse. They will not be 2 standard deviations below the 30 year average when the 30 year average is 1991-2020.
Stop hyperventilating about a question of baselines.
LOL @ur momisugly Javier…….so instead of it being 2 standard deviations below the average, when they change the baseline, it will be one.
…
How long will we have to wait before the minimum hits the average of the new baseline?
…
Ignoring the long term trend makes you look foolish.
You appear to ignore that the long term trend does not contain information about what comes next. Extrapolating linear trends is the really foolish activity.
The fact that the ice melts more or less while the planet warms is a trivial observation. That is what well-behaved ice should do during a period of warming, doh!
The important thing is to know what drives sea-ice to melt more at certain times than others and what relationship that has with other climatic phenomena. It is clear that if we can’t predict how the sea-ice melts we don’t understand it. The so much talked about albedo effect that should accelerate the melting is a weak effect, since the ice hasn’t melted in 12 years.
And I particularly fail to understand what is so worrisome about the sea-ice melting. For all we know the planet might cool better without it, since during the dark winters it separates the relatively warm ocean from the very cold atmosphere limiting heat loss.
1) “The important thing is to know what drives sea-ice to melt”……..Answer: warmer temperatures.
..
2) ” since the ice hasn’t melted in 12 years.”…… WRONG 2012 (the lowest minimum) happened within the past 12 years
..
3) “he planet might cool better ” ……..except the data shows this isn’t happening.
…
Again, you are ignoring the fact that the Arctic sea ice is in decline.,
Wrong answer. 2015-2018 warmest years = no further melting.
Yet we have more ice than 12 years ago so no melting. Or if you prefer it melting and then refreezing.
The planet has cooled very efficiently since February 2016, and considering the little warming since 2002 I would dare to say that the data does not refute the hypothesis. The pause in Arctic sea-ice since 2007 at very low levels more or less coincides with a period of little warming except for a big El Niño that was efficiently cooled down.
Hell no, I even have my own model on how Arctic melting should proceed:
http://wattsupwiththat.files.wordpress.com/2017/10/100517_1140_arcticicena6.png
So far is doing better than official models.
It is from my previous article on Arctic sea ice. You would learn a great deal by reading it.
https://wattsupwiththat.com/2017/10/05/arctic-ice-natural-variability/
“considering the little warming since 2002” ………wow…so if it hasn’t been warming since 2002, why was the Arctic extent the lowest on record in 2012?
…
“The pause in Arctic sea-ice since 2007” …….. wow… so if it paused in 2007, why was the Arctic extent the lowest on record in 2012?
…
“I even have my own model” ………you have a GIGO model? I like real data, throw your model in the nearest trash can.
…
Nothing you say can refute the fact that Arctic sea ice extent is in decline, and has been since the advent of satellite monitoring.
David, look up the 1990 ICC Report. It shows the early 1970’s to be about the same as we are now. That is before the IPCC cut the pre 1979 data to show we are declining. Perfect scene for the followers like David.
I thought you were the one that had the data. 2012 had really unusual Arctic weather during spring and summer, so the answer to your question is weather, not climate.
Good boy. Then you can ignore everything the IPCC says, as it is all model-based.
Arctic sea ice extent was in decline. Something that hasn’t declined in 12 years is not in in decline. Is stable.
Perfect, even requiring them to pedal enough to keep their screens lit would show good faith effort to their cause, and be an important lesson in energy reality.
David.
I don’t think that’s possible. 2 standard deviations is about 5 percent of measurements. There were only 40 measurements. Ie years. That means only about 2 years could be at 2 or greater standard deviations.
Yeah, and 2019 also looks to be two standard deviations below average as well, and not as high at this stage as the infamous 2012 minimum year.
I did not ask you to verify Javier’s theory. I specifically specified that you should not need to endorse the theory in order to say that the data we have in the 40 years since 1979 is consistent with his theory. If it is not, then how is it not?
I notice that you also completely ignore the question about Al Gore’s claims of an ice free Arctic by 2014. Here I am asking you simply to acknowledge that the data we have is not consistent with Gore’s prediction. Nothing more.
Ok, one last time, asking you to demonstrate some semblance of being reasonable and intellectually honest.
1) Al Gore’s claims are irrelevant to the discussion we are having. Attempted diversion doesn’t help your argument. In a similar vein, the nuclear power industry claimed that with fission, electricity would be “too cheap to meter.” I will continue to ignore any mention you make about Gore because it has no bearing on what is actually happening in the Arctic.
..
2) You cannot make any assessment of a theory about a 60 year cycle with only 40 years of data.
You are right that one should be extremely cautious about mixing different systems of measurements, but that said, we have more than 40 years of data to see whether the amount of ice appears to be cyclical in nature.
Vnnikov the lead author of IPCC AR1 chapter 7 showed his centennial assessment of Arctic Sea Ice extent, with 5 year smoothing and this shows cyclical trends.
We have HADCRUT 3 covering temps north of 66 feg, which shows the 1920s/1930s warmer than today.
We have numerous newspaper articles published in the late 1800s through to the 1960s discussing Arctic Sea Ice trends.
We even have measurements of ice thickness going back to the 1950s which suggest that the thickness today is about the same as it was in the 1950s.
Taking everything as a whole there is a strong case that Arctic Sea Ice is cyclical in nature.
I would agree with others who have pointed out the lack of correlation between sea ice (Arctic and Antarctic) and CO2.
Well if you compare Al Gore’s statements to a prediction of nuclear power too cheap to meter, then you are implicitly acknowledging that Al Gore was wrong. But the fact that you can’t just acknowledge it is proof that you’re not reasonable.
If the expected curve based on Javier’s theory is sinusoidal, and the data had been falling since the start of measurements until recently bottoming out and starting to rise again, that is consistent with the expected curve based on the theory. If the data resumes a negative trajectory before returning to approximately its original value, it would falsify the theory.
The fact that the data has not yet falsified that theory is all that I was asking you to acknowledge. In such a scenario, it would be totally expected that the last 15 years should be below the mean because the expectation is not a horizontal line, but a sine wave. You were not asked to agree that the theory is true or could have a physical basis. You were not asked to estimate the period or amplitude from looking at several periods of data. You were just asked to acknowledge that it could be true because the data does not falsify the theory up to now. Yet you refuse to do so. So, I have to conclude again that you are not reasonable.
Verney “Taking everything as a whole” we don’t have enough data to verify ANY cycle.
…
“We have HADCRUT 3 ” …..but that doesn’t measure sea ice extent.
…
“newspaper articles ” do not measure sea ice extent.
..
“We even have measurements of ice thickness” ……they also do not measure sea ice extent (apples/oranges)
Davis: “and starting to rise again”
..
NOPE
You are exasperating, David. You would be correct to assert that we don’t have statistically-significant data to state that extents are starting to increase again. I did not make that claim, and that is not what I asked you. I asked you to acknowledge that the data we have is still consistent with Javier’s theory.
Put another way, can you demonstrate the null hypothesis to falsify Javier’s theory using the data that we have? Such a minimal acknowledgment that is nothing more than a restatement of your prior position minus the dogmatic certainty that you know “what is happening in the Arctic.” (Even though inconsistently, you have no expectation for ice extent in 2020).
Apparently admitting to anything short of omniscience would undermine your true objective. What is that objective, we might ask? It certainly is not to advance understanding through the scientific method.
David, you said
Fine, I hope for NO arctic sea ice all year round esp. in winter but if that doesn’t happen or does, so what?
David Dirkse,
What about these scientists no summer sea ice predictions?
Wadhams, Hansen, Sereeze, Maslowski and more:
http://notrickszone.com/2018/07/21/charlatans-of-the-arctic-laughing-stock-ice-free-arctic-predictions-fake-science-at-its-best/
You should stop digging a hole, a deep hole.
Please see the Willis E. article on long term persistence. It is very common for measures of natural phenomena to move in trends or bunches. If it is sunny today, there is a better than even chance it will be sunny tomorrow because high pressure systems tend to hang around for a few days. This is the reason that the old reliable weather forecast of “the weather tomorrow will be the same as today” is about as reliable as Environment Canada’s weather forecast. We don’t have enough accurate measures of Arctic sea ice to understand “normal” patterns but a betting man would feel good wagering that yearly fluctuations are not purely random.
David Dirkse said: “Nice cherry you picked Tillman…..2012 sea ice minimum is the lowest in the entire satellite record.” And also: “See any pattern here?”
Nice change of subject, Dirkse. Gore’s prediction was that sea ice would be gone by 2016. None left. Zilch.
Gone, not would just lower than in the past. Gore’s prediction, along with that of least two scientific papers, was off by well over a million square miles. See any pattern here, Mr. Dirkse? Like an epic fail?
There is only one non cherry picked date and that is today. One can ask how far back from today can one look to see, say a flat trend. That’s a legitimate question.
And that started in 79. So? its cyclical. That’s teensy weensy picture. You are cherry picking.
Unprecedented vertical trend inbound. Save the children. Obviously not those we should currently continue to push under the bus but the others, as yet unborn
That was my take on the most recent apparent trend. Polar ice increasing at the same time that NH winter temperatures are plummeting. That’s not a good thing.
And it snowed in Southern California last week.
Tomorrow, atmospheric intrusion will hit the Northeast. It will be a surprise.

Sorry: ” stratospheric intrusion”.
https://origin.cpc.ncep.noaa.gov/products/stratosphere/
But the ice isn’t thick
But the ice is compromised by Co2 content
But the Arctic satellites are being sabotaged by BIG OIL
But … EXTREME Polar Vortexing weather!!!
The pancake-to-crêpe hypothesis of Arctic sea-ice. It is the same extent but thinner. Alarmists are irrational.
They are also wrong. Sea ice volume has been on an upward trend since we have been able to measure it.
Arctic Sea Ice Reality:
https://climategrog.wordpress.com/cpom_arctic_ice_vol_mths/
Jenji,
You forgot the /s.
According to NOAA’s NSIDC, yesterday’s extent was higher than in the five past years:
http://nsidc.org/arcticseaicenews/charctic-interactive-sea-ice-graph/
*Extent* means absolutely nothing at all. There will be sea ice where the temp is more than 8°F below the freezing temp of the local ocean’s freezing point. The *thickness* of any ice is more important but the ice being thin only shows that there is more circulation beneath the surface and that snowfall has faded compared to previous years.
So the extent means absolutely positively abjectly and scientifically (as well as statistically) NOTHING AT ALL.
That’s why the warmists keep pointing out that it is shrinking.
Except that summer minimum extent, as reported by NSIDC from satellite observations, has stopped shrinking. It has been flat since 2007 and rising since 2012.
There will be more ice in the central Arctic.
http://ocean.dmi.dk/arctic/plots/meanTarchive/meanT_2019.png
http://masie_web.apps.nsidc.org/pub/DATASETS/NOAA/G02186/plots/4km/r00_Northern_Hemisphere_ts_4km.png
http://masie_web.apps.nsidc.org/pub/DATASETS/NOAA/G02186/plots/4km/r11_Central_Arctic_ts_4km.png
But the massive amount of Arctic sea ice for 2019 …… won’t prevent NASA et el from proclaiming 2019 as the “hottest year ever”.
Samuel, the outlook is for more adjustments as per the Karlization that adjusted the Dreaded Pause out of existence. The radiometers are confounded by drift or sone such.
Och, aye, the dilithium crrrystals werrre imprrroperrrly installed.
Although Javier’s graph is also from NSIDC data, the first graph on the Charctic site shows yesterday higher than 2014, as well as 2015, 2016, 2017 and 2018.
Yesterday already had more Arctic ice than any day in 2015-2018. That is not yet the case with 2014 that in some days of March had more ice than yesterday.
I see what you meant. I was just comparing yesterday’s date with the same day in the previous years.
It had more than 1974’s maximum also.
It is also lower than 2012 which ended up being the lowest summer minimum on record. And
incidentally the ice extent for January was about the 3rd lowest on record.
The pause is going on 19-20 years now, and it seems ever so gradual cooling of the NH is now the new trend. How long this will last, who knows but there certainly isn’t any scientific evidence that we are warming past some tipping point. More ice km2 at the northern pole on this date is evidence of that.
This should also be cause for a pause in the alarming Alarmism that is now ravaging the news cycle about why we should be panicking about climate change. Nothing could be further from the truth. We are living in the most benign weather and climate that the world has seen for 99.99% of the last 2.6 million years.
According to the ~65-year oscillation in many climate indices and predicted solar activity for SC25 it should last until the mid 2030s to early 2040s.
I can’t remember the exact date but probably more than 5 years ago Julia Slingo, head of UK Met Office, said that it was likely that there would not.be a return to warming before 2030.
This was when the pause was recognized and had not been erased by adjustments.
So she obviously accepted that there were natural forcings dominating the forcing of CO2.
Not clear to what extent she accepted cyclical nature of AMO and the like
So the alternative to AMO being cyclical would be that the oscillation is random with no fixed or approximate period? Sometimes it fluctuates up for a few decades then down for a couple of years, then up for a century, then it bounces back and forth every three years? No way to predict even an approximate period? How would that comport with reality?
The link shows how the increasing AMO trendline and more recent decreasing trendline intercept at the peak AMO.
The Summer Arctic sea ice lowest minimum recorded occurred at this exact moment.
http://www.woodfortrees.org/plot/nsidc-seaice-n/normalise/from:1995/plot/esrl-amo/from:1995/trend/plot/esrl-amo/from:2003/trend
We recorded the lowest Summer Arctic sea ice minimum with the highest recorded AMO in recent history. All expected with the AMOC and AMO hugely contributing towards the anomalous behaviour of Arctic sea ice.
Not surprising this minimum has not been reached since because the AMO hasn’t quite reached this equivalent level again yet. If the AMO peaks again in the near future a possible 2012 minimum will occur again, but if the AMO cools long term this minimum will not been seen again for a long time.
The AMO is not supposed to become negative until another 14 years time.
Unless my arithmetic be off, .01% of 2.6 million years is only 260 years.
We could well be in the balmiest time since AD 1759, although the 1930s might have been warmer.
Other intervals in the Holocene adding up to 260 years were definitely toastier than now, not to mention even warmer previous interglacials, such as the last one, the Eemian.
“We could well be in the balmiest time since AD 1759, although the 1930s might have been warmer.”
The mid 30s were most certainly very hot relative to averages in the historic record but after NOAA got done adjusting them they were just a itty bit above average.
Sadly true.
And they’re not done adjusting yet. Plus now, they cook the raw data books, so their thumbs are on the thermometers.
NOAA is a corrupt, criminal conspiracy, and Trump has yet to muck out the stinking stables.
In the Australia blogs I have read that the BOM there changed the thermometers from mercury to electronic which measure every second, so a blast of hotter air will more likely raise the daily high to a level above what would be read on a mercury thermometer. Then they said they had to adjust the mercury data but they cooled that data from the past which makes no sense. Just wondering if anyone knows what they are doing in the States.
In the Australia blogs I have read that the BOM there changed the thermometers from mercury to electronic which measure every second, so a blast of hotter air will more likely raise the daily high to a level above what would be read on a mercury thermometer. Then they said they had to adjust the mercury data but they cooled that data from the past which makes no sense. Just wondering if anyone knows what they are doing in the States.
Same thing.
They installed the new devices over a period of years, and used that as an opportunity to adjust millions of temp readings from the past forever years all over the country. Instead of noting on the graphs that a change was made and leaving the data alone.
It is not data anymore, it is a result based on their modelling of what the readings should have been, and lo and behold the adjusted readings in every case make the trend over time more monotonic.
They claim they want to remove bias from the records.
That is a great idea: Let removed the biased warmistas who are in charge of collecting, compiling, adjusting, and readjusting the records, since their bias is so blindingly obvious, to ignore it or pretend it is not evident is itself proof of bias.
“We are living in the most benign weather and climate that the world has seen for 99.99% of the last 2.6 million years.”
Maybe, it’s getting ready to pounce.
Is it the most benign, if so, why?
Could it be due to slight increase in the CO2?
Does modern technology, allow us to be less surprised?
Or is it just due to our recent experience of living thru the Little Ice Age, which makes it only seem
to more benign, and there were plenty of times in the 2.6 million years which as good or much better?
What causes thew last 2.6 years to be bad, is that large amount of the time, that was during glacial periods. Or obviously more than 1/2 the time or more than 75% of the time, was very bad.
But what is not good about current times we live in, is all the land area of deserts, so in the times when the Sahara wasn’t a desert, it could been a better time. And it was green for many thousands of years.
“Could it be due to slight increase in the CO2?”
I don’t think there is much hope for people that ask that question.
And we are living right now in the most malign (colder) weather and climate that the world has seen for 90% of the last 540 million years. The world is in an icehouse condition. That is why there are massive ice sheets over Antarctica and Greenland.
In the scheme of things, even now, we are probably well on our way moving out of the interglacial in the NH into a full blown ice age within 6000-7000 years. And in the bigger scheme of things, it may be we are heading for CO2 extinction at some point in the next several million years when some future ice age and CO2 falls below 150 ppmv. That is all a long way off for us presently, but is probably more accurate than the alarmist world of a potential Hot House Earth caused by CO2.
But for right now, especially the last 100 years or so, we have been in a goldilocks zone of some of the the most favourable weather/climate that could be dreamt possible which combined with fossil fuels led to a exponential explosion in human population and knowledge. The Goldilocks principle states that something must fall within certain margins, as opposed to reaching extremes. The Goldilocks principle is derived from a children’s story “The Three Bears” in which a little girl named Goldilocks finds a house owned by three bears. Each bear has their own preference of food, beds, etc. After testing each of the three items, Goldilocks determines that one of them is always too much in one extreme (too hot, too large, etc.), one is too much in the opposite extreme (too cold, too small, etc.), and one is “just right”.
We are presently in that “just right” zone the last 100 years. While we can definitely handle some additional warming from here, any major cooling trend would indeed be bad news to this ‘just right’ climate we have been experiencing that has led to such overall good fortune. Let’s hope the present warming sticks around for another 1000 years or so without too many dips into another worse LIA.
We think that we are in the just right zone, just because that is the zone we are. As hairless tropical mammals we could probably be much better off in a Miocene world, and we would have an entire continent and a very large island more to play with.
The loss of all the fauna and flora that lived in Antarctica, the crepuscular continent, was a great loss to the planet. Of the thousands of plant and animal species that lived there only the emperor penguin was capable of adapting, and remains as the emperor of the lost continent.
Even New Mexico and Arizona are seeing increase in ice extent! You can walk on frozen ground from Arizona to India… in late February.
Ski the Superstitions!
If this keeps up according to my “computer model” New York will be under a 1/2 mile of ice in 30 years
It’ll still be the warmest year evah! though.
The ice in the central Arctic began to grow rapidly from February 5.
http://masie_web.apps.nsidc.org/pub/DATASETS/NOAA/G02186/plots/4km/r00_Northern_Hemisphere_ts_4km.png
February has been brutally cold over much of the NH.
Here is the UK we have a warm spell.
It’s weather.
But Scotland recently [Thursday 21st???] had a new record high temperature for February, beating a temperature form [IIRC] 1897 [so more than a century ago].
Per the Met Office.
I do not believe the temperature was taken at Aberdeen airport immediately after the 1325 London -bound jet had passed . . . . .1
Auto
Here IN . . .
My fault. Sorry.
Auto
The heat has to be hiding somewhere, to make it so cold over most of North America and Eurasia. Parts of northern Africa, too.
Those southerly winds from last week compacted the ice towards the poles, and yet extent grew rapidly anyway.
Because it is extremely cold over the Arctic right now.
Those southerly winds have now reversed, and northerly winds seem likely to cause more ice gain from freezing additional ocean areas, and also from ice being pushed back south from the compacted state it is in near the pole.
I would be willing to bet any warmista that 5 years from now Arctic ice will be greatly increased from current levels.
Would be, except for an annoying habit of them all to make bets and then slink away what they lose the bet, as someone named Tony when his bet with me, right here, of no ice by the end of Summer (his position) was utterly wrong.
But I will make such a bet, if our host will hold the money in an escrow account or something like that. $1000 minimum, in $1000 increments.
Put up or shut up.
Even with all that cold air that poured down over Chicago creating new temperature lows in IL, IA, OH. WUWT??
All time low temp records for entire states, not daily records, not individual sites.
Lowest ever recorded, for the entire state.
People froze to death in their homes…young and healthy people.
College student froze to death walking to his car.
A man froze to death right outside his home.
Downtown LA just reportedly had the first snow since 1962. Nearly 60 years.
Places in Arizona that apparently do not know what snow is have massive accumulations.
More snow is coming for the Sierra, over 3 feet over the entire range in coming days, with over a foot of rain in spots below the snow line.
Heaviest snowfall ever recorded on any date for a huge number of locations, including normally snowy Flagstaff.
Warmista have an uncanny knack for predicting the opposite of what is about to happen.
If their streak holds, it is gonna be wet and cold in a lot of places for a long time to come.
Impossible! Arctic ice is vanishing!
Global warming resulted in the polar vortex moving all the cold arctic air south this winter once again, so adjusted data proves that there’s less ice than ever before!
When folks read sea ice in articles, they really need to stop and think about what kind of metric is involved (extent, area or volume). Almost universally the reference is to sea ice extent, but not always. Sea ice extent is affected by wind as much as it is by temperature (wind can decrease sea ice extent in freezing temperatures). Authors will almost always be referring to sea ice extent, because that serves their narrative when it decreases, but they don’t mention it otherwise. A more accurate metric would be sea ice area, but since the technology to quantitatively measure sea ice (in all regards: extent, area, volume) is so limited, sea ice extent is used as an easy cop out, and a convenient tool when it decreases.
The graph shows the annual variation of the volume of the sea ice in the Northern Hemisphere, excluding the Baltic Sea and the Pacific. The volume of the ice is calculated on the basis of the ice thicknesses from the HYCOM-CICE model. In each grid cell the volume is calculated as thickness multiplied with concentration and with area, with contributions from all grid cells to the total volume. The grey band around the climatologic mean value corresponds to plus/minus one standard deviation based on the 10-year average 2004-2013.
http://polarportal.dk/fileadmin/polarportal/sea/CICE_curve_thick_LA_EN_20190223.png
“In each grid cell the volume is calculated as thickness multiplied with concentration and with area, with contributions from all grid cells to the total volume”
Everything is determined from concentration (extent, area and volume), which is simply the 16-bit RGB pixel value (gray scale) on passive microwave satellite photos. All of it is highly modeled; none of it is a direct measurement.
eh, sorry, 8-bit RGB… 0-255
Commendably, Javier made it abundantly clear that he was talking about sea ice extent
You can see that the volume is higher than in El Niño years.
I don’t trust volume, as it is not measured.
Neither is sea ice extent. It is modeled from photo pixel value.
Photo pixel value is a measurement, and a measurement that it is repeated every day, so its measurement error gets corrected all the time and is smaller. Volume is just an educated guess.
But raw pixel values are not sea ice extent; they are sea ice concentration. The passive microwave signals are so weak that lots of stuff skews the signal: rain, snow, snow cover on ice, wind speed, etc.. So a lot of assumptions have to be made about those things and algorithms applied to get the final sea ice extent product (that’s what they actually call the raw data after it has been massaged).
That’s why you can get different sea ice extents from different agencies that use the same raw data. They all make different assumptions and employ their own proprietary algorithms.
Raw pixel values are not sea ice extent but they depend on sea ice extent. It is a proxy, in the same way the mercury in the thermometer is a proxy. No proxy is perfect, they all have issues.
Volume is just made up from assumptions built into a model. The fact that pixel values are fed into the model does not prevent the assumptions from being in control. Volume from different sources is obviously a lot more different than extent from different sources, as the assumptions are not the same.
Again, assumptions are made when calculating sea ice extent. That’s why there’s a long wait from the time the raw data are posted until data massaging is complete and the final sea ice extent product is released to the public. The raw data are meaningless because too many factors affect the signal.
Volume calculations require additional, or different, assumptions.
Here’s what wind does to ice extent – compresses and stacks ice reducing extent. This just happened on Lake Erie when the ice dam broke.
https://buffalonews.com/2019/02/24/the-ice-book-has-broken-poloncarz-reports/
That guy was being very incautious. He was lucky he was not killed.
That can happens when the adrenalin starts flowing.
You can wait for the moment when they desperately play it down as an outlier or a measurement error.
I’m almost certain.
After a few consecutive years of outliers, maybe it will finally out liars.
Arctic volume of sea-ice is either flat or slightly increasing over the last 8-9 years depending on which data set you like- for January at least.
http://psc.apl.uw.edu/wordpress/wp-content/uploads/schweiger/ice_volume/cryosat_piomas_awi_ts.2011.2019.Jan.png
Arctic sea ice has long been thought of as the “canary in the coal mine” indicator of global warming, so it’s followed closely. As of now, although the canary may be frozen in a solid block of ice, it’s still alive.
Yes there may be ice, but it is rotten ice so it doesn’t count. Besides the settled science tells
us the the Arctic has been ice-free since 2014, so there!
/sarc
They have already established that global warming can cause global cooling (vortex). I’m sure we will hear that global warming also can cause more ice. sarc/sarc
Usually skating on thin ice when trying to jump on the bandwagon of thin ice, JAXA went down yesterday after 3 massive jumps in a row.
Obviously recovering from the delayed effects of 2 years of El Niño in 2016.
Broken 14,000,000 sq km.
Has been as low as 3rd and as high as 12th lowest twice this year in it,s recovery.
Needs to fill the central Arctic basin hole in ( nearly done) and get some Atlantic side expansion in the short 20 days average left to growin.
Go ice go.
Ignore the anti Al Gore effect for once.
The real difference between the anomalies of a high minimum year and a low minimum year begins in early- to mid-May. For example, look at 2012 — the famous low minimum year the alarmists still use. The 2012 winter (early March) maximum line pretty well tracks the 1981-2010 median until starting in mid-May when 2012 line starts heading down at a much faster rate than the median. Curiously, this mid-May time coincides with the CO2 seasonal witch from increasing CO2 to decreasing CO2 for the Northern Hemisphere.
While the sea ice maxima extent date (early March) is surely governed by increasing insolation by early March (and nothing is growing then in the Arctic either), the beginning sea-ice anomaly deviation begins in mid-May that differentiates between a high ice minima year and a low ice minima year. This suggests something other than insolation or even water temps are at play. There is of course “memory” from one year to the next in terms of amount of multi-year ice, but this curious timing with the CO2 seasonal swings suggests a biological input as well, as well as a possible coupling between sea ice removal allowing more ocean surface CO2 outgassing.
And the annual NH CO2 growth rate curve is largely governed by when in September the CO2 curve turns flat and starts increasing by 1 October. Again, this is quite similar year to year to when the sea ice extent decrease turns flat in September for that year.
Unfortunately on the biological side, measuring Arctic Ocean plankton primary productivity through chlorophyll fluorescence of the high latitude regions is technically limited by the method satellites such as OCO-2 measure chlorophyll florescence.
at any rate, compare:
https://www.esrl.noaa.gov/gmd/ccgg/trends/graph.html
http://nsidc.org/arcticseaicenews/charctic-interactive-sea-ice-graph/
So we can see CO2 is indeed the sea-ice extent Magic Molecule. (Mann-nical laughter warranted)
I hope that is correct. However, the line on the graph
does look a bit odd, it could be an error
To nie błąd, ale długość jednostki na osi pionowej.
I have in mind 2019 graph section
Sorry.
This is not an error, but the length of the unit on the vertical axis.
http://masie_web.apps.nsidc.org/pub/DATASETS/NOAA/G02186/plots/4km/r00_Northern_Hemisphere_ts_4km.png
This will come as very bad news to the Warmistas. It is not at all the news that they want.
I wonder what it will be like on January 20, 2031, the day before the world ends, as proclaimed by AOC.
The world will end in 2036 when the asteroid Apophis hits the Earth. They are just not telling anyone.
Five more years! It’s good to be optimistic.
Yikes! That’s close.
The unknown is the change in course by that close encounter that will send it back our way in 2036. Now, I know the government is saying it will not hit us then either and will actually miss us by even more, but then they surely wouldn’t tell us if it will hit us.
Tom, we know for sure it will not encounter anything close enough in the meantime out there that will change its course? What a relief.
1. There is almost zero chance of it hitting based on the latest calculations
2. It’s not big enough to cause anything other then local damage not world ending anything.
12 more years… duh
I cherrypick 1935
Heh, Go Baby Ice, Go. A wintry blast from the past. A Polar Snorfax.
====================================
Must be the positive NAO:
https://www.cpc.ncep.noaa.gov/products/precip/CWlink/pna/month_nao_index.shtml