Guest context by David Middleton
The headlines…

What’s actually in the report
Volume I of NCA4 (Climate Science Special Report) features this nifty image of projected global temperatures (°F) for several Representative Concentration Pathway (RCP) scenarios. RCP2.6 is a drastic mitigation scenario, RCP4.5 is a strong mitigation scenario, RCP8.5 is bad science fiction and often described as “business as usual.” All the really bad stuff happens in an RCP8.5 world.

Figure 1.4 shows the projected changes in globally averaged temperature for a range of future pathways that vary from assuming strong continued dependence on fossil fuels in energy and transportation systems over the 21st century (the high scenario is Representative Concentration Pathway 8.5, or RCP8.5) to assuming major emissions reduction (the even lower scenario, RCP2.6). Chapter 4: Projections describes the future scenarios and the models of Earth’s climate system being used to quantify the impact of human choices and natural variability on future climate. These analyses also suggest that global surface temperature increases for the end of the 21st century are very likely to exceed 1.5°C (2.7°F) relative to the 1850–1900 average for all projections, with the exception of the lowest part of the uncertainty range for RCP2…
I downloaded HadCRUT4 and UAH 6.0 from our friends at Wood For Trees. After converting to Fahrenheit and applying static shifts to match NCA4’s baseline, I overlaid the real data on the NCA4 image and projected UAH 6.0 to the end of this century.

Looks like the forecast for 2100 is slightly warmer than RCP2.6. RCP2.6 is a world in which atmospheric CO2 tops out at just over 400 ppmv and the world runs out of oil…

Most of us look at temperatures on thermometers. A thermometer at the same scale as a typical temperature anomaly plot would be about 64′ tall. So, I took the liberty of reducing the temperature anomaly plot to the same scale as a thermometer, a genuine Texaco thermometer…

Volume II, Chapter 2 features this summary of what the climate would have done without Texaco…

This what they say about the image above…
Figure 2.1: Both human and natural factors influence Earth’s climate, but the long-term global warming trend observed over the past century can only be explained by the effect that human activities have had on the climate.
Sophisticated computer models of Earth’s climate system allow scientists to explore the effects of both natural and human factors. In all three panels of this figure, the black line shows the observed annual average global surface temperature for 1880–2017 as a difference from the average value for 1880–1910.
The top panel (a) shows the temperature changes simulated by a climate model when only natural factors (yellow line) are considered. The other lines show the individual contributions to the overall effect from observed changes in Earth’s orbit (brown line), the amount of incoming energy from the sun (purple line), and changes in emissions from volcanic eruptions (green line). Note that no long-term trend in globally averaged surface temperature over this time period would be expected from natural factors alone.10
The middle panel (b) shows the simulated changes in global temperature when considering only human influences (dark red line), including the contributions from emissions of greenhouse gases (purple line) and small particles (referred to as aerosols, brown line) as well as changes in ozone levels (orange line) and changes in land cover, including deforestation (green line). Changes in aerosols and land cover have had a net cooling effect in recent decades, while changes in near-surface ozone levels have had a small warming effect.18 These smaller effects are dominated by the large warming influence of greenhouse gases such as carbon dioxide and methane. Note that the net effect of human factors (dark red line) explains most of the long-term warming trend.
The bottom panel (c) shows the temperature change (orange line) simulated by a climate model when both human and natural influences are included. The result matches the observed temperature record closely, particularly since 1950, making the dominant role of human drivers plainly visible.
Researchers do not expect climate models to exactly reproduce the specific timing of actual weather events or short-term climate variations, but they do expect the models to capture how the whole climate system behaves over long periods of time. The simulated temperature lines represent the average values from a large number of simulation runs. The orange hatching represents uncertainty bands based on those simulations. For any given year, 95% of the simulations will lie inside the orange bands. Source: NASA GISS.
This is what I think of panel (a), “All Natural Influences”…

Most of the serious banter has been about how Gorebal Warming will wreck our economy…
Climate Change Is Bad News for the Economy, U.S. Government Says
By BLOOMBERG November 24, 2018
The Trump administration just published a major report documenting the advance of climate change, weeks earlier than expected and on a day many Americans are occupied with family and holiday shopping. The news is predictably bad, but this time the tally comes with a pricetag—one significantly larger than you’ll find at the mall.The report catalogs the observed damage and accelerating financial losses projected from a climate now unmoored from a 12,000-year period of relative stability. The result is that much of what humans have built, and many of the things they are building now, are unsuited to the world as it exists. And as time goes on, the added cost of living in that world could total hundreds of billions of dollars—annually.
[…]
The rest of the article was even stupider.
Apparently, these dire economic forecasts are based on RCP8.5 and research funded by Tom Steyer…
4 Problems With the New Climate Change Report
Nov 27th, 2018
f you’re like me, you’re happy the White House released the latest version of the National Climate Assessment on Black Friday. Publishing the 1,700-page report the day after Thanksgiving saved me from unwanted dinner conversations about our planet’s impending climate doom.
But if your aunt calls you up this week spouting claims of mass deaths, global food shortages, economic destruction, and national security risks resulting from climate change, here’s what you need to know about this report.
1. It wildly exaggerates economic costs.
One statistic that media outlets have seized upon is that the worst climate scenario could cost the U.S. 10 percent of its gross domestic product by 2100. The 10 percent loss projection is more than twice the percentage that was lost during the Great Recession.
The study, funded in part by climate warrior Tom Steyer’s organization, calculates these costs on the assumption that the world will be 15 degrees Fahrenheit warmer. That temperature projection is even higher than the worst-case scenario predicted by the United Nations Intergovernmental Panel on Climate Change. In other words, it is completely unrealistic.
2. It assumes the most extreme (and least likely)climate scenario.
The scary projections in the National Climate Assessment rely on a theoretical climate trajectory that is known as Representative Concentration Pathway 8.5. In estimating impacts on climate change, climatologists use four representative such trajectories to project different greenhouse gas concentrations.
To put it plainly, Representative Concentration Pathway 8.5 assumes a combination of bad factors that are not likely to all coincide. It assumes “the fastest population growth (a doubling of Earth’s population to 12 billion), the lowest rate of technology development, slow GDP growth, a massive increase in world poverty, plus high energy use and emissions.”
[…]
3. It cherry-picks science on extreme weather and misrepresents timelines and causality.
[…]
4. Energy taxes are a costly non-solution.
The National Climate Assessment stresses that this report “was created to inform policy-makers and makes no specific recommendations on how to remedy the problem.” Yet the takeaway was clear: The costs pf action (10 percent of America’s GDP) dwarf the costs of any climate policy.
The reality, however, is that policies endorsed to combat climate change would carry significant costs and would do nothing to mitigate warming, even if there were a looming catastrophe like the National Climate Association says.
Just last month, the Intergovernmental Panel on Climate Change proposed a carbon tax of between $135 and $5,500 by the year 2030. An energy tax of that magnitude would bankrupt families and businesses, and undoubtedly catapult the world into economic despair.
These policies would simply divert resources away from more valuable use, such as investing in more robust infrastructure to protect against natural disasters or investing in new technologies that make Representative Concentration Pathway 8.5 even more of an afterthought than it already should be.
[…]
The Steyer-funded study is not pay-walled and it’s a doozy!
Abstract
Estimates of climate change damage are central to the design of climate policies. Here, we develop a flexible architecture for computing damages that integrates climate science, econometric analyses, and process models. We use this approach to construct spatially explicit, probabilistic, and empirically derived estimates of economic damage in the United States from climate change. The combined value of market and nonmarket damage across analyzed sectors—agriculture, crime, coastal storms, energy, human mortality, and labor—increases quadratically in global mean temperature, costing roughly 1.2% of gross domestic product per +1°C on average. Importantly, risk is distributed unequally across locations, generating a large transfer of value northward and westward that increases economic inequality. By the late 21st century, the poorest third of counties are projected to experience damages between 2 and 20% of county income (90% chance) under business-as-usual emissions (Representative Concentration Pathway 8.5).
They literally did refer to RCP8.5 as “business-as-usual emissions.”
Based on a realistic climate sensitivity (TCR = 1.5 K per doubling) and the simple projection of UAH 6.0 to the end of this century, we get about 1.5 to 1.9 °C of total warming by the end of this century. According to Hsiang et al., 2017, that equates to about a 1% reduction in US GDP from 2080-2099, relative to what it would be without any additional warming…

How much would you spend today to avert a 1% loss 80 years from now? Dean Wormer has the answer:
This is how President Trump should handle the purveyors of this crap…
References
Hsiang, S. et al. Estimating economic damage from climate change in the United States. Science. 356 , 1362–1369 (2017).
Jay, A., D.R. Reidmiller, C.W. Avery, D. Barrie, B.J. DeAngelo, A. Dave, M. Dzaugis, M. Kolian, K.L.M. Lewis, K. Reeves, and D. Winner, 2018: Overview. In Impacts, Risks, and Adaptation in the United States: Fourth National Climate Assessment, Volume II [Reidmiller, D.R., C.W. Avery, D.R. Easterling, K.E. Kunkel, K.L.M. Lewis, T.K. Maycock, and B.C. Stewart (eds.)]. U.S. Global Change Research Program, Washington, DC, USA. doi: 10.7930/NCA4.2018.CH1
USGCRP, 2017: Climate Science Special Report: Fourth National Climate Assessment, Volume I[Wuebbles, D.J., D.W. Fahey, K.A. Hibbard, D.J. Dokken, B.C. Stewart, and T.K. Maycock (eds.)]. U.S. Global Change Research Program, Washington, DC, USA, 470 pp.
Climate models are running around 1.5 to 2 degrees too hot…
..climate scientists are using those same models..to extend straight lines… to predict future catastrophes
RCP 8.5 is bad disaster fiction.
I propose that we start using GACC temperature scale, G. I believe rather than using F or C, G scale will denote the real scare.
Freezing point of water in G will be at 100 and the boiling point will be 8100. Hence we can expect a warming of at least 60Gs but more likely 160Gs.
That will teach the skeptics
This is not a report from the “Trump” Administration.
Sarah Huckabee Sanders should make a strong statement regarding this stinky dead carp.
I don’t know if ‘The Donald’ could or should shut this foolishness down. Even if he wanted to, why do so?
The squawk from the cAGW cult would be like shock and awe — silence scientists (although most are not), freedom of speech being stomped, other similar stuff. Who wants that? Let them bloviate. Then poke them with a sharp stick.
Somewhere else I saw 15°F (correct notation is 15F°) rise in the next 80 years! Good grief!
Hypothetical projections are being treated as an unquestionable and certain future. Pseudo-science at it’s finest! Nobody knows what future conditions will be. Claiming otherwise is fortune telling.
These guys are more entertaining than those who calculate toxicity recommendations for EPA. Never mind that by 2088 our GDP would be far better able to afford mitigation (if any is needed). Further, no one can account for the fact that if warming continues as projected, we ingenious little 3rd chimpanzees will probably figure out novel ways to leverage that environmental condition into even higher level of GDP.
Is something missing ?
“[…]
3. It cherry-picks science on extreme weather and misrepresents timelines ( time lines ) and causality.
[…]
??
“Both human and natural factors influence Earth’s climate, but the long-term global warming trend observed over the past century can only be explained by the effect that human activities have had on the climate.”
Statements like this always burn my butt. So these brainwaves MUST also know exactly what caused every temperature excursion across the Holocene, when all these human meatbags were not present and CO2 was apparently not a problem?? How many times had the temperature risen in the Holocene, 50?
I was doing a little digging yesterday, trying to find out what the review process is for reports like the National Climate Assessment (or as I like to call it, the National Climate Assassination of Rationality), and I came upon this interesting bit of information:
http://www.cfact.org/2017/12/30/biased-national-academies-review-taints-national-climate-assessment/
“The National Academies of Science, Engineering and Medicine (NASEM) have peer reviewed Volume 1 of the latest National Climate Assessment and they are scheduled to review Volume II, which will be the main volume. The Volume I review committee contained no skeptics, just well known alarmists. This is a direct violation of OMB’s [US Office of Management and Budget] rules for peer review of federal scientific assessments. NASEM should either shape up or ship out.”
Given that the NASEM [National Academies of Science, Engineering and Medicine] peer review fails to meet the Bulletin [OMB Bulletin] requirements, it follows that the required peer review has not been done for Volume I. Moreover, unless there is a big change at the NASEM, their review of Volume II will likewise fail to comply with the OMB [US Office of Management and Budget] Bulletin.
I do not know whether any changes to the review process occurred for Volume II — I’m doubting it — I haven’t found information discussing this yet.
Can we generate a petition to demand that Steyer release his tax returns? I think that we would find that he falls under the famous Eisenhower warning in Ike’s 1961 Farewell Address at Dartmouth:
“The prospect of domination of the nation’s scholars by Federal employment, project allocation, and the power of money is ever present and is gravely to be regarded.
Yet in holding scientific discovery in respect, as we should, we must also be alert to the equal and opposite danger that public policy could itself become the captive of a scientific-technological elite.”
Hmm i like poker.
My bank was £200
then 196
then 190
then 183
then 176
then 192
then 218
then 208
then 201
then 222
then 217
then 200
It was a good game and the profit trend is looking good.
Reference period first 3 nights average bank was £195.33 = baseline session
2nd session of 3 i was trending down -£11.67 average bank £183.66
3rd session of 3 i was trending up £+13.67 average bank £209
4th session of 3 i was trending up £+17.67 average bank £213
Profit zero. but i’m trending a roll right.
Global mean average temperature of earths surfaces combined land sea and ice 14.4C 1850
14.9C 2017 El nino year.
Difference 0.5c higher. 2018 14.5C maybe 14.6C… 0.1/0.2C higher ?.
Because that is yer global warming .. the difference between the start and the end.
What is in the middle is meaningless.
Only what was, and what is now matters.
start £200 finish £200 warming zero.
David, once again a fun post. The ridicule is more deserved now than ever. Are these people part of the human race? There will be no coordinated participation in climate action other than the carnival barking of the left and opportunistic 3rd World governments clamoring for cash (they think the шнутеs have gone crazy and hey, why not cash in?).
The cost, if their urgent demands were to be taken seriously, would be far worse than 10% of GDP and everybody, the butcher the baker and candlestick maker know the expenditure would be to no effect. The jig is up and the elites are in D*nile, the real psychological kind. People already voted on it in the US and in a growing number of countries.
For those who have until recently been unsure about our climate impact, the contrary evidence they really understand has come in in a flood. No, not the ‘sciencey’ stuff, although it toppled about a decade ago. It is the angst and shrill entreaties of the cynical billionaire elites who don’t know aerosols from snip. ‘Follow the money’ subsumes it will be somewhat hidden, but with these guys its now all hanging out in a last ‘Sauve qui peut!’ on a pockmarked battlefield. Steyer’s Deplorables plaid shirt and blue jeans seem somehow sad.
“….Figure 2.1: Both human and natural factors influence Earth’s climate, but the long-term global warming trend observed over the past century can only be explained by the effect that human activities have had on the climate…”
So there was no natural recovery from Little Ice Age of the previous 400-500 years? Were CO2 levels rising from human fossil fuel use or other human actions from 1900 onward? No UHI effects in the 20th century? No temperature station siting issues involving NOAA guidelines?
I wish Trump would pull the plug on the financing of this garbage. As I have said in the recent past though, he is being reactionary and taking no offensive action against any of this. If I were in his shoes, the alarmists at the U.N. and around the world would be on the run and dealing with the entire body of refuting evidence presented for the whole world to see and consider.
The best defense is a good offense.
Reminds me of the Dilbert cartoon that proudly on display at work and at home.
“What if I don’t trust the economic models”
“Who hired the climate denier”
https://dilbert.com/strip/2017-05-14
David, those “simulation runs” are so good I’m utilizing them to substitute for my regular exercise. What a fracking great feeling sitting in front of the TV with chips and beer while “simulation runs” exercise for me. Meanwhile back in touch with Reality, I see several large areas of North America are off to the coldest start to winter ever recorded.
When a cause that is advanced by Progressives converges towards a socialitic solution far faster than it converges towards solving the issue they claim is urgent, then we can be at least 97% confident that we are dealing with ideology far more than we are dealing with honest science.
“But if your aunt calls you up this week spouting claims of mass deaths, global food shortages, economic destruction, and national security risks resulting from climate change,”
Especially if her name is Sally.
How does the atmospheric CO2 concentration of RCP2.6 compare to measured CO2 concentrations? I can’t find RCP2.6 CO2 concentrations vs. time in tabular form that would allow an accurate comparison with actual data. If actual CO2 concentration falls below projected levels and the resulting warming still matches projected warming, I would think the climatologists would be citing this as proof that “it’s worse than we thought”.
Perhaps this is why the data is presented on low resolution graphs.
Another observation I have is that the RCPs seem to run together until there is a divergence beginning somewhere between 2030 and 2040 (again based on low resolution graphs). So how can ANY conclusions be made about the accuracy or usefulness of the projections until that time period?
David
Thanks for the post. I looked at what you presented here and in your post back in April. Here are a few points. I read in another article that the NCA was not based on the solid red line. Rather, it is based on 15F instead. Below is a quote form the article I read:
“That study only found substantial damage to the U.S. economy under an extreme global warming scenario of 15 degrees Fahrenheit by 2100 — twice the United Nations’ worst-case scenario called RCP8.5.”
Your figure 2 shows how it could be 15F if you use the maximum of the shaded area. This is what I would call extreme squared. I used 15F as the basis for what I document here.
Perhaps, this comment is more directed at what you posted back in April, but I hope it adds something.
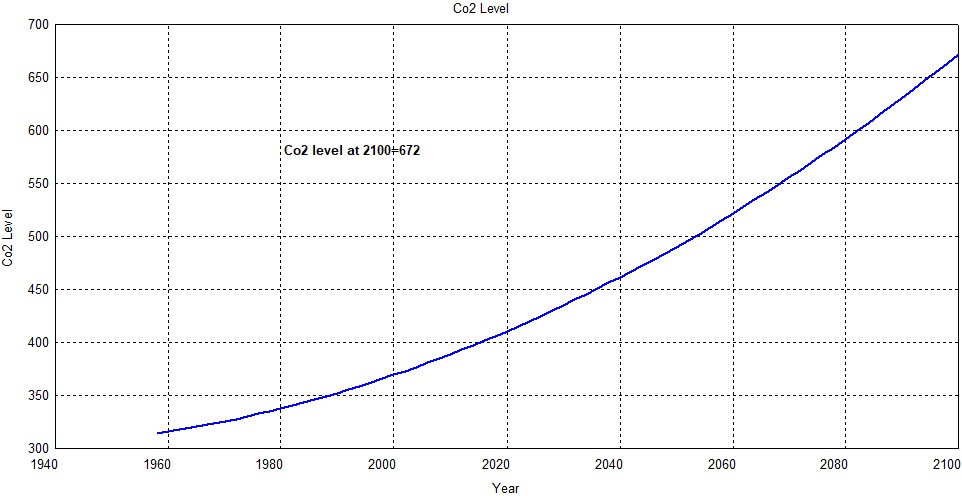
First, regarding CO2. As you can see in the figure below, I have a very precise fit to the Mauna Loa measurements.
Ignoring the yearly cycle, I get this rate of change until 2100.
Extending this out to 2100 I get this
.
I think in the April post you came up with 683 and I came up with 672. Not bad.
Now, onto 15F.
I wrote a little program for this evaluation. I can get to the final temperature of 15F two ways. I can find what ECS value gets me there or I can determine what the final value of CO2 must be with a given ECS value. That is what this little program does.
There you have it. If CO2 grows at its current pace as shown in the earlier figures the ECS value must increase to 8.56. If we use the worst-case IPCC value of 4.5 the final PPM value would have to be 1254. That is not too far from your value as I recall.
Now to illustrate just how foolish this report is I added a new line to my graphs in my cyclic analysis of UAH data. My cyclic analysis with a contribution from CO2 is a very good match to the measured data.
I performed a 5-year moving average of both the measured data and the cyclical data and essentially duplicated a familiar curve that included balloon data. You can see the lines are on top of one another. The figure also includes the Lewis and Curry estimate for ECS too. I added a new line for the NCA 15F estimate.
You will also find a line identified as rcp85. That is my digitation of the red line from your figure 2. You will see that the IPCC 4.5 line is a reasonable match for it. Make note of how well the Lewis and Curry value matches the data.
Now taken out to 2100 this is the result.
In my estimation, the people who wrote this report should be ashamed of themselves. It is truly extreme squared. It is fiction.
So the government climate weasels changed the BAU scenario for the science fiction scenario of RCP 8.5 and figured (correctly) that the climate concerned are too gullible to notice the difference.
And even then in their arrogance they managed to still over hype and make the outcome far worse than reality indicates.
Food shortages won’t be from warming, they’ll be from cooling. Warming increases the areas where we can grow food. And as the alarmist like to say that snow is caused by increased evaporation, it’s just as likely to rain than having droughts.
These “studies” all use the RCP8.5 projections because it’s the scariest. Despite all the chest-thumping about “government action” in the form of carbon taxes, wind and solar subsidies, prohibitions on fossil-fueled energy production and vehicles, especially by the most deluded of the progressive governments around the world, no one is actually doing anything substantial to “combat” so-called “climate change” so, in fact, the “do nothing” scenario is the most plausible as far as global action.
The irony, however, is that actual measured temperature trends so far barely reach to low end of the RCP2.6 scenarios; the balls-to-the-wall-damn-the-economy mitigation fantasies envisioned by the climatistas. Simply stated, the computer-generated Representative Concentration Pathway projections are spectacularly wrong.
US sceptics want to destroy theit country. EU leading the way: https://wp.me/p8BEgP-13a
… Sophisticated computer models of Earth’s climate system allow scientists to explore the effects of both natural and human factors …
=======================================================
Homicide detecting would be a lot easier if police could charge the first person they come across without an alibi.
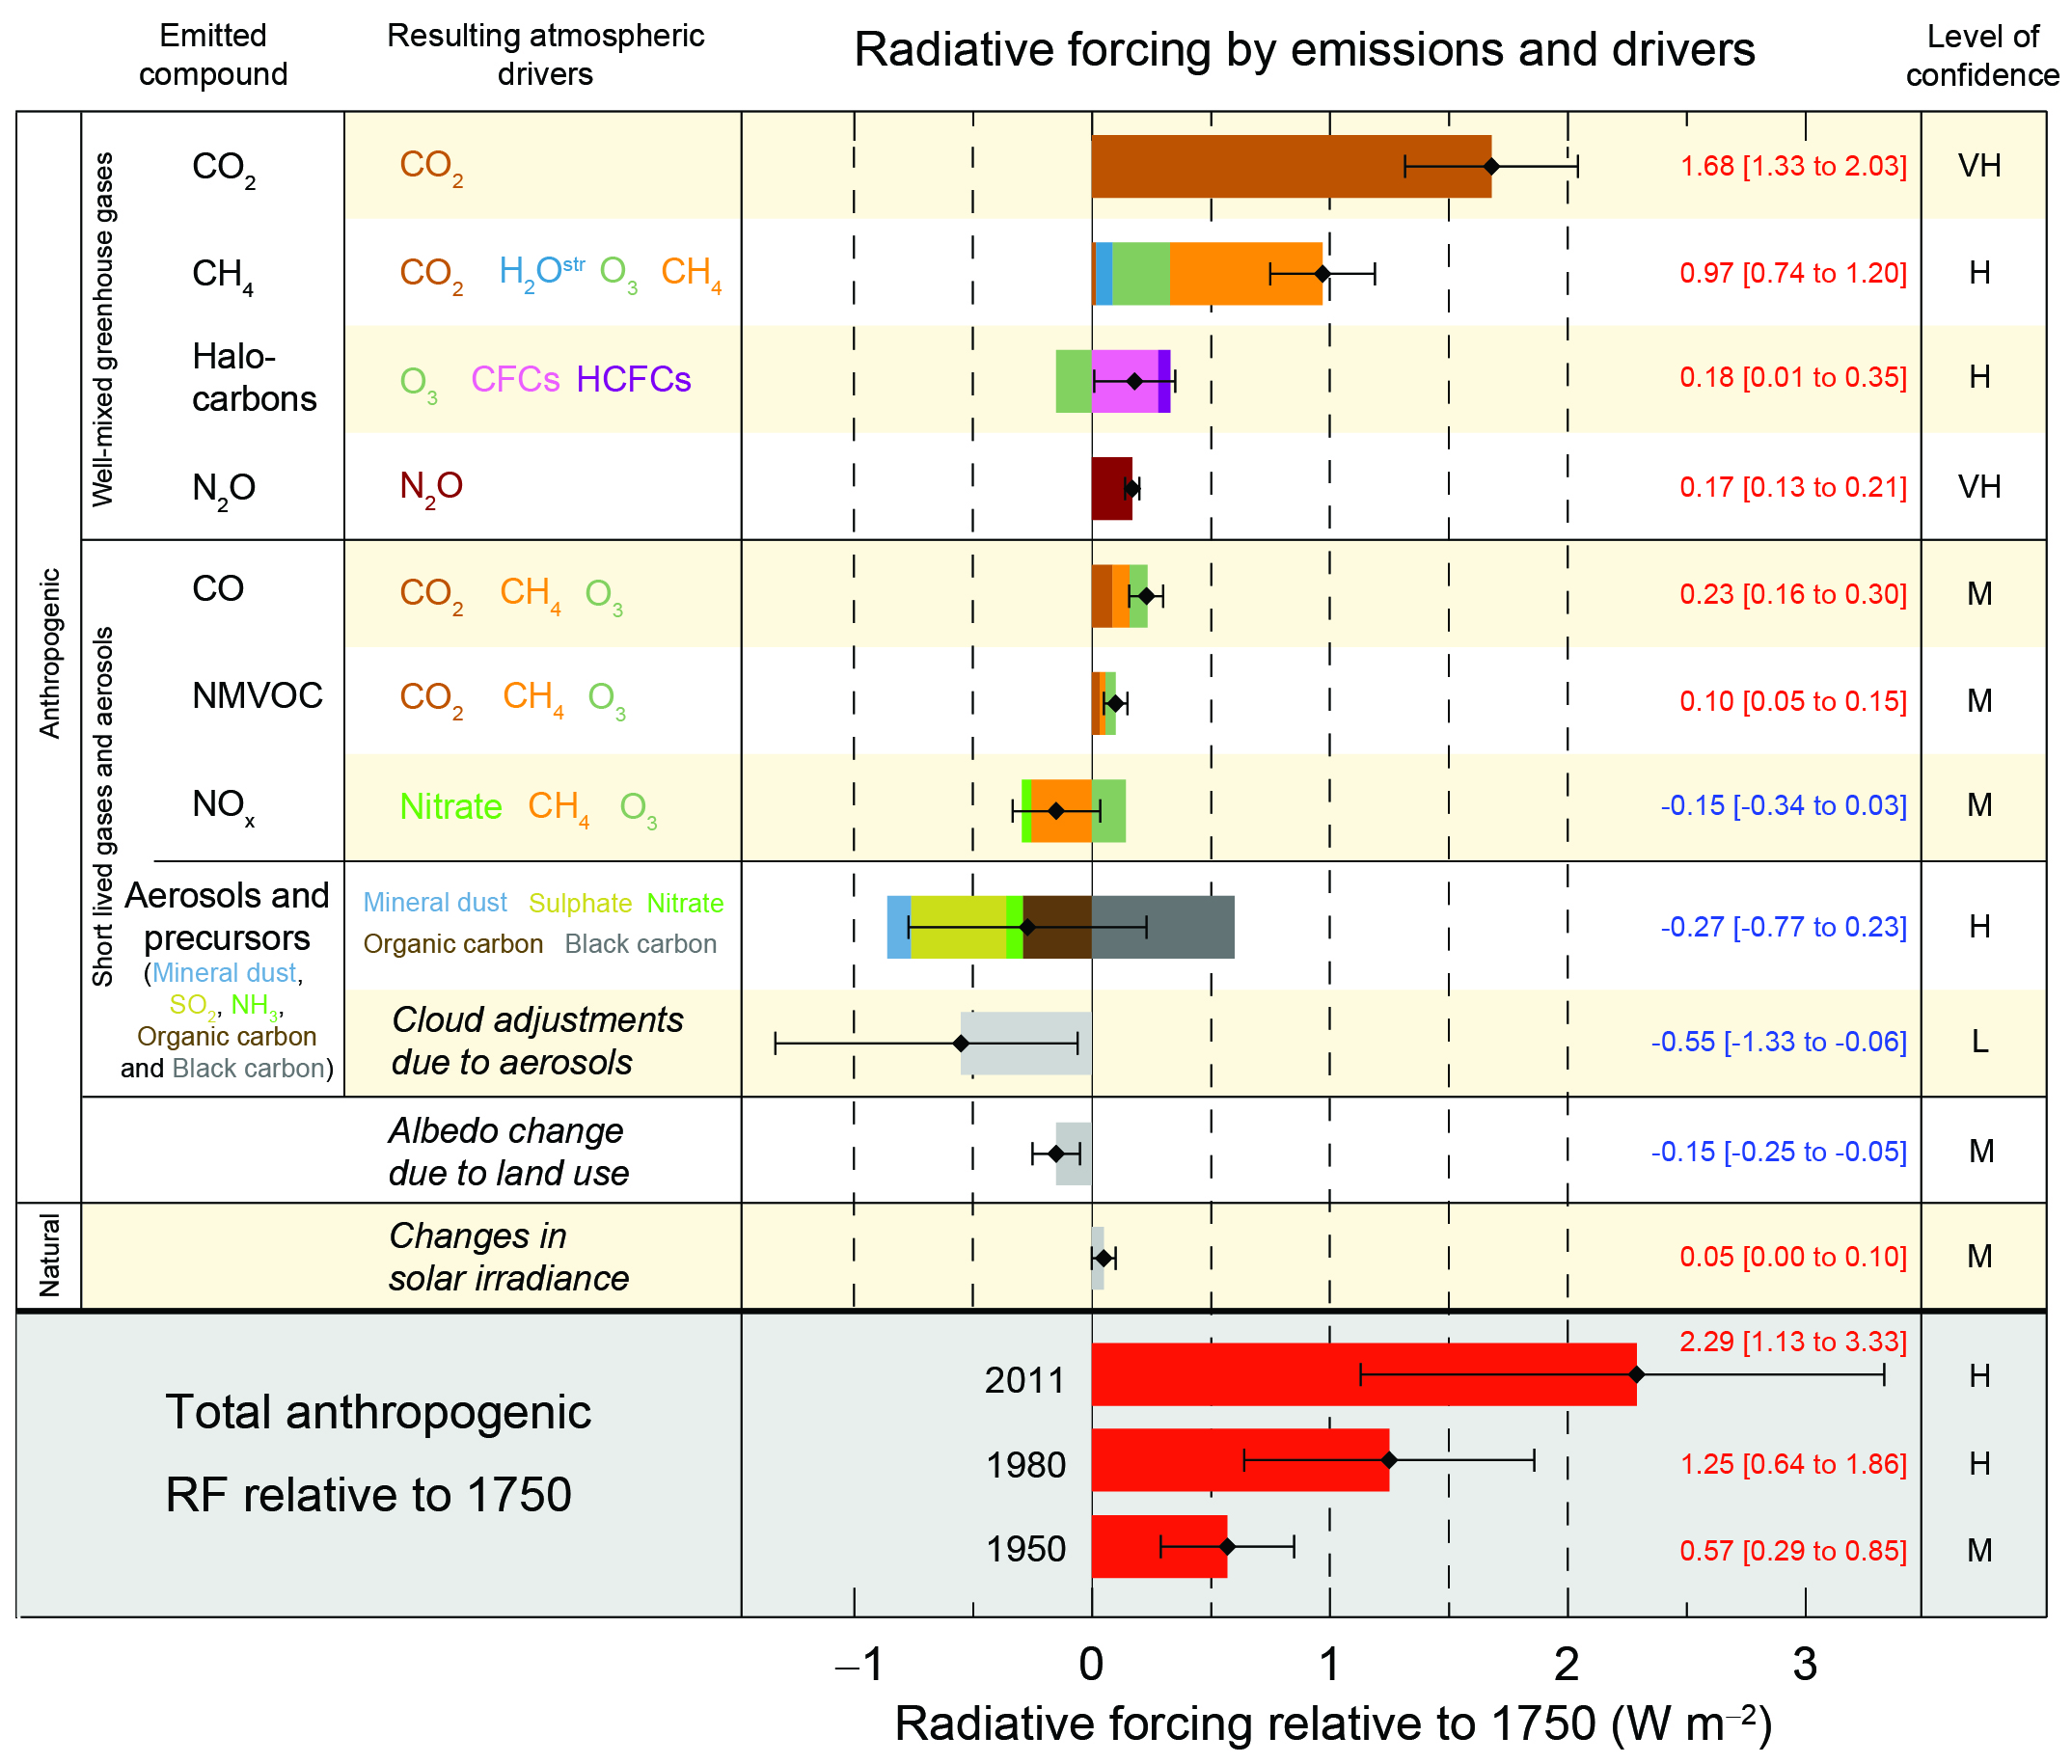
Fig 2.1 is derived from IPCC report AR5 that clearly states that the ‘drivers of climate change’ since 1750 were overwhelming anthropogenic:
That’s an assumption contained in the models there is nothing sophisticated about it; it’s purely a deductive process, if practically all climate drivers are anthropogenic then it follows that practically all observed changes will be due to anthropogenic:
http://www.cfact.org/2018/03/01/circular-reasoning-with-climate-models/
Hah! So you used a fossil-fuel-funded thermometer? No wonder your denialist assertions are false!
/sarc for the humour-deficient