ENSO-neutral conditions still reign as of the beginning of the month, but we’re starting to see some clearer signs of the development of El Niño.

Forecasters estimate that El Niño conditions will develop in the next few months, and there’s a 70-75% chance El Niño will be present through the winter. Most computer models are currently predicting a weak El Niño event.
Over the past several weeks, surface temperature anomalies (difference from the long-term average) have gradually increased across much of the tropical Pacific. All four of the Niño-monitoring-region temperatures are now above average.

Animation showing sea surface temperature departure from the long-term average from August through early October 2018. Graphic by climate.gov; data from NOAA’s Environmental Visualization Lab.
The temperature in the Niño3.4 region (our primary metric for monitoring El Niño’s development) was 0.7°C above the long-term average in the latest weekly measurement. Yep, that’s above the El Niño threshold of 0.5°C, but we’ll need the monthly temperature in the Nino3.4 region to average above that threshold, plus an expectation that it will stay above, and indications that the atmosphere is responding to the change in the ocean before we’d declare El Niño.

Summary of decision process in determining El Niño conditions. NOAA Climate.gov drawing by Glen Becker and Fiona Martin.
Regular ENSO Blog readers will know that we go on about the winds that blow across the tropical Pacific. At times, we probably get pretty windy about the wind! That’s because these winds are very important to the development and maintenance of El Niño and La Niña. ENSO—short for El Niño-Southern Oscillation—is a coupled system, meaning the ocean causes changes in the atmosphere and the atmosphere in turn affects the ocean.
The trade winds normally blow from east to west (“easterly” winds, in meteorological parlance) along the equator in the Pacific. They help bring colder water up from the depths of the ocean to the surface near South America and also pile up warmer waters in the far western Pacific, near Indonesia. When these winds slow down, the surface water can warm, and warmer waters from Indonesia begin to slosh eastward (a downwelling Kelvin wave). It takes a few months for the warm blob of water to travel across the Pacific, and when it reaches the coast of South America, the blob can rise to the surface, providing a months-long source of warmer water to the surface.
The reason I’m rattling on about this effect of the winds is that we’ve recently had a pretty substantial slowing down of the trade winds in the central and eastern Pacific—one of the strongest such episodes during September/October since 1979, when our real-time reanalysis data records begin.

Wind anomalies (departure from the long-term average) during early October, 2018. Shading shows the strength of the anomaly; arrows indicate the direction of the anomaly.
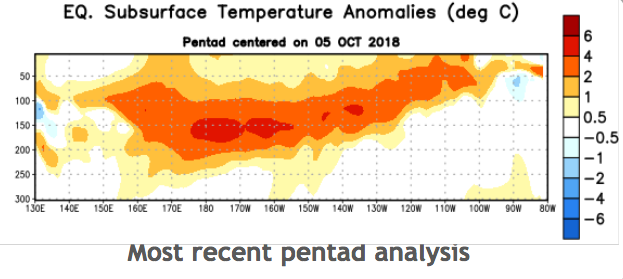
This slowdown in the winds has already allowed the surface to warm, and will help to reinforce the warmer subsurface waters that have been developing since August. The temperature anomaly in the upper ~1000 feet of the central-eastern Pacific, elevated since the spring, has increased over the past month.

Area-averaged upper-ocean heat content anomaly (°C) in the equatorial Pacific (5°N-5°S, 180º-100ºW). The heat content anomaly is computed as the departure from the 1981-2010 base period pentad (5-day) means. Climate.gov figure from CPC data.
The development of El Niño in the late fall isn’t unusual, with nine El Niño events since 1950 starting in August–October or later in the fall. Of these, only one (1986-87) had a peak Niño3.4 Index greater than 1.0 degree; all the others were weaker events. Since El Niño events peak in November or December, there probably isn’t enough time for sea surface temperature anomalies to grow very large.
The strength of El Niño doesn’t necessarily indicate the strength of its impacts on global weather. But a stronger El Niño can increase the likelihood that impacts of some kind will happen. The Climate Prediction Center’s winter outlook will be released next Thursday (October 18th), so stay tuned to see what effect El Niño may have on U.S. winter weather. We’ll also have a post here at the ENSO Blog on that outlook.
Source: climate.gov
EL NIÑO/SOUTHERN OSCILLATION (ENSO)
DIAGNOSTIC DISCUSSION
issued by
CLIMATE PREDICTION CENTER/NCEP/NWS
and the International Research Institute for Climate and Society
11 October 2018
ENSO Alert System Status: El Niño Watch
Synopsis: El Niño is favored to form in the next couple of months and continue through the Northern Hemisphere winter 2018-19 (70-75% chance).
ENSO-neutral continued during September, but with increasingly more widespread regions of above-average sea surface temperatures (SSTs) across the equatorial Pacific Ocean [Fig. 1]. Over the last month, all four Niño index values increased, with the latest weekly values in each region near +0.7°C [Fig. 2]. Positive subsurface temperature anomalies (averaged across 180°-100°W) also increased during the last month [Fig. 3], due to the expansion and strengthening of above-average temperatures at depth across the equatorial Pacific [Fig. 4]. Convection was increasingly suppressed over Indonesia and around the Date Line [Fig. 5]. Low-level westerly wind anomalies were evident over the western and east-central Pacific, with some of the strongest anomalies occurring over the eastern Pacific during the past week. Upper-level wind anomalies were easterly over the east-central Pacific. Overall, the oceanic and atmospheric conditions reflected ENSO-neutral, but with recent trends indicative of a developing El Niño.
![[Fig. 1]](http://www.cpc.ncep.noaa.gov/products/analysis_monitoring/enso_disc_oct2018/figure01.gif)
![[Fig. 2]](http://www.cpc.ncep.noaa.gov/products/analysis_monitoring/enso_disc_oct2018/figure02.gif)
![[Fig. 3]](http://www.cpc.ncep.noaa.gov/products/analysis_monitoring/enso_disc_oct2018/figure03.gif)
![[Fig. 4]](http://www.cpc.ncep.noaa.gov/products/analysis_monitoring/enso_disc_oct2018/figure04.gif)
![[Fig. 5]](http://www.cpc.ncep.noaa.gov/products/analysis_monitoring/enso_disc_oct2018/figure05.gif)
The majority of models in the IRI/CPC plume predict El Niño to form during the fall and continue through the winter [Fig. 6]. The official forecast favors the formation of a weak El Niño, consistent with the recent strengthening of westerly wind anomalies and positive temperature trends in the surface and subsurface ocean. In summary, El Niño is favored to form in the next couple of months and continue through the Northern Hemisphere winter 2018-19 (70-75% chance; click CPC/IRI consensus forecast for the chance of each outcome for each 3-month period).
![[Fig. 6]](http://www.cpc.ncep.noaa.gov/products/analysis_monitoring/enso_disc_oct2018/figure06.gif)
This discussion is a consolidated effort of the National Oceanic and Atmospheric Administration (NOAA), NOAA’s National Weather Service, and their funded institutions. Oceanic and atmospheric conditions are updated weekly on the Climate Prediction Center web site (El Niño/La Niña Current Conditions and Expert Discussions). Forecasts are also updated monthly in the Forecast Forum of CPCs Climate Diagnostics Bulletin. Additional perspectives and analysis are also available in an ENSO blog. The next ENSO Diagnostics Discussion is scheduled for 11 October 2018.
Source: CPC/NCEP
The wind does not react to changes in surface temperature for the time being.

High pressure on Tahiti.
https://www.longpaddock.qld.gov.au/soi/
I doubt how accurate all this description of ENSO processes are.
A Kelvin wave is , by definition, a surface phenomenon. The whole idea of a downwelling Kelvin wave is an oxymoron.
Also, when the cited authority insists on using terminology like “sloshing eastwards” I do not think they have a proper technical understanding of the physical mechanisms at play.
Oh no, who writes this stuff?
It is not a “blob” of warm water physically moving east, it is an ANOMALY. The reason that there is a red “blob” on the equatorial section map is that the SURFACE Kelvin wave is pushing the thermocline a little lower, thus pushing warm mixed layer into where the cooler water usually sits. This makes it “anomalously” warm.
When this surface wave reaches central America , it can partly continue northwards up the coast ( still a Kelvin wave), disperse or be reflected as a Rosby wave. In any case the deflection of the thermocline will end and there will be no more “anomalously” warm subsurface “blob”. That does NOT mean the red blob pops up to the surface, it just means that there is not more “anomalous” depression of warmer water below where it usually is, on average.
Climatologists should spend more time studying physics and less time worrying about “communication” and “media outreach” aka politics.
It stupid, it burns bright, white hot in you Greg.
you probably don’t believe in the thermo-haline circulation in the oceans rhen either.
Fortunately science isn’t about belief..
Your capacity for disingenuous and insulting replies to hide you own ignorance is only surpassed by your arrogant self-confidence.
You have so far failed to quote anything I actually said and prove it is wrong. Preferring to rephrase , reinterpret and attempt to divert the conversation to another subject.
About time to put up or shut. Or better still apologize.
The key to what is happening is the wind field stress across the equatorial Pacific.
Slides from this week’s NOAA/CPC ENSO discussion briefing.
– Since mid-July, westerly wind anomalies have become more prevalent over the equatorial Pacific Ocean.
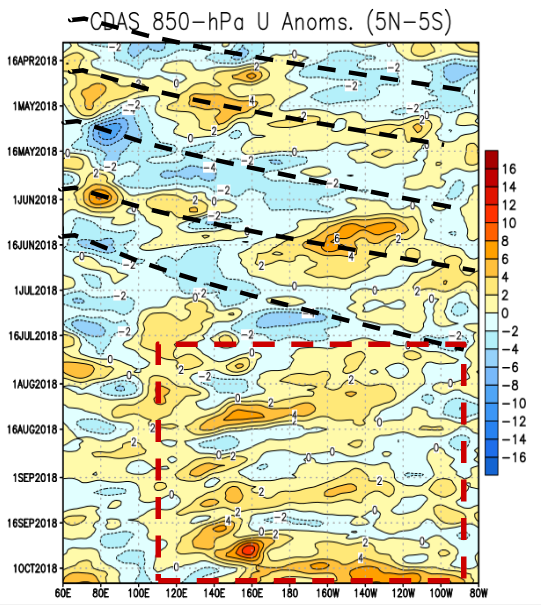
– In the last week, strong westerly wind anomalies occurred over the eastern Pacific Ocean.
Westerly Wind Anomalies (orange/red shading)
Easterly Wind Anomalies (blue shading)
Because of the sustained Westerlies wind stress:
An eastward propagating, sub-surface warm phase Kelvin Wave will begin its surface emergence around Christmas – The El Nino.
Forecasters have seen this warm subsurface wave building for almost 2 months now.
Joel, I suggest you read my comments above.
The “Westerly Wind Anomalies” are still easterly winds. The “Westerly Wind Anomalies” there is a bit like ocean acidification in water of pH7.7
There is no “sub-surface warm phase Kelvin Wave ” because there is no such thing. A Kelvin wave is a surface effect, by definition. The red “blob” is an anomaly caused by vertical displacement of water , not eastward moving wave of warm water. So it can not “surface at Christmas.
What arrives at Christmas is the warm surface water of the surface Kelvin wave.
“Because of the sustained Westerlies wind stress:”
How do you propose to have a Westerlies wind stress, actual winds are still easterly or near zero. No westerlies.
Understand the difference between anomaly and temperature:
http://www.cpc.ncep.noaa.gov/products/analysis_monitoring/ocean/weeklyenso_clim_81-10/wkteq_xz.gif
Greg Goodman,
You really should not comment if you do not know what you are talking about on technical matters.
Your ignorance is showing quite badly.
If you have a specific point to make , state it. Insults don’t count.
Your comment about waves being only surface features is so stunningly ignorant that it’s not worth rebutting.
Greg is right about the winds you know. There is less easterly winds, not westerly.
There is a reason it took more than 50 years to figure out how to sail east across the Pacific. Because it is impossible to do it near the equator.
Joel , your comment about the nature of Kelvin waves is so stunning ignorant , it is not worth rebutting.
I see you are already trying to walk it back by rephrasing what I said and trying create yourself some wiggle room.
You should stop posting about technical things you do not understand. You ignorance it very obvious.
I’m not walking back anything. Your comments reflect a general ignorance of the physical processes that underpin the movement of initial downwelling of very warm high salinity water eastward at several hundred meters below the surface before upwelling again in the east. They are called waves, becauses they have a cyle and phase. And it is the wind field stress of the surface that has a major controlling influence on that cycle, called Kelvin waves.
That you seem to think that waves are solely surface features and that westerly wind events don’t occur out there, you are beyond help.
Your attempts at technical comment Greg are why government scientists like Arctic alarmist Mark Serreze, director of NSIDC, are able to dismiss WUWT comments as coming from stunning ignorance.
“I’m not walking back anything.” Yes you are. You are paraphrasing and reinterpreting what I actually said and then arguing against what your said I said. That’s called a straw man argument. You do that because you can not back up your claims of ignorance based on what I DID say.
” … a general ignorance of the physical processes that underpin the movement of initial downwelling of very warm high salinity water “…. “They are called waves, because they have a cyle and phase. ”
My comments were very specifically about Kelvin waves not some hand-waving “cyle and phase”.
My main point is that Kelvin waves are , by definition, a surface phenomenon and so-called “downwelling” Kelvin waves are an oxymoron. If you wish argue against that, go ahead. You may find it helpful to learn what a Kelvin wave is before replying.
If you think there are currently any westerlies causing wind stress , please feel free to point out where they are occurring.
.
True ignorance of the physical processes that underpin the development of El Ninos is manifest in the notion that there’s a “movement of initial downwelling of very warm high salinity water eastward at several hundred meters below the surface before upwelling again in the east.”
There’s no so such downwelling in the WestPac warm pool, nor any associated upwelling of water masses in the east! Kelvin waves are long-period surface gravity waves that transport mechanical energy–not water. Their effect upon the subsurface thermocline depth gives rise to the entirely contextual description of “upwelling” and “downwelling.”
El Nino conditions are produced by actual wind- and gravity-driven transport of warm water from west to east, not by concomitant Kelvin waves.
heart sunk when i saw the enso meter swing to the +side;-( and yet aus is actually getting rains inland and in droughted spots all over
not masses for most but any is a blessing.
meanwhile i read this and followed the links in the item
poor usa farmers really taking a hell of a year;-(
https://www.iceagenow.info/harvesting-wheat-in-the-snow
And yet, the snowy ND harvest hasn’t supported durum prices:
http://northernag.net/Markets/GrainMarkets.aspx
Today:
Wheat / Durum / Barley Cash Prices
Soft White Wheat Hard Amber Durum Feed Barley
Steady
Fri AM Steady
Thur PM Steady
Thur PM
South Central MT
Golden Triangle 450 675 – 700
Northeast MT
430 – 450
FOB Portland 600 – 618
WeatherBell has a cold snowy winter in the east and southeaster U.S. They sound quite confident. I just moved to south Florida to get away from harsh New England winters, but we’re likely in for cool and stormy weather down here through the winter months. Likely a bunch of cold fronts sweeping down from Canada as well. I have one word for this el nino: yuck
The skunk cabbage agrees. So, WeatheBell must be right. You can usually tell how much snow you’re going to get by how tall the cabbage is at the end of Summer. And, this year, at least around here in West Virginia it looks like we’re due for 3 or 4 feet. :<)
Skunk cabbage does well in cool wet summers and early fall.
If the summer is cool and wet, odds favor the following winter months will be cold and snowy.
Or you are free to believe in spooky mystical properties of skunk cabbage.
Big Joe B. at WeatherBELL has been forecasting a Modoki El Nino for this winter for some time now .
Some people dissed him …..but he who laughs last ….
Family in S. Florida share your sentiments ….
Joe is usually correct, this one is different though according to him and he is saying bad winter for SE USA
Sorry but I’m from New England and lived in SFLa for last 3yrs miserable heat and humidity for for 6.5 months+ then warm humid with just scattered comfortable days. Escaping the snow from from beautiful NE is one thing…but SFla is is a steam bath. Had to Run AC almost entire year.living with Windows closed for 90%+ of year sucks. I’m welcome anything El nino can bring this winter for a true change of season and break from summer. I came to Florida to help elderly parents not because I love humidity and heat. Now I only wish EL Nino cool the summers Off here they are beyond Hot and humid relentless humidity .. constant Dewpoints in 70s sometimes around 80. Sorry too much heat can be another nightmare opposite harsh winter. One you can dress for..the other you can only take so much off in clothing!
Maybe this has been covered before, but do we know what drives the ENSO cycle?
CO2 control knob of course.. Just think, back in the benighted old days we laughably thought the climate system was complicated.
No idea Another Paul; but suspect subduction activity around the Philippine area etc. may have something to do with it. Volcanic activity as a overall may appear small; but when it is concentrated in an area it can have significant impact.
Thanks Alasdair, I could see concentrated volcanic activity having impacts, but how would the suspected subduction activity drive a wind change cycle?
No. Its covered in the article.
Thanks Gary, but I don’t see where it is covered. It does explain the indications and effects, but not what actually drives the cycle. “The trade winds normally blow…When these winds slow down…”.
Hi AP. A high percentage of the suns heat impinges on the equatorial strip heating that surface water. 1) During La Nina, the trade winds blowing strongly westerly push this warm water with it and cooler water upwells in the eastern eq. Pacific exposing it to intense heating and it is also conveyed to the west. 2) this hot water literally piles up in the Western Warm Pool around Indonesia and produces a submerged warm volume which begins to move eastward, counter to surface flow where it eventually gets caught up in the eastern Pacific upwelling 3) Then Westerlies begin to slacken and some of the surface warm water from the west spreads easterly and the upwelling (now warm water) in the eastern Pacific slows and stops with the equatorial strip now covered on the surface with very warm water of an El Nino. The return of strong westerlies re-initiates La Nina. It is often visualized as a pumping action.
Thanks Gary, I’ve read that and sort of understand it. This is the part that I was asking about: “Then Westerlies begin to slacken…” ENSO seems to have a cycle to it, I was wondering if we had an idea of what might control the switch and/or the period?
Gary, you mixed up your easterly and westerly (easy to do).
Winds are named by the direction them come from.
Currents by the direction they are headed to.
*-ly for wind, name of direction of origin.
*-ward for water current , name direction of destination.
Thanks aaron, you are correct
It drives itself, chaotically
https://journals.ametsoc.org/doi/pdf/10.1175/1520-0493%281987%29115%3C2262%3AAMENO%3E2.0.CO%3B2
but with phase-locking to end of year, the southern hemisphere summer
https://journals.ametsoc.org/doi/pdf/10.1175/1520-0442%281998%29011%3C2191%3ALOENOS%3E2.0.CO%3B2
Sorry, but whenever I see the words “chaotic” or “random” applied to weather or climate phenomena, that just sounds like BS to me. These are chickenshit words they use when they JUST DON’T KNOW what causes something. A complete cop-out. There are driving forces behind everything. We may not have identified what all those forces are or how they cause the phenomena we observe, but that doesn’t mean what we observe is “chaotic” or “random.” It just means we don’t know the cause. Seems “scientists” just hate to acknowledge how limited their knowledge is.
Say “non-deterministic” or perhaps “fractional gaussian” then if it makes you more happy.
Sometimes the system is so complex that it is chaotic. Weather (El Nino/La Nina included) appears to be one of these systems. We are getting proficient at predicting where a large weather system will go once it has formed, and we can tell that conditions are ripe for a thunderstorm to form, but not where. The theoretical work on weather points to chaotic behavior even if adequate starting information were to be available. Philosophically, I don’t like chaotic behavior – I like good old cause and effect. However, reality doesn’t care about my opinion.
“Chaos theory is a branch of mathematics focusing on the behavior of dynamical systems that are highly sensitive to initial conditions. ‘Chaos’ is an interdisciplinary theory stating that within the apparent randomness of chaotic complex systems, there are underlying patterns, constant feedback loops, repetition, self-similarity, fractals, self-organization, and reliance on programming at the initial point known as sensitive dependence on initial conditions. The butterfly effect describes how a small change in one state of a deterministic nonlinear system can result in large differences in a later state, e.g. a butterfly flapping its wings in China can cause a hurricane in Texas.” https://geoffboeing.com/2015/03/chaos-theory-logistic-map/
AGW, you may be misunderstanding the technical meaning of ‘chaotic’. It is not the common language meaning. Convection currents and turbulent flow because we do not have solutions to the equations which describe them. That does not mean a cop out or having no knowledge of what is causing them.
We understand what causes convection, but the “chaotic” bit is where each individual, local movement will happen.
You are right about scientists often being unwilling to admit ignorance, or the limits of understanding.
Chaotic and nonlinear systems are a well understood and defined category of dynamical systems.
It does NOT mean “just all over the place and we don’t understand it”.
As Greg Goodman says the colloquial use of the word “chaotic” is very different from the scientific use. It’s not hard to understand. Just 15 minutes reading from Google would give you the essentials.
Climate scientists and bloggers alike waste 100% of the time they spend in tragic-comical attempts to understand climate if they do NOT realise from the very start that it is a chaotic-nonlinear phenomenon. Think this is just me? The gist of Richard Lindzen’s recent climate lecture was just the same – climate is a chaotic/nonlinear system of two turbulent fluids – air and water.
Another Paul:
I have done a detailed examination of average anomalous global temperatures, 1850-2014, and have found that all ENSO “La Ninas” and “El Ninos” are caused by varying amounts of dimming SO2 aerosols in the atmosphere, of either volcanic or anthropogenic origin.
When there are fewer, ENSO warms up, and when there are more, ENSO cools down.
Thanks Burl “…varying amounts of dimming SO2 aerosols” If I understand what you’re saying here, it’s the aerosols that modulate the intensity of ENSO? Or do you mean the aerosols change the wind patterns?
Another Paul:
The aerosols modulate the intensity of the sun’s rays striking the Earth’s surface, so that fewer aerosols will result in increased surface warming, and the eventual formation of an El Nino (unless quenched by more SO2 aerosols from a volcanic eruption, or increased anthropogenic aerosol emissions).
Another Paul:
I should also have mentioned that about half of the El Ninos since 1850 have been volcanic-induced El Ninos. They are caused by the rain of volcanic SO2 aerosol emissions (small droplets of Sulfuric Acid) settling out of the stratosphere, and flushing out quantities of anthropogenic SO2 aerosols in the troposphere, on their way to the Earth’s surface.
With fewer dimming tropospheric aerosols present, temperatures can exceed pre-eruption levels because of the cleansed air, typically about 2 years after the date of an eruption.
Hi Burl. Interesting claim.
I have suggested that the late 20th c. warming was due to that kind of process of stratospheric cleansing.
Do you have any details on your work to back up these claims.
AP: google ‘Bob Tisdale enso”or search this blog. He cracked this nut just a few years ago, on WUWT. Actual initiation might come from lunar tides shifting north of the equator every few years. But the amount of piled-up warmer water determines how strong-weak-just a fizzler it is. ‘Quiet Sun’ phenomenom has reduced hotwater-buildup of recent years, so we have had a couple of fizzers, modokis or middle-Pacific warmups that did not sustain to full Nino status of late. A sign of oceanic cooling dreaded by Warmistas…..
#define recent ?
The sun and tidal currents drive it. The biggest el ninos happen about once every 18 to 20 years. My understanding is that the moon has a 18 year orbital cycle that matches up well with the observed large El Ninos. The sun is also the primary heater of water (not CO2) .
El Nino and a colder sun. Mixed results?
El Niño and ridge over Alaska?


Even better to observe in the autumn-spring period the circulation in the lower stratosphere.
https://earth.nullschool.net/#2018/10/12/1500Z/wind/isobaric/70hPa/orthographic=-97.54,38.94,448
El Nino, come!

A Less magnetically active sun.
Solar surface temps haven’t changed much for the last billion years except go up a little.
http://www.bom.gov.au/archive/oceanography/ocean_anals/IDYOC007/IDYOC007.201810.gif
Can El Ninos be conceptualized as releasing heat stored (hidden?) in the oceans, from some time in the past, eventually into space?
More like a slow down in heat circulated into the tropical Pacific. The equatorial current slows down, heating the surface waters, and instead of being circulated down under the surface of the west Pacific that heat is released back into the atmosphere.
The trade winds definitely slowed down in the last two weeks and heat is building. The only question now is how big will this one be and will we finally see a strong La Nina afterwards.
El Nino likely?
Not so much.
The anchovies don’t agree – the Peruvian anchovy fishery is abundant so lots of upwelling.
https://www.undercurrentnews.com/2018/10/12/fishmeal-industry-optimistic-on-upcoming-peruvian-anchovy-season
With all that upwelling, and with robust trades, there is no chance that there will be a true el Nino engaging the Bjerknes feedback.
There is a “mini-el Nino” every Christmas simply due to the southern hemisphere summer.
This will be just one of those.
The Warmists will use it fraudulently to rattle the can for their cause.
As always, hot air about nothing.
Invest in anchovies!
I still think El Nino may not happen and it does it is going to be very weak.
That aside what I am much more concerned about as far as the climate situation and cooling is this recent rapid rise in overall oceanic sea surface temperatures which I am surprised about and can not explain.
With weak solar which is translating to weaker UV light and most likely an increase in global cloud coverage I see this rise in overall oceanic sea surface temperatures as a blip.
Overall oceanic sea surface temperatures now +.40 c above 1981-2010 means up from around +.15 c a month or so ago.
If this trend does not reverse then the global cooling that was going on is not going to continue.
The problem for my theory is the threshold issue. In other words I am POSITIVE that less UV light and an increase in galactic cosmic rays (more global cloud coverage) will lead to colder overall oceanic sea surface temperatures . No doubt. The issue is what are the levels and duration needed in UV light ,galactic cosmic rays to have this happen? I do not know that answer although I think solar readings around typical solar minimums if duration is long enough would l be sufficient.
Then the other consideration is the weakening and orientation of the geo magnetic field which will also contribute to the climatic situation but again what are the threshold levels of change needed to make it’s effects more apparent? Again I do not know the answer.
This is why if solar/ geo magnetic fields keep weakening and or stay weak for an extended period of time the answer may be known if the climate responds. It looked like this was happening until this recent sudden rise in global overall oceanic sea surface temperatures. It is surprising but again I think now-next few years is going to tell the story and I still expect colder despite this temporary stall.
Currently, there is a lot of sun exposure on the surface of the ocean.

“ recent rapid rise in overall oceanic sea surface temperatures ”
More likely the back room boys have tweaked the SST baselines again, like they did just before the OMG Pacific warming in 2016.
The back room boys will do what it takes to keep the global warming show on the road.
Reading the weather data on NOAA, BOM etc is like reading Mein Kampf.
Although I’m skeptical of your theories on that, last night for the first time at this location I experienced thunderstorms, and they were not driven by ground level thermal excess in the late afternoon. They occurred all night and the ground level remained cool.
In the 1970s such Spring storms always appeared in the first and second weeks of November, they were very predictable. In Australia we have this little horse race called the Melbourne Cup, and it always occurs on the first Tuesday in November, every year. And during the 1970s we ALWAYS got our Spring first Spring storm on that day. It was extraordinary and highly noticeable in the 1970s.
But in the 1980s the ‘Spring’ storms moved on to mid to late December and became ‘Summer storms’, which was equally bizarre and noticeable as they just did not occur in November any longer, at all.
Then in the 1990s and 2000s the thunderstorms progressively moved later into summer and occurred only in Jan and then Feb, and no earlier, then they even slid into March and occasionally into April, but no earlier any longer, and those thunderstorms were always associated with strong convection cells forming from pronounced lower level heating and moisture.
I’d many times wondered what was causing that clear change in thunderstorm occurrence in the seasons, so last night, when we got vigorous thunder storms at 9 PM on the 12th of October, I was stunned by this. This has not occurred before in the second week of October, from my experience. Plus the air was cool! It was a little humid, but about normal for mid-Spring. This occurred three weeks before the 1970s-era ‘Spring storms’ timings, and the storms are continuing all day today. There is thunder and storm cells blowing through as I write.
So what has caused these very unexpected earlier than ever before Spring thunderstorms? I’m at ~19 deg south and this sort of thing, cool weather spring storms usually occur well south of us, near to 25 deg south. And down there, they have been getting very severe thunderstorms for the past couple of days, which are continuing.
I looked at models and observations and nothing much stands out, which could trigger these severe cells in a fairly cool lower atmosphere, at night. No serious frontal action or trough. No serious warm deep humid inflow. No obvious cool-pool to destabilize things and trigger CBs.
So I started to think a bit wider.
What if, the a fall in solar activity and a lower kinetic energy and resulting compaction of the upper atmosphere was increasing the gradients in the troposphere, requiring lower thresholds to kick-off such storms, and to do so earlier?
What if a progressive thermalization and expansion of the upper atmosphere, over decades, produced a gradual relaxation of those gradients and that’s what has driven the regular 1970s ‘Spring’ thunder storms late into Summer, instead?
And if so does that mean a more active cyclone period is coming, like the much more active 1960s, 1970s and early 1980s, in the Coral Sea?
So no real clues. Just some thin speculations. But something to consider, if a WX change trend is real and continues to express from here.
In which case, there would be a solar change to WX cycle, which could have implications for climate cycles, on that scale of things.
Just thought I’d mention this, in case anyone else is noticing similar things, or if anyone has a means to quantify such a difference in observed gradients in a compacted atmosphere that could result in lower thresholds to seasonal thunderstorms and their timing.
Disclaimer: I could be totally barking up the wrong tree here, I’m not taking it too seriously.
I suspect a major cause of the warm portion of the ENSO pump is a natural weakening of Antarctic salinity-based cold currents. Cold bottom currents are caused when sea ice forms at the surface in the portions of the Southern Ocean closest to the Antarctic continent, which thereby dumps salt into the cold water, making it more dense and causing it to sink. More sea ice generally means more sinking cold water and a stronger push of those cold bottom currents. Less sea ice formation generally means a weaker push driving the cold bottom currents.
One major cold current flow goes up the western coast of S. America. The very area famous for the naming of the El Nino phenomenon is a productive fishing ground off the coast of Peru that is productive precisely due to up-welling of that cold current . So when the up-welling weakens, surface waters in the Eastern Pacific warm, for a couple of reasons. First, they get less direct cold water infusion (less cooling) from below. Second, the surface currents flowing west across the Pacific get less of a mechanical push. Third, as surface currents slow, combined with less cooling water mixing in, prevailing winds weaken, which allows sunlight heated water to remain in place for long periods, warming the pool of water even further. Fourth, already warm tropical waters slosh from the Western Pacific due to relatively stronger centripetal effects, made stronger due to the loss of trade winds. Which warms the water even further.
Variability in sea ice formation and salt concentration around Antarctica (may) drive the ENSO oscillation. Weakening trade winds and centripetal warm water sloshing are positive feedback mechanisms. The negative feedback that ends the warm part of the cycle is the loss of push of warm surface currents, ergo less southern flow of warm water to Antarctica, which allows for more sea ice formation, and the return of stronger salinity based sinking and a rebuilding of the cold current strength.
It’s just a hypothesis. I have no proof. Of course, if this hypothesis is correct, there should be a strong inverse correlation between Antarctic sea ice volume/extent and the presence of an El Nino. And too, the ice formation and ice extent is only a proxy. The real driver is the amount of salt dumped into surface waters when that water freezes. In areas of melting of ice shelf ice or glacial calving events, which involve much fresh water ice, devoid of salt, can freeze readily, but since it contains little or no salt, that ice formation would have little or no effect. You have to have salt water freezing.
The 2016 year wherein Antarctic sea ice extent hit a 40-year low, and a strong El Nino developed is one data point testing this hypothesis.
Nino34 after faltering recently returned to tracking 2006:
High sun exposure from fewer clouds under low TSI low evaporation today:
The east wind is clearly in the Western Pacific. The jetstream from the north operates in the Eastern Pacific.
http://tropic.ssec.wisc.edu/real-time/mtpw2/product.php?color_type=tpw_nrl_colors&prod=wpac×pan=24hrs&anim=html5
http://tropic.ssec.wisc.edu/real-time/mtpw2/product.php?color_type=tpw_nrl_colors&prod=epac×pan=24hrs&anim=html5
Question is, what are the implications given the weak polar vortex and wavy jet steam.
Will it tighten them up, or will they result in very different play out than typical el Nino weather.
Normally el Nino means a dreary and mild winter in SE michigan. I’m not counting on that this year even with a significant el nino.
From reading the comments, I think we need Bob Tisdale back to give a tutorial.
Here in Melbourne if feels like an El Niño. Everything should be really green, but the parks are half-brown, and the rivers are very low (I often cycle past Solomon’s Ford, and I use that as my point of reference). It’s not as dry as previous El Niños that I remember, but it’s still noticeable. Further north the indicators are difficult to read, with lots of rain in Sydney and Brisbane.
The current El Niño will be a weak one followed by a strong La Niña cycle from 2020.
The strong 2020~21 La Niña, combined with the concurrent start of a 50-year Grand Solar Minimum (GSM) event and the PDO/AMO/NAO 30-year cool ocean cycles will drive UAH global temp anomalies to -0.2C levels by 2021.
From 2022 onward, the PDO 30-year cool cycle will generate weaker El Niño cycles and colder La Niña cycles, and the AMO/NAO 30-year cool ocean cycles and GSM will all combine to cause a global cooling trend for many decades.
The 30-year AMO/NAO ocean cool cycles will also cause considerable Arctic Sea Ice recovery, which CAGW cultists will find impossible to explain.
I also think a VEI 5+ volcanic eruption will soon occur, which will further add to a global cooling trend.
By 2024, the long duration and huge disparity between CAGW’s global temp projections vs. reality will be sufficient to finally put an end to the biggest and most expensive Leftist ho@x in human history..
Patience, folks, patience.. CAGW is quickly imploding.
“I also think a VEI 5+ volcanic eruption will soon occur, which will further add to a global cooling trend.”
Well it’s been a while. Not sure that makes it more likely now.
A major stratospheric event is what the modellers are praying for. The exaggerated volcanic cooling built into models will then bring their results closer to the current record.
Greg Goodman:
You asked whether I had any data to back up my claims.
I have a posting on a pre-print site titled “Atmospheric SO2: Principal Control Knob Governing Earth’s Temperatures”, which can be viewed at https://OSF.io/bycj4/
Greg-san:
On average, the earth suffers a VEI 5+ eruption every 30 years or so. The last large eruption was Pinatubo in 1991, so especially in light of the increase in seismic and volcanic activity along the Ring of Fire and Iceland over the past decade, I think we’re “due” for another large eruption soon.
I have studied statistics and realize the probability of a large eruption occurring in any given year remains 1 in 30, but my prediction is based on increased seismic and volcanic activity, not statistics.
We’ll see soon enough.
I hope so SAMURAI. I just am so anxious for it all to happen. I think it will.
LOL keep telling yourself that.
“The trade winds normally blow from east to west (“easterly” winds, in meteorological parlance) along the equator in the Pacific. ”
I find this extremely confusing, as:
1. the accompanying map shows the wind at the equator blowing from West to East (ie. from Asia to the Americas) and
2. easterly/westerly when describing wind direction refers to the direction of origin, according to several online definitions consulted. This would mean that a wind blowing from Asia to the Americas is “westerly”, not “easterly”. An “easterly” would be blowing to the Americas from Europe or Africa, and seems to me an unlikely candidate for bringing cold water from the depths of the Pacific to the western shores of South America.
otropogo,
Background reading for you:
https://en.wikipedia.org/wiki/Humboldt_Current
Thanks for the link. But I’m no less confused about the use of the terminology and the wind map. I’ve known about the Humbold current, but the article refers only to winds, and my confusion is about the apparent contradiction between the wind map and the name given to the dominant winds. Maybe the problem could be avoided by expressing latitudinal wind direction as rotational/counter-rotational. In which case, the dominant equatorial wind direction on the map would be termed “rotational” .
BTW – while wikipedia is often useful as a quick reference and sometimes as a last resource, I’ve found it to be unreliable, unreceptive to corrections or enhancements, and lacking in transparency.
This is the change that’s being mapped below the surface, with depth, the past few months:
http://www.bom.gov.au/archive/oceanography/ocean_anals/IDYOC007/IDYOC007.201810.gif
As you can see, there’s a good chance of this warm water moving further east and up-welling to create an El Nino event.
Note however that this same sort of thing occurred earlier in the year, as well, then it reversed and dissipated. So there is no guarantee that it will occur this time. Here’s the data for April to July 2018:
http://www.bom.gov.au/cgi-bin/oceanography/wrap_ocean_analysis.pl?id=IDYOC007&year=2018&month=07
As you see, it’s never a sure-thing that an El Nino will result. The equatorial Easterly winds can simply change again, create more equatorial up-welling off South America, and the whole thing dissipates at the last moment.
No prizes for guessing why Gaia is the feminine gawd.
Currently the pressure over Tahiti are increased.
You make the common mistake of thinking that USA is the centre of the universe. Westerly and easterly are directions of the wind relative to the observer, not relative to the position of the USA. In the Pacific an easterly blows from US mainland, in the Atlantic it blows towards the USA.
As to your point #1, the wind map you are looking at is wind ANOMALY. Currently there is no westerly wind in the tropical Pacific, but the easterlies are weaker than average. It’s a bit like having “ocean acidification” when the pH is 7.8 😉
The ‘stunningly ignorant’ Joel Bryan seems to have made the same mistake at the top of comments.
http://www2.sunysuffolk.edu/mandias/met101/Global%20Winds.pdf
This clears up wind patterns nicely.
Thanks. Bit of a sledge hammer to kill a gnat, but it did provide the visualized description I sought to confirm my understanding of easterly/westerly (on page22 of 26). But maybe I’ll wait until the controversy is resolved before educating myself further at this source.
There’s a dangerous tendency to ignore the importance of clear terminology in science, or indeed, to properly proofread material before publication. I’m reminded of Richard Muller’s book ,”Nemesis: the death star”, mentioning that the project to establish the cause of the Dinosaur extinction by means of a globally uniform iridium stratum was nearly abandoned because of an erroneous entry in a reputable reference table of the elements.
A new wave of freezing air from the north is now fall above the north-central US.
http://tropic.ssec.wisc.edu/real-time/mtpw2/product.php?color_type=tpw_nrl_colors&prod=namer×pan=24hrs&anim=html5
https://upload.wikimedia.org/wikipedia/commons/f/f4/Equatorial_Kelvin_wave.ogv
Interesting animation of sea height anomaly during El Nino.
The west pacific warm pool drops a bit lower than average ( deeper blue ) and a wave of higher than normal water travels east. The Coriolis force prevents it dispersing north or south and channels it a bit like canal walls channel a soliton wave or river banks channel a tidal bore.
“You make the common mistake of thinking that USA is the centre of the universe. Westerly and easterly are directions of the wind relative to the observer, not relative to the position of the USA. In the Pacific an easterly blows from US mainland, in the Atlantic it blows towards the USA.”
Your remark above makes no sense to me. And my view is supported by the pdf linked below
http://www2.sunysuffolk.edu/mandias/met101/Global%20Winds.pdf
in which polar easterlies are clearly shown as being counter-rotational. Perspective has nothing to do with it, easterlies blow counter to the rotation of the earth, period.
People might be interested in my latest post at astroclimateconnection.blogpost.com:
https://astroclimateconnection.blogspot.com/2018/10/a-case-of-severe-cognitive-dissonance.html
My prediction is for an El Nino starting sometime around July 2019, followed by a La Nina in 2021.
I realize that I am sticking my neck out here, but someone has to step forward.
I appreciate your prediction Ian. I have stuck my neck out many times as far as trying to nail down the transitional year to cooling which I said would be this year.
You might enjoy this from Paul Dorian.
Ian, I found a pattern between equatorial OHC and TSI, where for each solar cycle there’s always deeper cooling into a LaNina roughly up to the point where solar cycle TSI first crosses above my solar ocean warming-cooling threshold (flat red line).
Accordingly your 2021 prediction in within range iff:
1) The solar minimum ends quickly and soon, and
2) The next cycle rises at a normal rate instead of a slower rate of rise like SC24
We are anywhere from about 24 to 48 or more months away from F10.7cm reaching the decadal warming threshold of 120 sfu again, so if the TSI-OHC pattern holds the deep end of that LaNina would be 2020 to 2022. If the end of this cycle is as long as the last, it could put that LaNina out to 2024.
Solar predictions are a dime a dozen .
You are of course referring to your own solar predictions.
My solar predictions have been spot-on since I started.
You regress to spite because your many pronouncements haven’t materialized.
Bob I am quite sure I am correct but I do not know what the threshold levels are, as far as how weak/long in duration the solar/geo magnetic fields have to be in order to have a major as opposed to a minor climatic impact.
As far as solar predictions good luck.
It would help you to have an updated graphic, as 1998 was so twenty years ago, with your prediction(s) to 20XX. My expectations likewise are for a post solar minimum cycle onset ENSO around the same time frame as yours. Perhaps we can discern both influences working together.
We are looking at double El Nino events, similar to 1986-88 and 2014-16, the first El Nino loses intensity before Xmas but doesn’t entirely dissipate. Then revs up six months later and packs a bigger punch.
ENSO is an enigma, so the first person to unravel its mysteries deserves high praise.
High pressure over Tahiti.
Tahiti (hPa) Darwin (hPa)
14 Oct 2018 1017.61 1010.50
13 Oct 2018 1017.48 1010.85
12 Oct 2018 1015.70 1011.35
11 Oct 2018 1014.51 1011.40
Ren does this pattern look like it continues over the coming days?
It’s possible. The cold eastern Pacific means high.
You need to look at the actual temperature in the Pacific.
Salvatore, look at the huge high above New Zealand.
http://tropic.ssec.wisc.edu/real-time/mtpw2/product.php?color_type=tpw_nrl_colors&prod=ausf×pan=24hrs&anim=html5
I thought we wanted low pressure in the New Zealand/ Australia area?
http://www.wxmaps.org/pix/aus2.00hr.png
I see what your saying Ren. I did not realize the distance between Darwin and New Zealand.
You are saying high pressure over New Zealand means it is more favorable for lower pressure over Darwin, while High Pressure looks likely over Tahiti.
This could short circuit the El Nino which looked like it was getting started.
Look at the jet stream.
http://www.cpc.ncep.noaa.gov/products/stratosphere/strat_a_f/gif_files/gfs_toz_sh_f00.png
Peruvian upwelling is strengthening.
So any “el Nino” will be a Modoki, centered in the central not eastern equatorial Pacific, not engaging the Bjerknes feefback, and thus not a true el Nino.
In fact, not really an El Nino at all.
I agree.
So Ren what do you think the chances are of having no EL NINO this winter?
“High – very high”
https://youtu.be/-irr1ml2pkc
You can see that the wind in the South Pacific does not react to changes in surface temperature.

The SOI index looks to be positive through at least Oct.22 which is not favorable for El Nino.
El Nino is more favourable during low solar activity periods because it weakens the Walker circulation. (Walker cell). The Walker circulation requires more energy from the sun to drive it, but the decline in solar activity has been in no co-incidence with an increase in El Nino’s. While there is low solar activity medium/strong La Nina’s should be absent and increases the chance of a step down in global temperatures.
The last period of often frequent recurring La Nina’s occurred after peak solar activity from the 1950’s until the 1970’s. It is this mechanism that confuses climate scientists into thinking there is little/no influence from the sun because itself causes a negative feedback in the atmosphere with the Walker circulation. Behind the scenes this reduced energy in the atmosphere is transferred into the tropical oceans at depth warming them. This energy then builds until the next strong El Nino event catapults global atmospheric temperatures once again.
Still waiting for El Niño?
Vladimir’s blues:
https://youtu.be/zysmTUKMbUI