Sea Surface Temperature Anomalies of the Patch of Warmer-Than-Normal Waters in the North Atlantic

Guest essay by Bob Tisdale
With Hurricane/Tropical Storm Florence approaching the continental United States, the patch of warmer-than-normal waters at mid-latitudes of the North Atlantic (see Figure 1) is sure to generate some nonsensical statements about human-induced global warming-climate change from the mainstream media and alarmists.
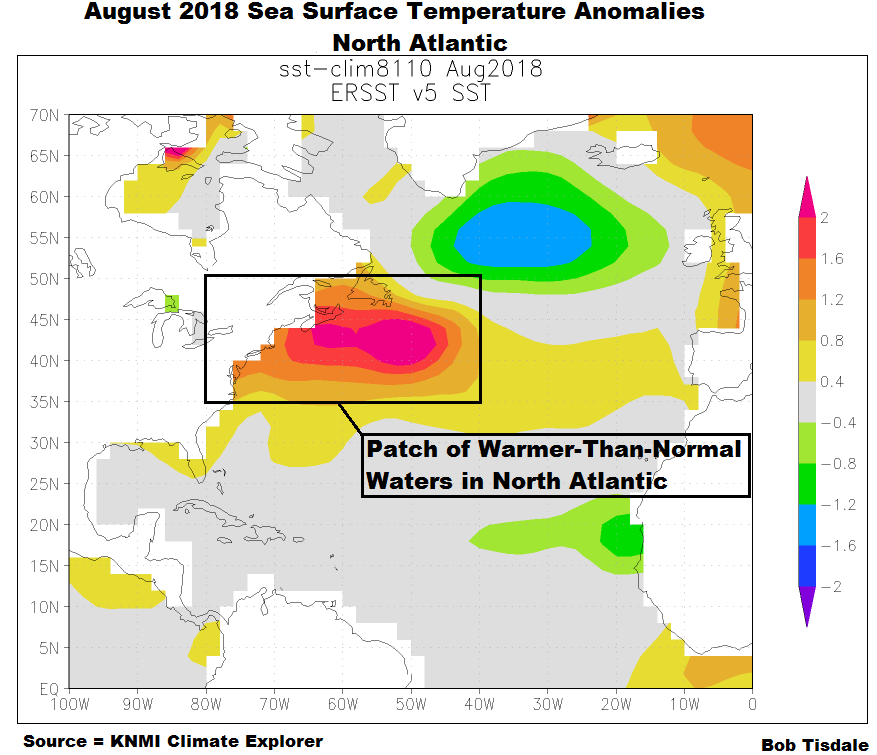
Figure 1
Therefore, it seems like an appropriate time to present the long-term sea surface temperature data for that patch of warmer-than-normal waters. Figure 2 is a time-series graph of the sea surface temperature anomalies for the coordinates of 35N-50N, 80W-40W, which captures those warmer-than-normal waters. For the dataset, I’m presenting NOAA’s much-adjusted ERSST.v5 sea surface temperature dataset. Like always, I’ve downloaded it through the KNMI Climate Explorer.
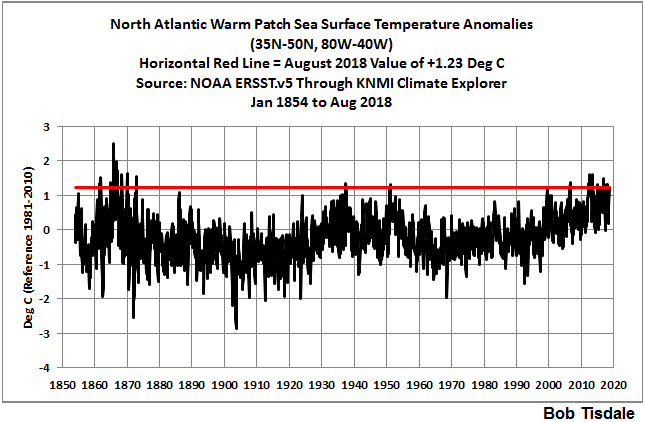
Figure 2
As we can see, the August 2018 sea surface temperature anomalies for August 2018 were +1.23 deg C for that region. We can also see that that value has been met or exceeded as far back as the 1860s, 1930s and 1950s, so it could be said that there’s nothing really unusual about the temperatures of that patch of warmer-than-normal waters in the North Atlantic because it’s happened before. And looking at the long-term cycles, one might assume they have to do with the Atlantic Multidecadal Oscillation (See the NOAA AOML FAQ webpage here for more info on the Atlantic Multidecadal Oscillation.)
Hope this post helps you combat the nonsense.
As soon as NOAA’s satellite-enhanced sea surface temperature data for August 2018 are available, I’ll be publishing a post about the sea surface temperature anomalies for the hurricane formation regions. I suspect it will be available sometime tomorrow or Tuesday, which should be in advance of Florence making landfall, assuming she elects to pay a visit to the U.S.
PLEASE BUY MY EBOOKS
As many of you know, this year I’ve published 2 ebooks that are available through Amazon in Kindle format:
To those of you who have purchased them, thank you. For those of you who haven’t, please do.
Cheers
Bob
I’m surprised the data prior to 1902 or 1903 to generate this chart (fig 2) hasn’t been disappeared.
Or at least Karlized to reduce historic temperatures and enhance current temperatures
Is there an archive for raw data similar to archive.org?
Thanks, Anthony.
Cheers,
Bob
Been missing your posts Bob…..thanks
Your sea temperature chart has a similar profile to the Hansen 1999, US surface temperature chart:
What ha s ACE been like in the last few years of “unprecedented” warmth?
Here is my comparison done in 2015. Note the divergence with ACE plunging during the pause, as it also appears to have done during the plateau of 30s-40s
I need to get time to update this a couple more years data now.
Greg, what’s the correlation coefficient for those two plots?
Thanks.
Warmer water around Newfoundland has long been observed when greater jet stream meridionality occurs leading to more frequent and persistent east to west flows of air in higher latitudes. It appears that air flowing from the east inhibits the westward flow of warm Gulf Stream surface waters so that they pool around Newfoundland.
I first recall it being mentioned during the very cold European winter of 1962/3.
It is associated with a more cloudy, cooling world though there is significant time lag as per Fig 1 which places the climate consequence within the early stages of the next phase.
The 1930s were warm after a period of falling water temperatures in the region by which time the waters were already warming once more whereas the 1950s and 60s were colder after a period of rising water temperatures in the region by which time the waters were already cooling once more.
Since the region has been getting warmer recently that should foreshadow a colder period in the near future provided it persists.
Steven
Yes I wondered if this east Atlantic warm buildup was due to some curtailment of the Gulf Stream.
North Atlantic running below normal for months. Central Atlantic is where waters are associated with Florence.
Salvatore Del Prete writes, “North Atlantic running below normal for months. Central Atlantic is where waters are associated with Florence.”
The SSTA graph you’ve provided is for the NORTHERN North Atlantic, NOT the North Atlantic as a whole. Also, it can’t be compared to the graph I provided. And Florence is nowhere close to the 45N-65N for the graph you’ve provided. Florence is just outside of the tropics. So why’d you bother?
The ECMWF Euro model has Florence hitting the Carolinas south of Cape Hatteras sometime on Thursday.
Those are warm waters, especially in mid-Sept, the peak of the annual water temps, and with the Gulf Stream just offshore. But those waters are not anomalously warm. But still enough to make a Cat 2 or 3 as it approaches the coast.
That looks like one bodacious sneeze-o-gram. The “spaghetti charts” frequently have the proposed storm tracks all over the place, but this one is pretty tight.
They have it too low right now….the track will gradually move north
Based on…? It would be nice to share data if you have it.
they all swing north…eventually. The question is when.
I am not so sure, Latitude. We have a classic battle brewing between the European Model (ECMWF)and US GFS model. The ECMWF wants to take Florence inland over North Carolina all the way to the Appalachians, before meandering the storm for 2-3 days while she gradually rains herself out. The flooding would not be unprecedented, but very deadly, damaging and dramatic.
The GFS wants to take Florence a little further north and slowly meander it north over Eastern Virginia or the Delmarva Peninsula, then lifting out to the northeast and into the North Atlantic.
The determining factor will be the strength and persistence of the ridge of high pressure that extends from the North Atlantic into the NOrtheast US, directly over the warm water depicted at the top of this article.
Joe Bastardi is arguing that the warm water is keeping the atmospheric ridge of high pressure stronger than it otherwise would be, which is a very sound argument. The GFS does not handle this as well as the ECMWF, and has been curving storms northward to aggressively.
Over the past week, the GFS has been shifting the track of Florence west and south, coming ever closer to the ECMWF solution. At the same time, the ECMWF has been pretty rock-steady with its North Carolina Landfall.
I think Florence may still have some tricks in her bag that she will display after landfall. Meandering storms often do unusual things. We might see Florence split, with a surface low actually drifting south towards the Gulf of Mexico, while the mid and upper levels of Florence get sheared off to the north and northeast.
It is not too soon to start praying for those in the path of this storm. Hopefully, everyone will heed the ample warnings and do what they need to do to protect themselves.
Latitude.
Yes l agree with you this hurricane will track to the north end of the current range
Good call. A preemptive assessment of the inevitable “new normal” and “unprecedented” claims is appropriate and may get to the right people in time before the media floods us with false claims. I suggest more of this to put the skeptics on the offensive rather than defensive/after the fact mode because once the bomb has been dropped the damage is done.
Yes. The word “normal” is often used as in “above normal” or “below normal” but what they mean by “normal” is rarely defined. Definitely no timescale given.
PS The climate has always changed naturally yet they have a climate “normal”. Just who are the ones denying “climate change”?
The “press” have been waiting withe bated breath for a hurricane all summer, surprised they have not been pushing the higher sea surface temps data to bolster their courage. They will be mightily disappointed if Florence does not strike US and cause huge destruction and kill many people. I have actually been surprised by how inactive Atlantic Basin has been this season. Pacific has certainly been active enough, thank God most of them just spin out into open ocean.
The lowish CAT means that the worse-evah brigade will be focussed on rainfall, which depends largely on how fast the thing moves, not obviously connected to AGW, but that won’t stop them.
El Nino is still languishing . Its half way uncertainty will probably mean the strength of Florence will be a rung or two down from the Cat4 forecast. We’ve had a few Pacific Storms, too – they tend to alternate with Atlantic storms dont they?
Cat 3 is a fairly strong storm.
I have friends who live on the Carolina coast. I’m hoping that Florence kind of peters out on her trip across the Atlantic and turns into a Cat 0 with mostly high surf, and the rain cloud moves across the mountains into the Tennessee and Ohio Valleys.
My parents along with my sister and her husband are on vacation this week at the Outer Banks in Frisco. Hopefully their trip doesn’t get cut short.
So the realty company (Midgett Realty) has already kicked them out earlier today way ahead of the storm. Complete BS. The area is not even supposed to start seeing real effects until early Thursday morning, and that’s if the storm keeps the same general track. They only just arrived to the beachfront house Saturday evening. Just one full day is all they got to enjoy.
There’s a fear of traffic jams with few bridges inland. That’s why they send people away from the coast early.
Only problem is everyone is evacuating at the same time right now and causing huge traffic jams. They’re currently stuck in it trying to leave the island.. Should at least do staggered evacuations.
It’s not BS. The official ‘Emergency status” went out earlier this morning. I have a friend monitoring NOAA’s reports and updating them for us on another blog. Florence is about halfway across the Atlantic and Helene (looks small and weak) and Isaac (already formed and solid) are not too far behind Florence.
Hampton Roads is being evacuated as of this afternoon. And the Navy has directed all its ships to evac the Carolina/VA coast.
Bob Tisdale,
Thanks for the information! Might you have a similar plot to Figure 2 for the anomalously ‘cool patch’ below Greenland as well? It might make for an interesting comparison…
The important question is, “What did men do to the climate in the mid 1860s that made the ocean so hot then?
Obviously, Mother Nature was outraged at whale hunting.
@Matthew Thompson: Durn STEAMSHIPS! All that extra heat.
Thank you for your books. Don’t know if you saw the September 1-2 WSJ Children’s Books Review by Meghan Cox Gurdon (p. C11) with the headlines “THE YOUNG PERSON’S GUIDE TO POLITICAL GRIEVANCE.” There were seven books (from 113 to 304 pages) including “The Revolution Handbook” and “Steal This Country” the last which gave the “correct opinions” on “…bigotry, patriarchy, ableism [whatever that is], white privilege, feminism, Black Lives Matter, climate change, environmental racism, immigration, preferred pronouns, gun control and LGBTQIA rights.”
The review ended “Listing enemies, tabulating “daily oppressions”… sewing up a man’s mouth, even on paper–it seems such a joyless way to spend the fleeting years of adolescence.” Based on the reviews these books are unconscionable treatment of immature individuals. Indiscriminate application appears punishable, they seem to be “… shouting fire in the theater.” So much “..for the children.” I grew up during WWII, let’s just say that they had more sense then.
As to Atlantic temperatures all publishing on them should be required first to take a slow boat to Europe (with a thermometer) or the equivalent.
Botox and tooth bleaching agents apparently both make an exothermic reaction when mixed with water. The little patch of red hot water off the eastern USA is caused by drainage runoff to the sea of waste Botox and tooth-bleaching chemical from Washington and New York’s politicians and celebrities.
https://www.ospo.noaa.gov/Products/ocean/sst/anomaly/
This minor local warming caused by waste cosmetic chemicals from America’s aristocracy will of course be screeched and re-screeched as evidence of global warming and of the entirely man-made phenomenon of the hurricane that never occurred before Jimmy Carter.
Of course the talking heads are house-trained enough not to notice, mention or even think about the real gorilla in the room – massive peri-Antarctic and SH SST cooling. No – better just dash back to the mirror.
Florence? Same old same old. Much ado about nothing.
The left media will go hysterical about the first hurricane in recorded human history (although why is it already “F”? – never mind) and global warming and how Donald Trump paid Russians to make a hurricane.
Then it will fizzle, and the 24-7 commentary will sashay smoothly to heavy rain and why heavy rain means that democrats are good and republicans are bad. How it never rained before Vladimir Putin.
I really like the storyline that the Russians were paid by President Trump to create a hurricane. CNN will run that 24/7 if you can provide any example of a Trump Administration official denying it (which is all the proof they require).
It may well fizzle, but it could be like Hugo. What a mess that made! Entire forests of southern pines snapped like match sticks.
The media is like the boy who cried wolf. When a real hurricane like Hugo comes along people are jaded and don’t pay attention.
Google Hugo or Andrew and look at the pictures of what a hurricane can do if it plows ashore and doesn’t curve out to sea. Then if this one looks like it is coming straight in and it is force three or four get the heck out.
Not completely implausible, but check the ICOADS observation count for those 1860s peaks. Barely any observations at that time (I guess partly due to the civil war) so wildly uncertain estimates.
This EPA chart shows SST and PDI closely linked until about 2003 when it un-linked and gave us the start of the now infamous cat 3+ hurricane drought.

Has the SST data been tampered with?
The current jet stream activity in the mid Atlantic suggests this hurricane will track at the north end of this range. Then will run up along the eastern coast where it will quickly by weaken by the strong jet further to the north.
It’s gonna be the worst storm ever–
Not only are we dealing with a landfalling Category 4 hurricane — the same strength as Hugo in 1989 –but maybe also a multi-day heavy rainfall event which could produce catastrophic inland flooding.
All signs are that #Florence could be one of the worst storms in U.S. history.
— Eric Holthaus (@EricHolthaus) September 9, 2018
Eric Holthaus needs to up his Xanax, grab his blankey and pacifier, and get to his safe-space.
Q: What does Eric Holthaus wear to a ‘hurricane party’?
A: Depends…..
I am interested, as should be the Russians, how Eric Holthaus knows this with any certainty at all. That is quite the heck of a specific claim. Suppose I spend $5000 installing Lexan window covers to protect my home and the storm turns north and blows out over the N Atlantic without killing anyone. Can I sue him for my $5000 loss?
What sort of warranty is provided by Mr Holthaus on this unsolicited and improbably precise advice? If he is right on the money with this remarkable certain forecast, the Russians will want to kidnap him to learn how on earth his musings create predictions with such aclarity. True genius I suppose. Let’s watch.
If I was on your jury, I would give you your $5,000 back. Eric would have to pay up for misleading the public. 🙂
Apparently the U. S. Civil War was some hot ‘stuff.’ Much of the naval action did take place in the “North Atlantic Warm Patch.” It was the cannon generated aerosols wot dun it.
there do seem to be 3 potential hurricanes on the [way] to be in play. Hope the other 2 fizzle.
Heat in the tropics and near tropics drives the world temperature. If we are to have a pause the anomaly will need to stabilize at a the same average anomaly as what was occurring during the pause after an initial fall under that to bring it down to that level. Needs a La Nina phenomenon to bring it down [25% chance currently].
Any long term change is likely to be excruciatingly slow [just because].
That does not rule out a quicker 30 year sustained drop just like we had a sustained rise before the pause.
“Nonetheless, I have been waiting for cooling all year, and it has not happened”
Fatuous comment.
You claim to have been looking at El Nino in which case you would have observed that a strong La Nina did not occur hence you have no grounds, on observations you should have made, to have any such expectations.
Scientifically a slight inconsequential warming in GST is to be expected with extra CO2 in the world if there are no large confounding negative cloud feedbacks.
This will underpin a natural variation that is quite capable of a 2C top to bottom variation in GST over 60 year time frames.
We desperately need a shift down in the natural variation to take the wind out of a false narrative. This could happen in 2 , 60 or 240 years to go for the usual 2SD scenarios.Impetus stalled at moment, let us hope for more clouds and a La Nina.
[Dupe ?? .mod]
Governor of South Carolina has ordered evacuations of coastal areas.
Hurricane Florence is rapidly building strength, approaching Category 4.
https://www.accuweather.com/en/weather-news/reports-entire-coast-of-south-carolina-ordered-to-evacuate-ahead-of-unprecedented-hurricane-florence/70006014
I am glad to see that the media are consistent in their use of hyperbole, this time with the word “unprecedented”. I have no idea why Accuweather would use that word. Category 4 is not unprecedented for a hurricane of any kind. Sometimes, those people just do not make any sense at all.
There is still time for Florence to veer north, however, but at present, the general target area appears to be Wilmington, SC.
In Wilmington NC, it rains sometimes, the wind blows, my house has been here since 1961 and expect it will be so after this storm too.
thanks bob, this partially explains something i have been pondering for a while regarding that area.
Didn’t Joe Bastardi earlier in the year predict a tropical cyclone taken this basic path?