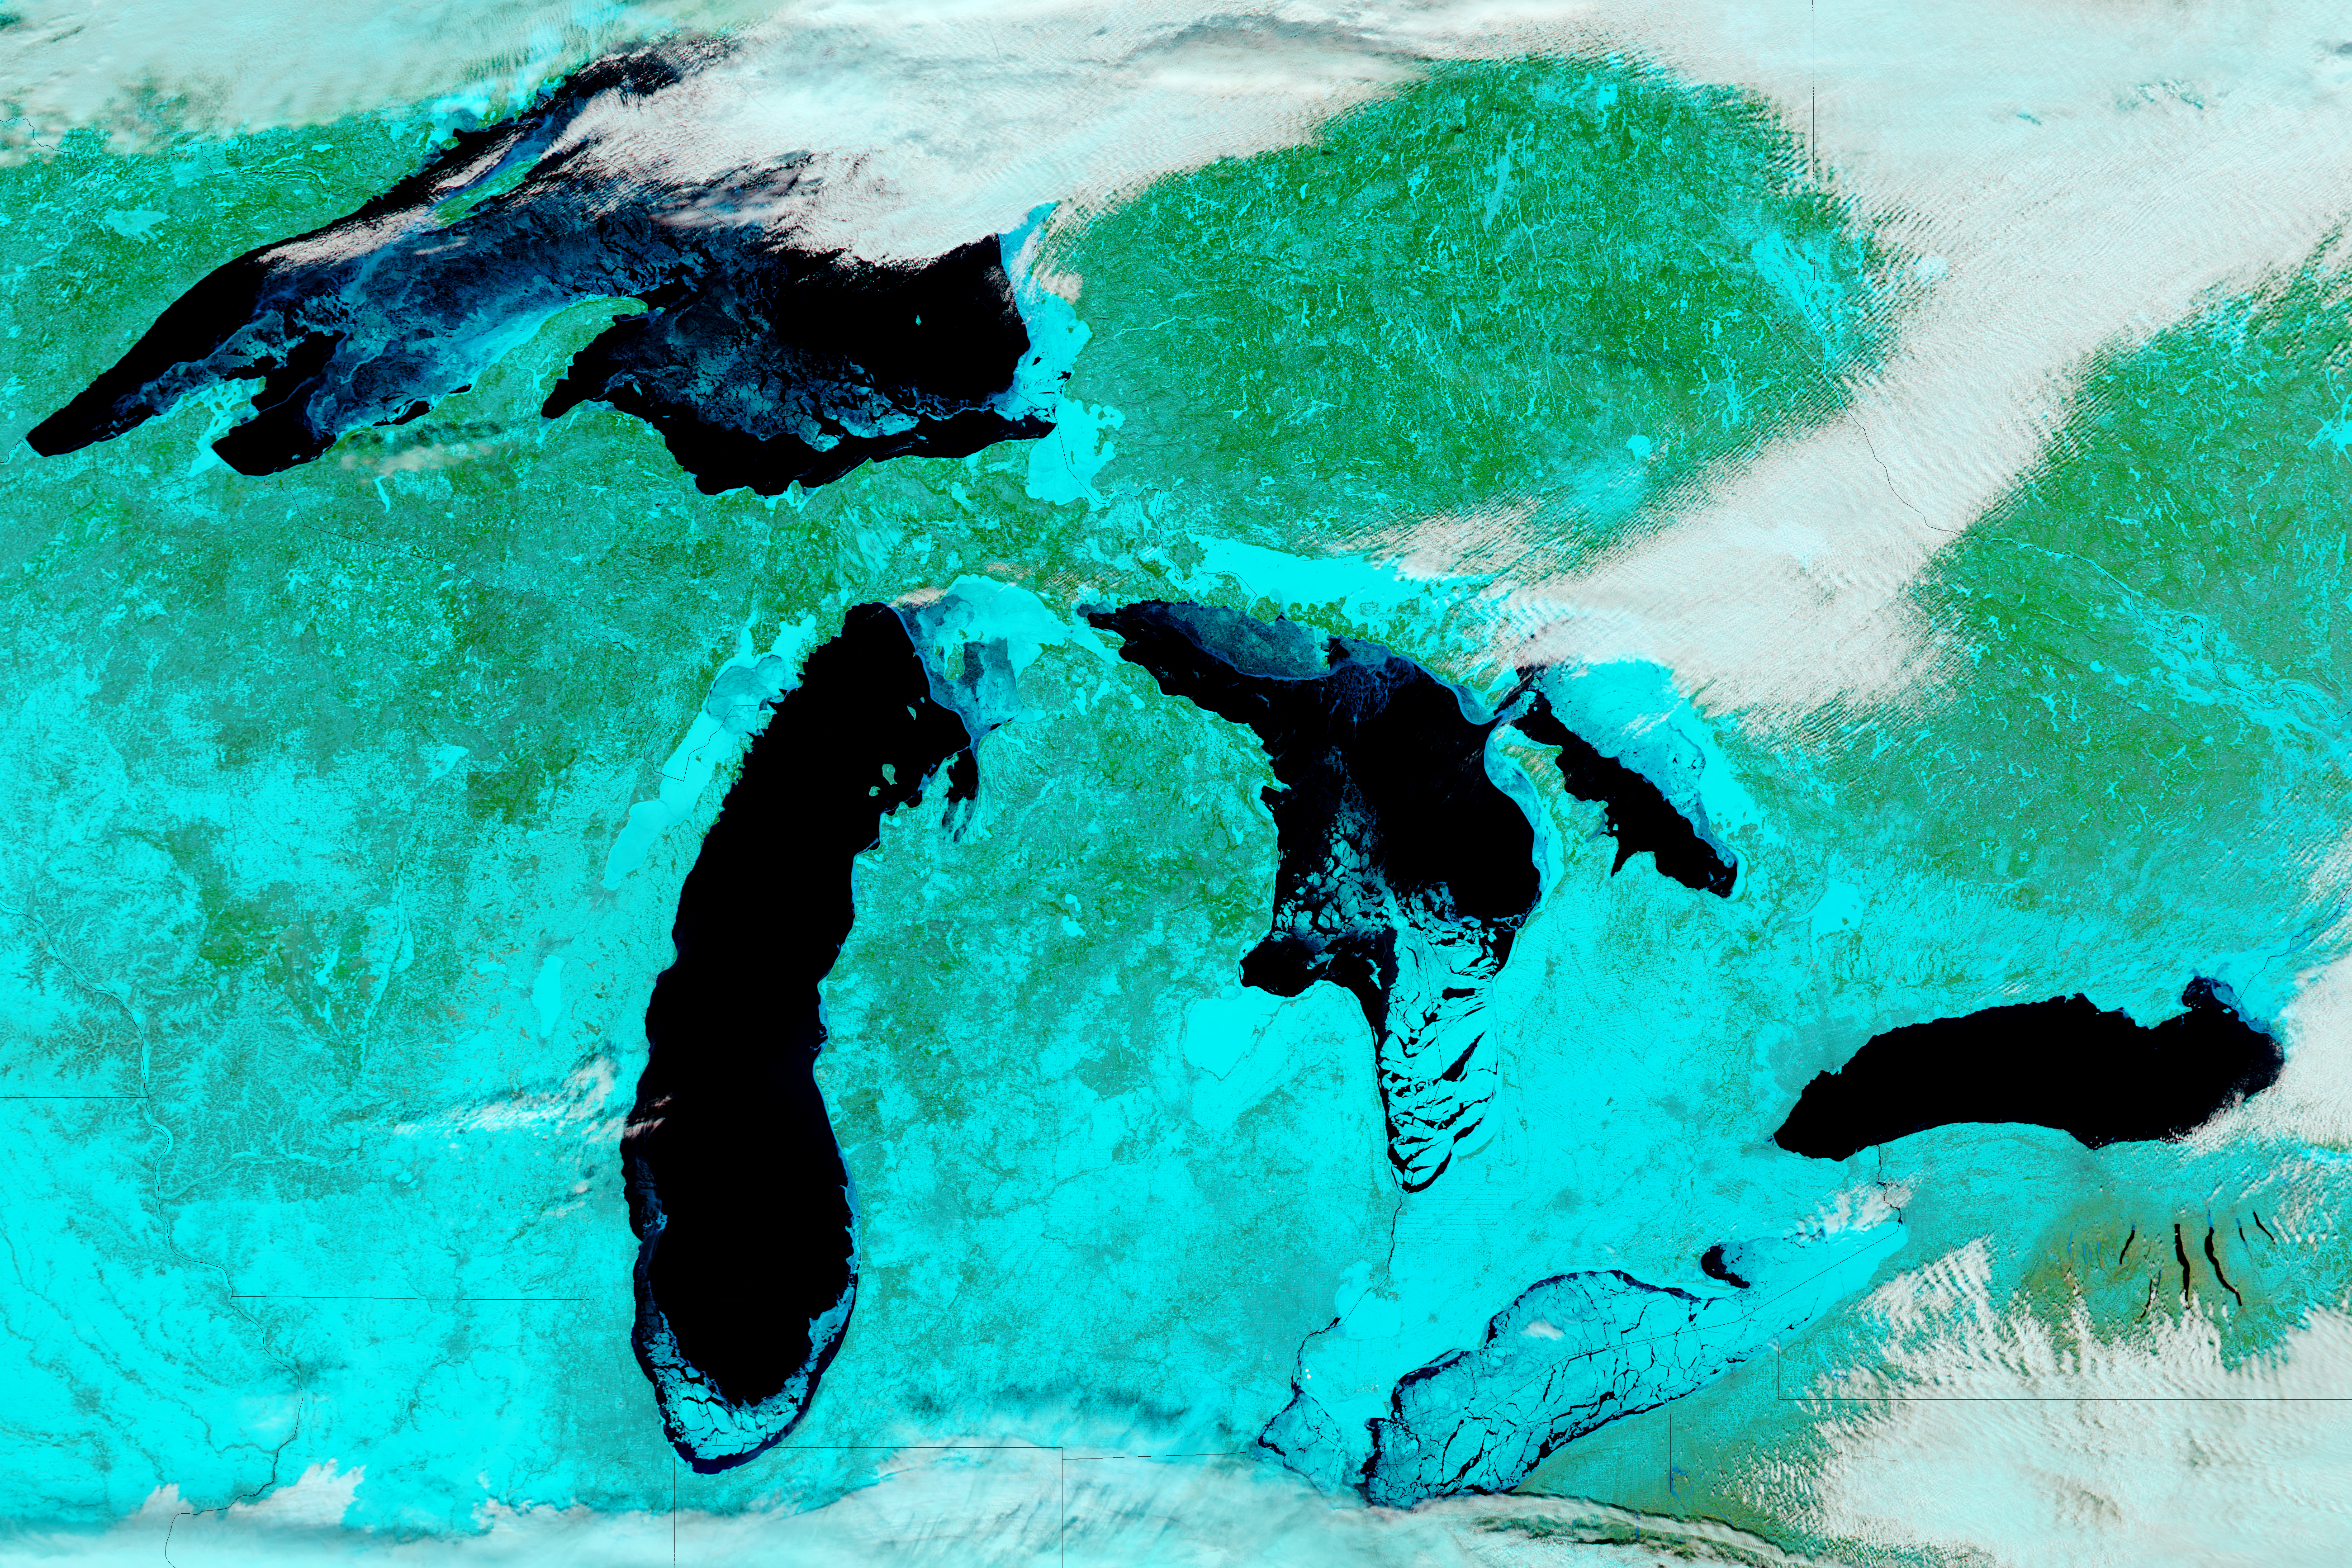
The unusually cold winter in the Upper Midwest has led to a notable buildup of ice on the Great Lakes. Lake Erie is usually the first to freeze over because it is shallower than the other Great Lakes.

 download large image (19 MB, JPEG, 5200×3467)
On February 14, 2018, the Moderate Resolution Imaging Spectroradiometer (MODIS) on NASA’s Aqua satellite acquired data for these false-color images of North America’s Great Lakes. The images were made from a combination of infrared and visible light (MODIS bands 7-2-1) in order to better differentiate between snow and ice (teal) and clouds (white). Open water appears black, though some of the dark areas likely have a layer of clear ice (without snow cover on it). For a detailed map of ice extent and thickness on the Great Lakes, visit the Great Lakes Ice Analysis page.
When these data were acquired, 57.9 percent of the surfaces of the Great Lakes were covered with ice, according to NOAA’s Great Lakes Environmental Research Laboratory. On the same date last year, total ice cover was 9.7 percent. Lake Erie was the iciest of the five lakes, with 93.3 percent iced over.
Lake Erie is slightly larger in surface area than Lake Ontario (the smallest of the five Great Lakes), but Erie is relatively shallow and contains less than one-third of the volume of water found in Lake Ontario. Lake Erie is generally the first to freeze in winter and the first to thaw in spring.
All of the ice poses challenges for shipping. In January 2018, the U.S. Coast Guard sent an icebreaker to free five ships trapped in ice in the Straits of Mackinac. However, it is a boon for fisherman. Outdoor shops that cater to ice fisherman on Lake Erie have seen a spike in equipment supplies, according to AccuWeather.
-
References
- AccuWeather (2018, February 14) Fishing economy flourishes as most extensive Great Lakes ice coverage accrues in 3 years. Accessed February 15, 2018.
- GoErie (2018, February 14) Lake Erie is 89 percent frozen over. Accessed February 15, 2018.
- Michigan Live (2018, January 19) 5 ships stuck in ice in Straits of Mackinac. Accessed February 15, 2018.
- NOAA Great Lakes Environmental Laboratory (2018, February 14) Great Lakes Ice Cover. Accessed February 15, 2018.
- University of Wisconsin–Madison CIMSS Satellite Blog (2018, February 14) Ice Motion on the Great Lakes.Accessed February 15, 2018.
- WoodTV (2018, February 14) Lake Michigan Satellite Picture Shows the Ice. Accessed February 15, 2018.
No matter what the weather does, it will be fit into AGW.
Yes Tom.
MORE ICE ON THE GREAT LAKES?
i BLAME GLOBAL WARMING!
THE SCIENCE IS SETTLED!
“PILTDOWN” MANN’S HOCKEY STICK PROVES IT!
ANYONE WHO DISAGREES IS A CLIMATE DENIER!
CLIMATE DENIERS SHOULD ALL BE IMPRISONED!
{Do I really have to say “sarc/off”?}
Yet GISS temp map shows that area as about [average] for January. https://data.giss.nasa.gov/gistemp/maps/
Whoops – ‘About average’
GISS temp hopefully is about to vanish. That junk can’t even be called a data set
Ian G
That’s because the anomaly on that GISS chart is set to the 1951-1980 average, when temperatures were cooler than more recently. If you change the chart to the 1981-2010 average it shows cooler than average temperatures in that region.
I understand that DWR54.
But two things;
Either the lakes froze each year during the 1951-1980 period,
or
it wasn’t as cold as all that this Jan as it shows the area only being in the +0.2C to -1.0C below average range.
Montana was very cold but shows the state above average.
I miss Griff
Yeah, he was interesting in his own way.
I don’t. And if I want to know what Griff would have posted I can alway go over to SkS and read the comments on 8 year old threads. It isn’t like he ever altered anything he wrote to include new info or responded to having his mistakes and misinformation pointed out again and again.
~¿~
At least Griff would slink off when sufficiently embarrassed. Our current crop of trolls just keep on posting.
Not me
An interesting read (I think).
https://science.nasa.gov/science-news/science-at-nasa/2013/08jan_sunclimate
The Perfect Storm is Brewing for Lower Global Temperatures in 2018
A perfect storm appears to be forming that will likely result in lower global temperatures. The introductory graphic highlights how we have fallen from an El Niño condition to a La Niña condition. Here at CO2isLife, we have always maintained that if you understand the oceans, you understand the global climate. The oceans cover over 70% … Continue reading
https://co2islife.wordpress.com/2018/02/16/the-perfect-storm-is-brewing-for-lower-global-temperatures-in-2018/
Global warming propaganda has made me become an evil person. I WISH for drops in temperatures, harming millions, just for the schadenfreude of proving the CAGWers propaganda to be nonsense..
Me too, as it disturbs me that sometimes I’m more wanting to live longer now – just so that I’ll be around when the truth comes out – rather than for family, etc.
Alan, the converse of your statement is also true.
I hear many CAGW people warning that millions are going to die due to climate change, yet they are clearly “rooting” for the annual temperature records to be broken.
These people baffle me.
The one thing that Warmistas and non-Warmistas agree on is that people will have to die. Warmistas think that they will die of heat, Non-Warmistas think that they will die of cold. It is very sad agreement.
If we stop wasting so much money on energy solutions that can’t work, there is more than enough money for adaptation. Whichever outcome occurs.
Fair play to you for being honest, and also recognizing the downside of it.
I think we all may be prone to a little of that (without the people freezing to death bit obviously)
…..The part that I find most baffling is the apparent faith-based, unreasonable belief that so-called “renewable” energies will someday somehow provide for the energy that is needed to sustain modern technological civilizations. A re-institution of institutionalized slavery, anyone? That will be the most predictable outcome.
Keep wishing. Lake Eerie is just not going to be quite enough.
https://forum.arctic-sea-ice.net/index.php?action=dlattach;topic=2223.0;attach=97198;image
Zazove:
Be aware that, since late August, there has been little to no solar energy absorbed in the exposed Arctic Ocean waters under that so-called “missing arctic sea ice” up north. Yes, the current arctic sea ice extents are below the 1981-2010 daily averages. They are below even the more recent 2001-2010 daily sea ice extents. But, for 8 months of the year, less arctic sea ice = more cooling of the ice-free arctic ocean. Yes, the ocean does gain energy mid-April to mid-August.
But not very much, compared to the year-long extra losses by evaporation, increased convection losses, increased LW radiation losses, and reduced conduction losses through the “missing” arctic sea ice.
Show me your calculations for how much heat energy is gained in the Arctic this month due to the sea ice melting as we see. Last month.
RACookPE1978
I am just posting a graph of what’s happened over the last few decades based on data from: http://global.jaxa.jp/
If less ice means more heat escaping why has there been a decline? The ice volume numbers are even more clearly tumbling, refusing to cooperate with all attempts to predict otherwise.
I’m not here to do calculations for you, it just gives me pause for thought and I’d like to understand why it’s happening. Because it is happening and so there is every reason to ascertain why.
Sad but true co2islife, sad but true. All the signs point to the fact that we are at the end of the interglacial. And now the sun is winding down for a while. My heart goes out to the generations to come. Meanwhile, the smarmy Schmidt et al continue with their thoroughly discredited “the science is settled” stage show. Surely somehow, sometime, the MSM media worm has to turn and we will have properly-educated science correspondents who will have the guts – and the knowledge – to call an end to the CAGW farce.
Remind we, when did the MSM finally run articles admiting that the Population Bomb or Peak Oil were just shoddy science, and since all the predictions had failed they were now safely discredited?
~¿~
In September 1938 when Chamberlain returned from the infamous Munich conference this is what the New Yrok Times wrote:
“Let no man say that too high a price has been paid for peace…”
You know what happened after that. My point is that I don’t recall the New York Times ever admitting that they were wrong or apologizing to their readers. To misquote Al Gore in “Love Story,” being the news media means never having to say you’re sorry.
Joe Bastardi, on his twitter thread, said that he believes there will be a weak Modoki Nino next year.
Reminds me why I moved permanent residency from Chicagoland to Fort Lauderdale.
Winters in my neck of the woods (Milwaukee) are warmer than when I was a kid. I’m 73
Go to https://data.giss.nasa.gov/gistemp/station_data/ and hunt down the weather station closest to your boyhood home. You might be surprised.
Note some of the stations listed claim to have data from the 19th Century in Florida. I know some of the stations were moved, e.g., Tallahassee. It was moved from a lower lying area up to higher ground. Orlando’s weather station was historical at the old Orlando Air Force Base a MAT base, now it appears to be listed as being at Orlando International Airport which was McCoy AFB a SAC base until Disney arrived. McCoy was miles outside of town surrounded by farm land. I know I drove back and forth several times per week while dating a Colonel’s daughter. Now it is surrounded by major development and industry about as far as you can see. And the airport was dramatically expanded after the Air Force moved away. Apalachicola, an much older historic weather station dating way back but it is no longer listed. Apalachicola had been a major seaport and was the number one weather station we listened for while at sea in the eastern Gulf of Mexico.
I think I would say the same for my area (central Alberta) but I feel summers have become cooler. I blame both on agricultural and urban development. Much greater impacts than the tiny increase in CO2. I am 75.
Hey Rocky! Next door in Sask. Summers
in the 60’s were definitely hotter and winters colder and snowier. I would also say that it was drier in summer and that caused the higher highs. I couldn’t say if the average temps were much different as my memory isn’t good enough but there was certainly more extreme temperatures and weather.
I was a farmhand in the 1960’s and it was definitely hotter in summer than it is these years. I recall seeing the Shell Tower thermometer (a big illuminated set of lights) show 106 F in late August. That is on the Toronto Waterfront.
Yes it was in an urban heat island, but it is never seen these days with far more ‘urban’ and a much bigger ‘island’.
Cooler summers and warmer winters are strong evidence of negative feedback to increased CO2. Win-win.
I think winters in Mpls are about the same except there are a lot more people and black top.
You have to love global warming theory…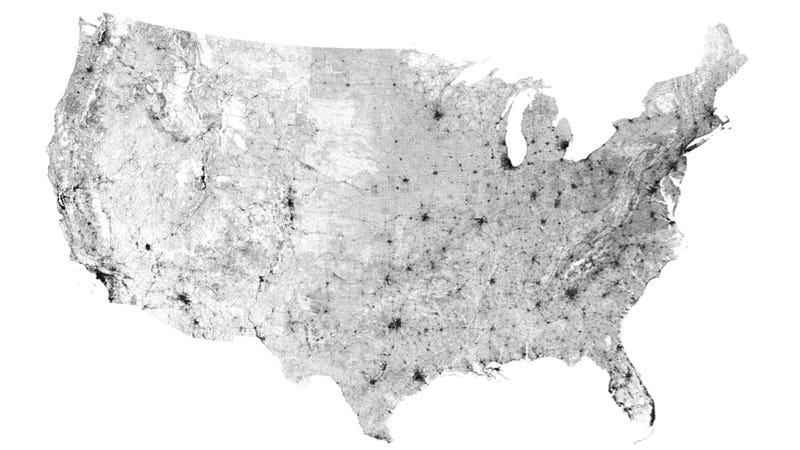
If we paint all of our roofs white…it will make a huge difference
…but all those miles of asphalt have no effect at all
Roads in USA…..
Latitude, your posted map of “Roads in USA” only depicts a partial glimpse of the “no effect at all” non-problem, ……. thus I offer the following to enhance one’s view of the extent of said “non-problem”, …….. to wit:
4,071,000 miles of roads X 5,280 feet/mile = 21,494,880,000 linear feet,
and @ 12 feet wide, 21,494,880,000 linear feet = 257,938,560,000 square feet of roadway surface
and 257,938,560,000 square feet = 9,252.3 square miles of roadway surface in the United States
and that doesn’t include the thousands of square miles of rooftops, sidewalks, parking lots, playgrounds and other “Solar heatsinking” infrastructure.
And just how “hot” can all that surface area become when exposed to Sunlight, to wit:
Now that shur is a lot of “non-problem” surface heating that wasn’t much of a problem 120 years ago.
Hi ya neighbor. I moved to Washington Island for the cold weather adventure. Age is catching up with me.
Every now and then we take the ferry ride out there. Biked across the island once and took a tour of the Rock Island – Light house & Boat house. Great place to visit. Live there? I’d have to think about that one.
We found Washington Island while bicycling Wisconsin, and moved here to bicycle heaven, and a Fifties lifestyle. Slow, isolated, frugal, safe. small town America, Scandinavian …
**Winters in my neck of the woods (Milwaukee) are warmer than when I was a kid. I’m 73**
But not when my mother was a kid in the 1930’s. Of course they have altered the temperatures now.
The temperatures in the 1930’s are colder now than they were in the 1930’s, but not as cold as they will be next year.
Good time to revisit how this area formed. Enjoy a good read.
http://academic.emporia.edu/aberjame/student/damery1/gl_form.html
Indeed – though one wonders what was there at the end of the 3 preceding glacial periods?
Meanwhile – moving a bit to the West . . . http://hugefloods.com/LakeMissoula.html
Pamela, I loved the read. Growing up, living, working and raising the family in this territory has been great. Now, the winters should be visited only by these old bones. Heading south to Texas methinks.
(credit: NOAA)
Nice graphic. Would be more telling if it began in 1910. Would several decade’s long trends become apparent?
US didn’t really measure until about 30 years ago. [Some] of the data from that presentation actually comes from the Canadians. Hard to really do such a survey without satellites.
Very nice. Thank you.
Not really any explicit trend visible in those 45+ years.
Note: The Great Lakes are “far south” compared to the classic”The Arctic sea ice is melting and we’re all going to die” exaggeration all too often repeated for the cloying media by the climatrologists.
Thus, any single square kilometer on the Great Lakes at 40-45 degrees latitude reflects far MORE solar energy than does any equal-sized area up north between 72 north and 89 north latitudes. (They’re still in the dark up north. Any “missing” sea ice in the Arctic Ocean right merely cools the planet even more.)
Back in 1948 we moved to Lake George N Y. That winter Warrensburg had 50 degrees below zero. It’s been a lot warmer since but two years ago we did manage to hit 25 below. I feel temps are on a downward trend but only time will tell.
During the winter of 1948-49 it snowed a few inches in Loma Linda, California (around 34 degrees latitude, and a little over 1000 ft. elevation.) Dad and I made a large snowman. It was quite incongruous with palm trees in the background.
Albert Brand, …… it t’was in the early 70’s, don’t remember exactly which year, when I was living in the Town of Schuyler (near Utica), one winter morning my outdoor thermometer was registering -37 degrees ….. and I was told that in Port Leyden, NY, on that same morning, the temperature was 42 degrees below zero.
Me thinks the “winters” in upstate New York have been a lot milder and a whole lot less “snowier” during the past 37+- years. But many places have gotten “hammered” with heavy snowfalls this winter of 2018.
Ice skating anyone? 😂😁
Very cold in UP of Michigan in January and first of February. There were freighters stuck in ice and needed coast guard cutter to get out. ice disrupted lives for many.
http://www.9and10news.com/2018/01/10/ice-buildup-halts-sugar-island-ferry/
Unusually cold winter in the Upper Midwest?
Not according to the fraudsters at NOAA, who say it is much warmer than usual.
https://www.ncdc.noaa.gov/cag/time-series/us/102/0/tavg/1/1/1895-2018?base_prd=true&firstbaseyear=1901&lastbaseyear=2000
Is it not about time we called out these shysters?
It is almost unbelievable how stories are being twisted these days, both in regards to AGW and the current media/political war in the US. For example, after Mueller’s team announced the arrest warrants for 13 Russians this last week the left leaning news sites immediately spun the story that here was proof of Russian meddling in the election, and then the story mentioned that to this day Trump has refused to state that the Russians interfered with the election. All of that is deception/lies. Yet every major lefty news source is running similar story lines. They are relentless in their deception even though the deception has become obvious to even the most casual observer.
So how would you spin the indictments of 13 Russians for “supporting the presidential campaign of then-candidate Donald J Trump … and disparaging Hillary Clinton”? I don’t
think there is any doubt that Russians interfered in the 2016 election and did so in order to try and get Donald Trump elected. Which is very different from saying that the Trump campaign colluded with the Russians.
It is now being stated by the vp of Facebook that the Russian propaganda on FB was not aimed at the election, but was instead aimed at driving a wedge between Americans in general. So where is your evidence for your claim now that FB has made this statement?.
Germinio,
There is a quote attributed to Abraham Lincoln, “Better to remain silent and be thought a fool than to speak out and remove all doubt.”
Maybe you should actually read the whole indictment yourself rather than parrot your liberal talking points. HINT: They didn’t care who won, they just wanted to sow confusion and chaos. HINT: They organized both pro-Trump/anti-Pantsuit, and pro-Pantsuit/anti-Trump rallies, sometimes on the same day.
Germinio,
Oh, and HINT the third. They specifically stated that no American, INCLUDING anyone in the Trump campaign, wittingly or knowingly colluded with the Russians. Kinda takes the wind out of your sails, doesn’t it.
I thought not.
(from an Oz observer)
The US media seem to think US elections are sacrosanct but not others. A very quick search reports:
http://thehill.com/blogs/blog-briefing-room/news/374372-ex-cia-director-us-meddles-in-foreign-elections-for-a-good
https://www.nytimes.com/2018/02/17/sunday-review/russia-isnt-the-only-one-meddling-in-elections-we-do-it-too.html
https://en.wikipedia.org/wiki/CIA_activities_in_Italy
https://www.washingtonpost.com/news/worldviews/wp/2016/10/13/the-long-history-of-the-u-s-interfering-with-elections-elsewhere/?utm_term=.1e22c6e8d691
http://www.huffingtonpost.com.au/entry/the-us-has-been-meddling-in-other-countries-elections-for-a-century-it-doesnt-feel-good_us_57983b85e4b02d5d5ed382bd
So how would you spin the indictments of 13 Russians for “supporting the presidential campaign of then-candidate Donald J Trump…..no need to spin it like you just tried to do
Intelligent people have read the whole news….and know they were playing both sides against the middle
The fact is, the person in the deepest trouble for conspiring with the Russians, works for the DNC.
But of course it’s Trump that being hounded over this.
Let’s not forget Obama lecturing both British and Israeli voters on how they were supposed to vote.
Trump says the Trump/Russia collusion story is a ho@x.
The Leftwing News Media misconstrues this to mean Trump is saying Russian interference in the election was a ho@x.
Trump doesn’t say the Russians did not interfere, he says they didn’t sway the election.
And he’s right. Really, how much can a bunch of Russian trolls and a few advertisements have on the American public? Not much, imo.
Organizing rallies might have a little more effect, but the Russians only organized a very few rallies, so they had minimum effect on how Americans voted.
The Russians ran an advertisement that said essentially that “Hillary was Satan and don’t vote for her”. Now how many potential Hillary voters do you think would change their vote because of an ad like that? None, I would say. Hillary’s supporters would just blow the ad off as a bunch or rightwing propaganda and smear and pay no attention to it.
The Russians made efforts to appear to help Trump, Hillary, Bernie Sanders and the Green candidate, Jill Stein.
The Russians organized several rallies both in favor and against Trump and Hillary. After Trump was elected, the Russians organized a pro-Trump rally and an anti-Trump rally for the same day. The Russians objective was to sow discord among Americans of all political affiliations and they succeeded quite well with the help of the American Leftwing News Media and the Democrats.
The Leftwing News Media and the Left have served as Russia’s useful idiots by buying into the Russian propaganda and then causing huge disruptions in our election process and governing processes. And they are still doing it to this very day.
I noticed in the Mueller indictment that with regard to the organizing of a Trump rally, the indictment referred to “Campaign Official 2” which referred to a Trump supporter who had been contacted by the Russians to help organize a Trump rally.
Hillary also had at least one rally staged on her behalf by the Russians, but I don’t see any mention of a Hillary “Campaign Official 2” being contacted by the Russians. Was this an oversight? Or did the Russians not contact Hillary’s camp and instead did the rally all on their own? Judging by how they handled the Trump rallies, it would be logical to assume that the Russians were contacting Hillary campaign officals about them, too. But no mention of this in the indictment. Maybe this will be clarified later.
Lots of things will be clarified later. The Clinton Mafia may be going down this time along with a bunch of Obama administration officials. Mueller needs to include the Obama/Clinton/Russian collusion scandal in his investigation. If he doesn’t, the DOJ Inspector General probably will. Inspector General’s report coming soon.
The same people that will tell you 13 Russians swayed an election are the same ones that will tell you 15 million illegals voting won’t.
@ Germinio – February 18, 2018 at 3:17 pm
Germinio, only the “nurtured-from-birth” highly partisan proponents of the Democrat Party are sufficiently delusional too believe the above claim is a “truism”.
Now I ask you, Germinio, …… why in hell would the Russians launch a “political campaign” to prevent Hillary Clinton from being elected POTUS, …… when it was Hillary who “officially” authorized the sale of 20% of the US’s uranium “holdings” to the Russians?
The Russians are sure as ell NOT going to get that kind of treatment as long a Trump is POTUS.
GEEEZUS, iffen Hillary was POTUS she would be selling the Russians “nuclear missals” or anything else the Russians wanted, …….. as long as her and Bill received a 10% or 20% “broker fee” via the guise of a “donation” to their “tax free” retirement fund.
TA – February 18, 2018 at 7:07 pm
“HA”, your wishful thinking comment of: “may be going down this time” is little more than a “blue sky dream” that ain’t never going to happen.
It ain’t never going to happen because there are literally hundreds of people in the DC Swamp that are directly associated with the per se ….. Clinton-Obama Mafia, and therefor they will keep the investigations going for at least the next 3 years, or 7 years, in hopes that the Democrats will regain control of the DC Swamp so that they can pardon or forgive everyone of any wrongdoings.
Worse case, a couple janitors might be fired and/or a couple aides given 6 months home confinement.
UAH TLT satellite data pretty much supports the surface sets re US temperatures in January. Compare GISS and UAH (both set to 1981-2010 base);-

USA lower 48 states were 0.55oC above average in January according to UAH.
They are not measuring the same thing.
One is measuring the Warmth leaving Earth and hardly ever relates to what we experience on the surface.
If you think they look alike you must be colour blind.
A C Osborn
They’re not measuring the same thing, but usually there’s a reasonable spatial correspondence between surface and LT temperatures for any given month. January warm and cool anomalies in the GISS surface chart are in more or less the same locations globally as in the UAH TLT chart.
In the case of the US, UAH clearly shows the same broad pattern as GISS. Anomalous warmth in the west; anomalous cooling in the east. A narrow band of ‘average’ temperatures across the middle.
Both surface and satellite data sets agree that the lower 48 states were, on average, slightly warmer than average in January.
GISS, for comparison.
Another “Unusually Cold Winter.” How many Unusually Cold winters with heavy Ice does it take to become unusual to the CO2 is the only cause of the global warming group or worse yet become the Normal?
well New Zealand just had the warmest month ever recorded and by a massive 0.7 degrees. So the unusual cold is localised. So you cann’t tell anything about global trends from localised events.
Maybe in the north, but certainly not in the south end of NZ, …https://earth.nullschool.net/#current/wind/surface/level/overlay=temp/orthographic=180.17,-45.73,672/loc=169.243,-45.463
Hi Goldminor,
I am not sure how stating what the temperature is on the 19th of February bares
any relevance to what the average temperature was in January.
Last I checked, its summer in the Southern Hemisphere and new Zealand.
This article is about winter temps and frozen lakes. What exactly is your point? I thought “so called” regional trends like the MWP and the RWP were frowned upon by the Warmist Left.
Hypocrite much?
@ Germinio…true enough. I should have stated that differently. There has certainly been a change in the higher latitudes of the SH since then. Note how cool Tasmania, South Africa, parts of Australia, and South Africa are, and this is the peak of their summer. Also, it looks to me as if the southern ocean has cooled a good bit.
Reg,
the point is that while it might be unusually cold in parts of the northern hemisphere it is also unusually warm in parts of the southern hemisphere. So you can’t saw anything about global temperatures or trends from a localised weather report.
@ Germinio…point to where the unusual warmth is in the SH?
“Germinio February 18, 2018 at 2:26 pm”
When I decided to migrate to NZ in 1995 they were in the midst of one of the coldest winters on record where many thousands of livestock animals literally froze to death. But then you have to realise there are less than 10 devices (IIRC I think it is only 7, maybe less) used to calculate an average for the whole of NZ.
Then what good are global trends. No one lives in a “global climate”. They live in local weather/climate. If we can’t predict local, it’s worthless.
Germinio is right and should not be shouted down IMO. Jan 2018 in NZ was an all time record high. I poured through a number of station records to check the reports. There are many more than just 7 if one cares to look.
Where did this heat come from?: a very warm SST anomaly in the Tasman Sea. A look at current global SS anomalies shows that this pocket is now dispersing rapidly. Meantime a very large cold anomaly is expanding in the equatorial Eastern Pacific. It dwarfs the Tasman Sea warm. Local weather is interesting but no much use in the overall topic.
Regards
M
I suggest that you take a look the posts on IceAgeNow to see where some of the SH was or is cold.
Brazil was the last place to be hit by extreme cold for their summer time.
https://www.iceagenow.info/exceptional-cold-brazil-large-rice-plantation-losses-feared/
How about Taiwan.
https://www.iceagenow.info/frigid-temperatures-kill-53-taiwan/
Areas of Australia were very cold as well, but you will not find any of that in the MSM
https://www.iceagenow.info/melbourne-shivers-summer-cold-snap/
Funny that New Zealand is so hot and yet their Glaciers have been growing.
https://www.iceagenow.info/trying-explain-new-zealands-unusual-growing-glaciers/
How about heavy hail in Suadi?
https://www.iceagenow.info/cold-coating-streets-saudi-arabia/
“Michael Carter February 18, 2018 at 10:31 pm
There are many more than just 7 if one cares to look.”
Yes, correct, there are more than 7 however, I said 7 or less are used to calculate an average for the whole of NZ. Similarly, 112 are used to calculate the average for Australia.
Although NOAA has satellite images of the Great Lakes, Environment Canada and its Ice Products displays Great Lakes ice in color code, free of clouds and snow cover. If you want to dig deeper, also displayed are the Ice Egg Codes where ice extent, character and flow also available providing a more complete image of the complexities of ice, its formation and whereabouts. It seems that Sunday February 12 was the most extensive Great Lakes Ice cover at 70%.
There appears to be a warmup coming for this week so ice cover will change and then…who knows.
I have started following the weather forecasting site Windy.com
The 5 day forecast is given for any point you choose from the worldwide map.
Yes, that is a very interesting site to play with. Shows much more than just wind speeds.
I am studying the Christianization of Scandinavia and the Norse cosmology (as they did not have a formal religion). The apocalypse of Ragnarok follows three winters without intervening summers.
…..’Christianization of Scandinavia ‘… – Good luck with that (it’s worse than they thought!) 😉
There has been intense cold around the Hudson bay area for awhile now. But above that general area the upper atmosphere at10 hPa has been very warm. So it looks like there has been a mayor exchange of heat between the upper and lower atmosphere over that area.
Gentlemen: I found this website with degree days that probably has not been tampered with??
Do you think it has any help in creating a valid historical temperature profile?
http://www.weatherdatadepot.com/faq#noaa
Thank you X 100.
I found that data about 15 years ago and said this would be great for comparing several cities (enough to meet good statistical sampling guidance) and plotting what has happened over the years available and then compare with the stuff published today. When I retired I could not find it again, have spent the last 8 years looking for it. Also could not find any government sites that went further back that about 1955.
Too bad you didn’t get those pics earlier. This is not the maximum extent of ice for Eerie this year. That happened in early January. The whole great lakes maxed out at 70% so far this year – today it is only 47%. Maximum ice extent is on average March 5 – so we have a few more weeks to see if it can go higher.
“unusual” weather is usual, where I live. Getting “usual” weather would be very unusual.
Is that different around Great Lakes? I suspect not.
High point of ice coverage of the Great Lakes this year so far is 69.1% which was about a week ago — I’ve been watching.
Daffodils blooming later than usual in South Carolina…whatever usual is…
Migrating Robins have been returning earlier than usual this year to central West Virginia, whatever usual is.
We need to move the polar bears to Lake Erie, RIGHT NOW, BEFORE IT’S TOO LATE !!!
And grab the penguins while you’re at it.
That headline is all wrong, over here in Blighty the media get it right every time now, The Daily Mail today claims :-
“sudden stratospheric warming means subzero temperatures”
both words in one sound bite,
sort of George Orwell on steriods
Look at this. The middle of the day in South America, in the middle of the summer. Where is the heat from global warming? …https://earth.nullschool.net/#current/wind/surface/level/overlay=temp/orthographic=298.11,-23.23,672/loc=-68.805,-41.139
It isn’t just on that continent either. Check out Africa during their daylight hours. Then spin the globe. Where is the signature of global warming to be found? Switch to oceans. Where are the high temp sst areas of yesteryear that would hang around Baja, Mexico, the equatorial islands in the western Pacific, or in other ocean locations? Currently there is only a smallish area north of Australia and points to the east. Several years ago high ocean temps would have stretched from Indonesia eastward out into the Pacific, and from aropund Los Angeles to below the tip of Baja California. …https://earth.nullschool.net/#current/ocean/primary/waves/overlay=sea_surface_temp/orthographic=138.74,-4.93,672/loc=132.075,-6.346
Hi Goldminor,
Tip for posting links to earth.nullschool.net
The default time setting is #current so the chart will change.
You can fix this to a set time by opening the earth button on the map.
On the Control line use the option button to set the required time.
This will then give you a fixed time URL to post. eg #2018/02/18/1500Z.
Even when you think you’ve got WordPress sussed, it hits you with another glitch.
The time toggle buttons <- and -> got suppressed.
Sigh.
Thanks much for that.
Does anyone know of equivalent ice coverage data for the Delaware River? Historical data shows the fitting out of frigates built in Philadelphia was delayed by ice in the late 1790s. I’d like to know if that has been typical in modern times.
Related stories, but closeby.
Cornelius Vanderbilt earned his transportation “captain” stripes the head way. He began by running a ferry from Staten Island across the Hudson River to New York (manhattan Island). In winter, his ferry was the only one considered reliable enough to get people across the Hudson when it froze over. That was early 1800’s (1810-1820), just 150 years from the depths of the Little Ice Age.
Now, 350 years from the Little Ice Age bottom, you can see how we are “naturally” warmer by stories like this. It was warming then without CO2’s “control”, and it is warmer now – without CO2 absolute control.
Has the CO2 man released increased temperatures higher than what they would have been naturally rising the past 200 years from Vanderbilt’s ice-filled Hudson River? We cannot tell – the difference is too small to measure.
Another related story, but remotely.
It was in the month of January in mid-1970s that 5 of us flew down to Tangiers Island in the Chesapeake Bay for a 3-day “weekend” of duck hunting. But no one got a shot, nor killed any ducks, …. because the Chesapeake Bay was frozen over and all boats were stranded at their docks.
Oh well, we played pool, drank a lot of beer and ate a lot of oysters while waiting for our charter plane to come back and get us.
I’m tracking daily temps in my area (NE IL, west of Lake Michigan), have been for several years. I also track humidity levels, something that is important but seems to escape most people. Why is it important? Simple: lower humidity indoors means higher possibility of getting zapped by a metal doorknob in the winter. Higher humidity means a higher likelihood of heavy precipitation (snow, ice) in the winter. It can also mean more cloud cover, which blocks the sun in the winter. It may seem like a non-issue, but it does make a difference. Higher humidity: foggy weather more often.
We seem to be having a “normal” winter, whatever that is (snow, mid-season chinook, more snow, cold temps followed by warmer temps), so I’m not complaining. It was nasty and bitter cold in the beginning, but last winter (2016 – 2017) was too warm, no real snow to speak of after December 31, and mostly cloudy days. This winter has given us more sunny days, which means I can leave the blinds open on the south side of the house and let my windows acts as solar heat collectors. Saves a lot on my gas bill.
If this is the way the cycle is going, then next winter will be snowier and I will have to make sure I stock the pantry and freezer even more carefully. I simply cannot do without cheesecake!
Being well stocked with food is essential in winter when blizzards and unsafe roads are the norms. Be certain you have lots of fuel for your generator as well. In case your electricity is knocked out and you need to keep that freezer working.
If the electricity goes out in a blizzard, we just put the freezer contents on the porch, where it’s at or below freezing. Summer is a problem, winter is not.
So, anyway, I was looking at Google Earth. There was ice in Greenland, along the Arctic rims, so to speak, all over Antarctica. But the Arctic Ocean was absolutely blue. If white is ice, the Arctic didn’t have enough to fix a Manhattan.
Does blue mean ice or something? I couldn’t find a date on the pic, either. I was motivated to do this by a lecture at the San Diego zoo about Arctic ice and the poor polar bears.
[Instead of GoogleEarth, check the Sea Ice Page links on this website. There are several varieties and formats of Arctic Sea Ice area charts and map-images that are kept up-to-date by various national laboratories. .mod]
Right Now (8:00 pm EST) they are predicting 67°F in Cleveland on Wednesday. My guess is that the warm Weather is caused by two Atlantic cyclones, one off Nova Scotia, and the other off Green land:
https://earth.nullschool.net/
The cyclones are 1. pumping energy into the stratosphere, and 2 draining energy from the Gulf and the Atlantic. I would guess a cool spring and a reduced tropical storm level in the fall.
Right Now, on Monday 02-19-18, @ 1:10 pm EST, with slightly overcast skies, my outdoor thermometer in central West Virginia is showing 72F with a few more hours to go …. and the meteorologist(s) are predicting 75F for tomorrow.
It is a most beautiful sound …… when I can’t hear my NG furnace cycling On and Off for several hours at a time in mid-February.
Here is another interesting change of some consequence in the middle of the North Pacific, surface winds running south from the Aleutians Islands towards the Equator. This weather feature has been running for around 8 days, and the effects of that are becoming more apparent, …https://earth.nullschool.net/#current/wind/surface/level/overlay=total_precipitable_water/orthographic=-171.88,36.95,672/loc=-169.900,22.096
Let me ask a question. Is the large circulation feature below (marked with an “X” at the center) the “Polar Vortex”?
https://earth.nullschool.net/#current/wind/isobaric/70hPa/orthographic=-108.03,70.43,247/loc=-95.041,63.675
marked with an “O” at the center. Sorry about that.
TA
Yes.
https://earth.nullschool.net/#2018/02/18/2100Z/wind/isobaric/70hPa/orthographic=-108.03,70.43,247/loc=-95.041,63.675
Check out the current ground weather conditions in Manitoba on Windy.com
(I don’t know how to time fix this one).
Thanks for that reply, Philip.
I love the nullschool website! Windy.com looks interesting, too.
Here is what forms the cold zones. For example, the cold has moved into the west including here where I live in Northern California. Note the position of the jet stream which forms the boundary line between warm or cold. …https://earth.nullschool.net/#current/wind/isobaric/250hPa/orthographic=-108.95,71.40,407/loc=-112.552,51.202
Hi goldminor,
Earth’s climate runs in two separate and completely natural modes. These are the meridional mode in which the temperate winds of the Ferrel Cell run strongly east-west, this stores heat causing global warming and the zonal mode in which the temperate winds of the Ferrel Cell run more strongly north-south; this transports moist air to the arctic giving greater winter snowfalls and global cooling. Each phase lasts for 30 years. The climate has now changed to zonal global cooling. I suggest you plan for this over the coming years.
https://earth.nullschool.net/#2018/02/18/1800Z/wind/surface/level/overlay=total_precipitable_water/orthographic=-171.88,36.95,672/loc=-169.900,22.096
Correction.
Earth’s climate runs in two separate and completely natural modes. These are the
meridional modezonal mode in which the temperate winds of the Ferrel Cell run strongly east-west, this stores heat causing global warming and thezonal modemeridional mode in which the temperate winds of the Ferrel Cell run more strongly north-south; this transports moist air to the arctic giving greater winter snowfalls and global cooling. Each phase lasts for 30 years. The climate has changed tozonalmeridional global cooling.Time I gave up.
east-westwest to east & also east to west.north-southsouth to north and also north to south.I hope this is better explanation:
The shape of the gyre changes from elongated along the zones of latitude to elongated along the meridians of longitude.
That is the nice part about living not far from the Pacific. It moderates the worst of the cold. Last years very wet winter was all about west to east water transport. I was surprised at the swift change which took place in August of last year. That shut off the flow through the middle latitudes. Almost all of the storms over the last 4+ months have landed somewhere between Washington St and Alaska. I have daily saved screenshots of Tpw and Tcw centered off of the coast of Northern California. Earthnullschool has been a great learning tool for me, especially in tandem with reading related material.
StandupPhilosopher February 18, 2018 at 7:22 pm
The same people that will tell you 13 Russians swayed an election are the same ones that will tell you 15 million illegals voting won’t.
15 million ?
What’s the source of 15M?
Some sources claim 3 million, because there was a gap of 2.86 million between Hillary and Donald. If all 3 M voted for Hillary, then one can argue Donald actually would have won the “popular” vote.
Who cares?
The election, like the World Series of Baseball, has rules.
For example, in 1960 the Pirates won, the NY team scored the most runs. Not even close.
Trump won – by the rules.
No one knows how many people, dead or alive, voted that should not have.
Not that I disagree with the statement, just the 15.
Further, this has nothing to do with cold winters and ice on the Great Lakes.
Of interest to some: Great Falls, MT is expected to be -24°F. Monday night (Tues, AM). That might freeze anything not already solid.
Absolutely accurate to say:
There are between 15 and 30 million illegal aliens in the country. (Nobody wants to know how many.)
Some of them voted (against Trump, for Hillary) because they feared Trump’s victory. (Nobody knows how many voted illegally. More than 13 though.)
Some people voted more than once, illegally. (Nobody knows how many. Most are suspected to have voted for Hillary.)
Some dead people voted, illegally. (Nobody knows how many. Most are suspected to have voted for Hillary.)
Some dead people voted more than once, illegally. (Nobody knows how many. Most are suspected to have voted for Hillary.)
I agree 100%, RACookPE1978, …… your above comments were 100% correct.
The Democrat Politicians and their partisan supporters are the first to claim that there is not and never has been any “illegal votes” cast in any General Election ……. EXCEPT FOR WHEN a Democrat Candidate fails to get elected to the Office he/she was “running for”, then they are the first to scream that “illegal votes” were cast and often demand a re-certification and/or recount.
Not many convictions on illegal voting, here’s a recent one:
https://www.nytimes.com/2017/02/10/us/illegal-voting-gets-texas-woman-8-years-in-prison-and-certain-deportation.html
She was a permanent resident though not an illegal alien, 8 years seems an excessive sentence.
Interestingly she was a registered republican and one of her illegal votes was for the AG who prosecuted her!
This story had it at 69%
https://www.wxyz.com/news/stunning-photo-shows-total-great-lakes-ice-cover-at-69-percent
(WXYZ) – With Michigan’s winter in full swing, the Great Lakes are seeing higher than average ice cover when compared to the average ice concentration of the last 44 years.
According to the NOAA’s Great Lakes Environmental Research Laboratory (GLERL), the total Great Lakes ice cover as of Monday is at 69 percent.
A stunning photo from NASA’s polar-orbiting Terra satellite shows the entire Great Lakes and their respective ice coverage. It’s most visible on Lake Erie, which is leading the five Great Lakes with 92 percent ice coverage.
Lake Huron has 81 percent ice coverage, followed by Lake Superior at 77 percent, Lake Michigan at 49 percent and Lake Ontario at 14 percent.
Also, for Lake St. Clair, it was at 99.48 percent ice coverage as of Feb. 10, as you can see in the photo above.
Doesn’t look like the Ice Road Truckers will be driving across Lake Michigan, from Ludington MI to Manitowoc WI this year!
JMac, just wait a while, Joe Bastardi says winter will be long this year…..Brett
Brett,
There is a ‘3 season’ ferry that runs between Ludington MI and Manitowoc WI, but not in the winter. I don’t know of anyone ever crossing the ice between Ludington and Manitowoc because most winters Lake Michigan is not 100% ice covered to a thickness that is safe for travel (even on foot or snow machine) between these 2 cities. Wind shifting ice floes freeze into VERY rough ice sheets, with jagged broken and refrozen ice and pressure ridges 6′ high in some areas and open water leads in others. Also, Lake Michigan is 110 miles wide between these 2 cities!
This winter is fairly ‘normal’ for Wisconsin and Michigan. It will take a brutally cold stretch from here through the end of March to produce 100% ice coverage on Lake Michigan. When the Ice Road Truckers begin driving across the ice between these 2 cities, they’ll also be having ‘Frost Fairs’ on the frozen Thames in London again!
Speaking about Manitowoc, Is lake manitoba frozen? Does usually freeze over during the winter?
Uderra,
I was referring to Manitowoc Wisconsin. There is no Lake Manitoba in Manitowoc county WI. Are you talking about Lake Manitoba in Manitoba Canada? Lake Winnipeg (just east of Lake Manitoba) is reporting ice thickness of 18″ – 24″ and the fishing for LARGE walleye is very good!
There’s a deep polar plunge on the west coast right now. It will move east. Look for big chill.
http://www.eldoradocountyweather.com/satellite/ssec/conus-us-composite/xlarge/conus-color-composite-xlarge.php
Europe is just days (by or before this Friday) away from a lesser, but if the weather models are to be believed (GEM, GFS and ECWMF), very cold spell hitting Europe, and lasting perhaps till the first week of March.
E.g. A snapshot of Sunday’s temperatures 2m above the ground …
http://www.wetterzentrale.de/maps/GFSOPEU12_132_5.png
More detailed ice maps are available from NOAA. Bookmark the image URLs, and you can check them daily. They are only available during the ice season. Note that WordPress does some weird caching, so you’re better off viewing the images directly from your browser.


