As the sun gets successively more blank with each day, due to lack of sunspots, it is also dimming. According to data from NASA’s Spaceweather, so far in 2017, 96 days (27%) of the days observing the sun have been without sunspots. Here is the view today from the NASA Solar Dynamics Observatory satellite:

Today at Cape Canaveral, SpaceX launched a new sensor to the International Space Station named TSIS-1. Its mission: to measure the dimming of the sun’s irradiance. It will replace the aging SORCE spacecraft. NASA SDO reports that as the sunspot cycle plunges toward its 11-year minimum, NASA satellites are tracking a decline in total solar irradiance (TSI).
Across the entire electromagnetic spectrum, the sun’s output has dropped nearly 0.1% compared to the Solar Maximum of 2012-2014. This plot shows the TSI since 1978 as observed from nine previous satellites:

In the top plot, we drew the daily average of measured points in red (so there are a lot of points, 14187 to be precise). On the left is a red vertical bar showing a 0.3% change in TSI. The black curve is the average of TSI over each year. The dashed horizontal line shows the minimum value of year-averaged TSI data. The vertical black bar shows the 0.09% variation we see in that average. The bottom plot shows the annual sunspot number from the SIDC in Belgium in blue. Source: NASA Solar Dynamics Observatory Mission Blog.
What do we learn from these plots? First, TSI does change! That’s why we stopped calling it the solar constant. Second, as the sunspot number increases, so does TSI. But the converse is also true. As the sunspot number decreases so does TSI. We have watched this happen for four sunspot cycles. This waxing and waning of TSI with sunspot number is understood as a combination of dark sunspots reducing TSI below the dashed line and long-lived magnetic features increasing TSI. SORCE has even observed flares in TSI.
Third, the horizontal dashed line is not an average, it is drawn at the lowest value in the year-averaged TSI data (that happened in 2009). When there are no sunspots the Sun’s brightness should be that of the hot, glowing object we always imagined it to be. We would expect TSI to be the same at every solar minimum. There is much discussion over whether the value of TSI at solar minimum is getting smaller with time, but it is not getting larger.
These data show us that the Sun is not getting brighter with time. The brightness does follow the sunspot cycle, but the level of solar activity has been decreasing the last 35 years. The value at minimum may be decreasing as well, although that is far more difficult to prove. Perhaps the upcoming solar minimum in 2020 will help answer that question.
The rise and fall of the sun’s luminosity is a natural part of the solar cycle. A change of 0.1% may not sound like much, but the sun deposits a lot of energy on the Earth, approximately 1,361 watts per square meter. Summed over the globe, a 0.1% variation in this quantity exceeds all of our planet’s other energy sources (such as natural radioactivity in Earth’s core) combined. A 2013 report issued by the National Research Council (NRC), “The Effects of Solar Variability on Earth’s Climate,” spells out some of the ways the cyclic change in TSI can affect the chemistry of Earth’s upper atmosphere and possibly alter regional weather patterns, especially in the Pacific.
NASA’s current flagship satellite for measuring TSI, the Solar Radiation and Climate Experiment (SORCE), is now more than six years beyond its prime-mission lifetime. TSIS-1 will take over for SORCE, extending the record of TSI measurements with unprecedented precision. It’s five-year mission will overlap a deep Solar Minimum expected in 2019-2020. TSIS-1 will therefore be able to observe the continued decline in the sun’s luminosity followed by a rebound as the next solar cycle picks up steam. Installing and checking out TSIS-1 will take some time; the first science data are expected in Feb. 2018.
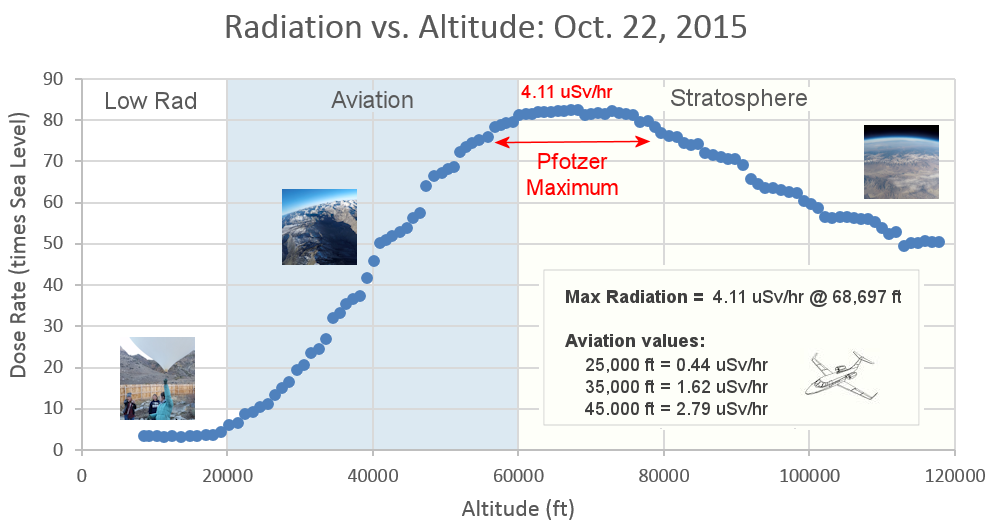
In other news, as the magnetic activity of the sun decreases, influx of Galactic Cosmic Rays (GCR’s) increase as has been observed by balloon measurements over California:

Why are cosmic rays intensifying? The main reason is the sun. Solar storm clouds such as coronal mass ejections (CMEs) sweep aside cosmic rays when they pass by Earth. During Solar Maximum, CMEs are abundant and cosmic rays are held at bay. Now, however, the solar cycle is swinging toward Solar Minimum, allowing cosmic rays to return. Another reason could be the weakening of Earth’s magnetic field, which helps protect us from deep-space radiation.
The radiation sensors onboard our helium balloons detect X-rays and gamma-rays in the energy range 10 keV to 20 MeV. These energies span the range of medical X-ray machines and airport security scanners.
The data points in the graph above correspond to the peak of the Reneger-Pfotzer maximum, which lies about 67,000 feet above central California. When cosmic rays crash into Earth’s atmosphere, they produce a spray of secondary particles that is most intense at the entrance to the stratosphere. Physicists Eric Reneger and Georg Pfotzer discovered the maximum using balloons in the 1930s and it is what we are measuring today.
NASA’s spaceweather.com website follows the progress of the sun on a regular basis. Our WUWT Solar Reference Page also has data updated daily.
It’s going to get colder for the next 30 years. And ironically, that will hurt us a lot more as we wind up sporadic renewables, and wind down coal and try and limit or make so expensive other fossil fuels that we will be in double jeopardy. The coming revolution’s all over the planet will make the French Revolution look a like a congenial ‘tea party’. Buckle up…cause things generally never end well after such a good run. Especially after having been lied to and cheated by charlatans of science.
That’s odd.
A number of years ago, I was talking to a “senior climate scientist” (yes, he was introduced that way) who informed me, angrily, that “insolation is a constant” when I mentioned insolation variance as a possible contributing factor to global warming…
And if I understand it… “more cosmic rays ≡ more ion channels thru upper atmosphere” which in turn is thought (like the old 1940s “bubble chamber” atom-smashing detectors) to produce more and thicker clouds in super-saturated air.
Which in turn reflects more sunlight back toward space. Which, besides lowered INsolation, further cools the planet.
Right?
Wow! It’s a good thing that the SUN has nothing to do with Global Warming and/or Cooling (as I have been taught by climate scientists … top scientists … really … top … people. Top. People. Therefore who cares what the SUN is doing ? Everyone should just focus on their own SINS that are “killing our planet”. The science is settled. You are a SINNER!!!!
It would be interesting to know how different wavelengths have been affected. It is my understanding that while total solar radiation changes by less than 1% UV can change by several 100%.
Obviously UV can’t fall by several 100%. Just getting in before someone picks up on that.
Curious. We were told that the 2009 minimum was “as low as it gets,” and that the Maunder Minimum was likely not lower than that. It seems that hypothesis might not last one solar cycle.
Next we will be told that the 2020 minimum is “as low as it gets,” and that the Maunder Minimum was likely not lower than that.
And WUWT is there first, proposing a name for the next minimum:
https://wattsupwiththat.com/2009/06/13/online-petition-the-next-solar-minimum-should-be-called-the-eddy-minimum/
“The rise and fall of the sun’s luminosity is a natural part of the solar cycle. A change of 0.1% may not sound like much, but the sun deposits a lot of energy on the Earth, approximately 1,361 watts per square meter.”
Seems like a 0.1% might be smaller than our ability to accurately measure it. 0.1% is 1.361 watts. What is the time frame for watts/sq m? A second, minute, hour, day, month, year? If it’s a second, it’s a bigger deal than if it’s a year. The TSI is measured by satellites, do the number and density of cloud cover affect the total energy that hits the ground?
There’s accuracy and then there’s precision.
I said on this site sometime around 2009-2010 that solar cycle 24 will reach its solar minimum by the end of 2017 to the beginning of 2018, I wonder if Leif remembers? 😀
Solar cycle 24 will also have a slightly longer solar minimum than solar cycle 23.
Solar cycle 25 is going to be fun, due to the time period involved with this solar minimum, I expect something very interesting to occur. (any guesses as to what?)
Katphiche,
Its a lot less then 1.361W/m^2/s, because our planet is more like ball, therefore effective radiation which is entering the earth is 1.361W/m^2/s / 4 (clear because the sun dont shine all over every time) and then atmosphere is blocking arround 30-50% of the rest of radiation.
On Ground, its should be more to 150-200W/m^2/s, means if TSI change 1W/m^2/s, on Ground it would result in to a change to 0.12-0.15W/m^2/s
It’s probably not a progressive process, but there is no way to predict it. So, it is reasonable to assume that the sun will recover its character when the time is right, which will hopefully coincide with what is right for us.
New measuring device. Since it can’t be the Sun, if it gets colder, we were, are, and are going to be measuring it wrong. Wrong calibration, wrong corrections for orbital height, cosmic rays seeping into the equipment. When software failed, years ago, it was always cosmic rays. Who knew that they were right? but only during Solar minimums.
I need grant monies; there is going to be a lot of research needed…
“TSI does change! That’s why we stopped calling it the solar constant.”
Very few so-called physical constants are actually constant. Most notably in my line of work is the dielectric ‘constant’ which is really a function of frequency and temperature and varies strongly with both.
All I can say is the climate test is on. Very low solar colder ,versus increasing CO2 warmer. My bet is with solar.
Low solar equates to lower overall sea surface temperatures and a slightly higher albedo.
It is going to be very interesting going forward from here.
27% of this solar cycle has been spotless. A contextless factoid. It would have been nice to know how many days or what percent of the last 3 solar cycles had been spotless.
The interesting thing is how a small solar variation is apparently associated with a much larger change in GCR levels.
Bon voyage TSIS! I can’t wait for its first day of data. Nicely written article here.
The November v2 SSN average of 5.7 was the 3rd earliest & lowest value for all solar cycles #1-24, compared to 4 and 0, in cycles #11 & #2, after 103 and 105 months respectively, compared to this cycle now at 108 months. TSI is finally dropping again after bumping upward for a few months.
 ?dl=0
2006 is a good solar analog year for 2017, when in Oct that year F10 and SORCE were at similar levels for the first time in cycle #23 as very recently in this cycle #24, with F10.7cm flux under 70 sfu and SORCE TSI under 1360.7 W/m^2 for nearly a week. The solar minimum for SC#23 bottomed out 28 months after this, and I expect SC#24 will be similar, in line with the SWPC solar cycle progression forecast.
 ?dl=0
as the magnetic activity of the sun decreases,
There it is again. It seems like a common error to confuse issues?.
http://oi63.tinypic.com/2ef6xvo.jpg
clearly, you can see that higher solar activity is associated with lower solar magnetic field strengths?
so, note that since 2015 the solar magnetic filed strengths have been rising again,

[with corresponding decrease in SSN]
[with corresponding increase in stratospheric radiation]
That should change your story….
What a coincidence. Prospects for the Cult of Calamitous Climate are dimming as well.
There are suggestions, rather than direct evidence, that the sun’s cycles influence our climate. It seems to be a cumulative effect in that a series of quiet cycles cause cooling rather than a single very inactive cycle. There is no correlation between sunspot number and climate, but over many cycles there seems to be a reasonable matching of patterns, especially between clusters of quiet cycles and periods of climate cooling.
Solar interactions with the earth include TSI, within that, some UV variability and microwave flux. Then there are changes in magnetic field amplitude and the reversal of the field polarity each cycle. Another output is the solar wind with its high speed electrons, protons and alpha particles All of these are cyclical and the solar wind, in particular, modifies the cosmic rays reaching the earth and influences the neutron count. This last bit is the basis of Svensmark’s proposal for the solar effect on cloud seeding.
I believe that the solar cycles affect our climate but proof is lacking. But then, it may just be that we don’t understand the mechanism. It would seem that the most likely mechanism would involve cloud cover modulation. The most likely causes would be UV, solar wind, cosmic ray or cosmic dust influences on our atmosphere via physical or chemical processes.
Does this mean we’re going to have to build James Hansen’s single chlorofluorocarbon plant that will prevent another ice age?
Being a little challenged, I can only visualize things in Hiroshima’s. How many Hiroshima’s are represented by .1%?
I’m sorry, but a change in TSI of a tenth of one measly percent from peak to trough … like the song says, “That don’t impress me much!”
Per the CERES data, at the top of the atmosphere, that works out to about six/tenths of a watt per square metre (0.6 W/m2) highest to lowest. Compare that to say the difference in TOA TSI between January and June, when the sun is nearest and furthest from the sun. That difference is 22 W/m2 …
So yes, insolation does vary, but it’s what I call “A difference that doesn’t make any difference”.
w.
Dimming, eh? Anyone want to explain to me why it is impossible for our sun to be a long term variable star? It’s long seemed more plausible to me that glaciations are caused by variations in solar output than by GHGs and/or Milenkovitch cycles. It seems most improbable to me that sea level ice at the latitude of New York City (40N) could possibly persist through a Summer.even with a one degree lessening of axial tilt and any plausible decrease in average temperature.
To paraphrase Everett Dirksen– 0.1% and 0.1% there, pretty soon, you’re talking real cooling.