By Javier
In sharp contrast with previous decades, the past 10 years have seen no change in Northern Hemisphere average sea ice extent, according to MASIE (may-zee, Multi-sensor Analyzed Sea Ice Extent) database from the National Sea & Ice Data Center (NSIDC; see figure 1).

Figure 1. MASIE sea-ice extent data for the Northern Hemisphere showing essentially no trend for Arctic sea-ice for the past 11 years.
Based on fundamental climate observations and research it has been proposed by several scientists that the Arctic might have entered a new regime with its most conspicuous consequence a reduction or even inversion of recent Arctic sea ice trends. So far, the data appears to support their interpretation. They are Miles et al. 2014, Wyatt & Curry 2014, and Årthun et al. 2017 (references in the appendix).
Last October I presented some of the evidence at WUWT here.
Despite the complete failure of every Arctic ice-free prediction so far, and the research and evidence that the Arctic is no longer melting as in past decades, some climate alarmists are rabidly attacking this interpretation and those that hold it, including me. See the “Open Mind” post: Extreme Cherry Ice.
MASIE is a relatively new (November 2010) and improved dataset on sea-ice extent for the Northern Hemisphere with very good sea-ice boundary resolution. Sea-ice extent is the preferred measurement by NSIDC to study melting, since surface melting is known to cause sea-ice area measurements to underestimate the sea-ice surface. However, sea-ice extent is rapidly falling out of favor among sea-ice alarmists as an Arctic gauge, replaced by sea-ice volume that has the disadvantage of being modeled, but the advantage that it shows continuous decline, as the models include a temperature factor. Apparently, alarmists believe that Arctic sea-ice is transforming from a pancake into a crepe of the same size.
MASIE starts in 2006. I have determined the start and end dates of the melt season from 2006-2017 (11 complete years; see appendix). The data is presented in table 1.

Table 1. Start day defined as yearly maximum extent day (7-day smoothed). End day defined as yearly minimum extent day. Length is the difference between both in number of days. Extent change is the difference between maximum and minimun sea-ice extent.
The average start for the melt season was on day 68 (March 9 in common years). For the past 12 years there has been a trend towards an earlier start of the melt season, with 2015, and 2016 starting on day 59 (February 28). The trend is very pronounced at –9 days/decade (see figure 2). Stroeve et al. 2014 report a similar trend for 1979-2013 of –2 days/decade. If anything, the trend appears to have accentuated recently. In 2017 the melt season started on day 63 (March 4) as determined by this methodology, right on the trend.

Figure 2. Start of the melt season for the past 12 years showing a pronounced trend towards an earlier start of the melt season.
The average end for the melt season was on day 262 (September 19 in common years). For the past 11 years there has been a trend towards an earlier end of the melt season, with 2016 (leap year) ending on day 253 (September 9). The trend is very pronounced at –11 days/decade (see figure 3). Stroeve et al. 2014 report an opposite trend for 1979-2013 of +3 days/decade. There is a huge inversion of 2 weeks/decade in this trend. According to the trend and methodology, the 2017 melt season is projected to end on day 255 (September 12) ± 1 week.

Figure 3. End of the melt season for the past 11 years showing a pronounced trend towards an earlier end of the melt season.
The observed trends are not sustainable (or the melt period would eventually shift seasons) and probably form part of the observed Arctic regime shift. One possible explanation is that for the past decade winters have become warmer in the Arctic, while summers have become cooler. A good example is this year situation (see figure 4).

Figure 4. Daily mean temperature north of the 80th northern parallel, as a function of the day of year. Source DMI. The average melt season start and end days have been added.
The average melt season length, defined as the number of days from start to end of melt, is 193 days (52.5% of the year, winter is 4 days shorter than summer). For the past 11 years the melt season length has shown a non-significant decrease of –2 days/decade (see figure 5). This contrasts with Stroeve et al. 2014 who report a trend for 1979-2013 of +5 days/decade in melt season length. The evidence does not support the touted increase in melt season length for the past decade. According to the trend, the 2017 melt season is projected to last 192 ± 6 days.

Figure 5. Melt season length for the past 11 years showing no clear trend.
The average extent loss from start to end of the melt season is 10.6 million sq. km. For the past 11 years the extent loss has shown a non-significant increase of 0.65 million sq. km/decade (see figure 6). This trend is dependent on the very low value of the 2006 melt season loss, and shows no increase in surface lost during the melt season from 2007. 2017 started its melt season with a very low value of sea ice extent (14.7 million sq. km), almost as low as 2006 (14.6), and has seen below normal melting so far, so it is likely to end with one of the lowest sea-ice extent losses of the entire series.

Figure 6. Change in extent (sea-ice loss) from start to end day of the melt season for the past 11 years showing no clear trend.
The average sea-ice extent change during the melt season was plotted against the length of the melt season (see figure 7). No significant relation was found as the trend depends fully on two outliers, the very low melting of 2006 and the very high melting of 2012. It is clear that melt season length is not the main determinant of sea-ice extent decrease during the melt season.

Figure 7. Change in extent (sea-ice loss) during the melt season versus the length of the melt season for the past 11 years. No significant correlation is found.
It is important to notice that the analyzed period 2006-2017 includes 7 of the 10 hottest years recorded according to NOAA/NCEI, as reported by Climate Central (see figure 8). 2017 is trending to finish in 2nd-3rd place. The warmest decade in over a century, according to this database, coincides with a decade when no Arctic sea-ice melting has taken place. This demonstrates that global average surface temperatures cannot be the driving force behind Arctic melting, and regional ocean surface temperatures are likely to be more important.

Figure 8. The period analyzed, 2006-2017, includes most of the warmest years ever recorded, and can therefore be considered the warmest decade ever registered. The lack of ice melting demonstrates that global temperatures do not drive Arctic sea-ice melting.
In conclusion, the evidence indicates that for the past 10 years:
1. There has not been any significant Arctic sea-ice melting.
2. Both the melt season start and end have been taking place earlier.
3. The melt season length has not increased.
4. Sea-ice loss during the melt season has not increased.
5. Sea-ice loss during the melt season is not determined by season length or by the average global surface temperature, as claimed by the IPCC.
There is a stark difference between the results from the past 10 years and from earlier decades. This difference suggests a shift in the Arctic ice regime as proposed by Wyatt & Curry 2014 and Miles et al. 2014. The expectation from these authors and from Årthun et al. 2017 is that for the next decade(s) no significant Arctic sea-ice melting should be expected, and a significant increase in Arctic sea-ice is possible.
Appendix.
The MASIE database was downloaded from:
ftp://sidads.colorado.edu/DATASETS/NOAA/G02186/masie_4km_allyears_extent_sqkm.csv
on August 8, 2017.
The Northern Hemisphere data was smoothed with a 7-day centered moving average to reduce daily variability.
Data was plotted with Excel.
Daily polar temperature graph was obtained from the Danish Meteorological Institute at:
http://ocean.dmi.dk/arctic/meant80n.uk.php
Bibliography:
Årthun, M., et al. 2017. “Skillful prediction of northern climate provided by the ocean.” Nature Communications, 8, ncomms15875.
https://www.nature.com/articles/ncomms15875
Miles, M.W., et al. 2014. “A signal of persistent Atlantic multidecadal variability in Arctic sea ice.” Geophys. Res. Lett., 41, 463–469.
http://onlinelibrary.wiley.com/doi/10.1002/2013GL058084/full
Stroeve, J.C., et al. 2014. “Changes in Arctic melt season and implications for sea ice loss.” Geophysical Research Letters, 41(4), 1216-1225. http://onlinelibrary.wiley.com/doi/10.1002/2013GL058951/full
Wyatt, M.G., and J.A. Curry. 2014. “Role for Eurasian Arctic shelf sea ice in a secularly varying hemispheric climate signal during the 20th century.” Climate dynamics 42.9-10: 2763-2782. http://cdn.cnsnews.com/documents/Curry,%20Wyatt%20paper.pdf
Discover more from Watts Up With That?
Subscribe to get the latest posts sent to your email.
The annual CAGW sea-ice publicity stunt is about to get underway, sailing from Alaska to the North Pole:
http://www.npr.org/2017/08/10/542547005/sailing-to-the-north-pole-thanks-to-global-warming
… or is it? So much doom-laden publicity has already been generated, much of it broadcast by the BBC, that they hardly need to bother leaving port. I don’t suppose that they intend to use the entire window of gaps in the ice to sail to somewhere near the Pole, get the eagerly desired publicity photo of a sailing ship there, then get stuck in order to prolong the publicity? Does Planet-Saving zealotry extend that far?
Scroll down in the following link to see the current ice extent near Alaska:
https://www.weather.gov/afc/ice
Or this one from Aug 10th,2017:
http://www.natice.noaa.gov/pub/ims/ims_gif/DATA/cursnow_alaska.gif
@climanrecon – from your NPR link:
“A crew plans to leave Nome, Alaska Thursday (Aug, 10th) and sail to the North Pole. The voyage may now be possible due to sea ice melt in the Arctic caused by climate change.”
It looks like they are in for some rough sailing through all that ice up to and including the North Pole…
One can only hope that they don’t get farther than the ice edge. If they try to go further north by following leads and fissures in the ice their yacht will most likely be crushed as soon as there is strong wind. I’ve seen what ice press can do.
You should match that with a concentration chart, showing that the above is a coloured in outline…
Look at this:
Looks a bit different, eh?
For all their despair over loss of sea ice, I’m betting they made sure that a U.S. or Canadian ice breaker is available on short notice.
Or this one, since a lot of ice seems to have sort of gotten lost in Griff’s map:
http://polarview.met.no/regs/general_20170812.png
Note that while the scale in Griffs version goes to zero, there oddly enough doesn’t seem to be any areas anywhere with less than about 25% ice, while the Norwegians have a lot of those.
“This difference suggests a shift in the Arctic ice regime ”
The difference may also suggest random variations.
And then there is this which I usually check daily (IMS-ICE):
http://www.natice.noaa.gov/ims/
Thanks Javier.
Area vs volume. Volume is useful for a trend, nothing more, area measurements have several uses.
Area ignores storm compacted ice events. Volume(somewhat accurate) would address that. Yes volume has a nice declining trend, but no biggy, a warming world cant do anything else.
The question as always is.. still, what causes the warming. They always try move on as if that question has been answered already.
Question. What is the total storm induced loss of sea ice area over the past 48 years in Antarctica and the arctic? 😀
If you cant answer that then area trends are pretty meaningless, Antarctic and arctic storms played a significant role in bringing ice trends down
From the article: “It is important to notice that the analyzed period 2006-2017 includes 7 of the 10 hottest years recorded according to NOAA/NCEI, as reported by Climate Central (see figure 8).”
No, the NOAA/NCEI data has been bastardized and specifically formulated to make it appear that each succeeding year is hotter than the last. But when you look at an accurate chart (satellite) of the Earth’s temperatures you will see that all the years between 1998 and 2015 were cooler than 1998, and 2016 was only one-tenth of a degree hotter than 1998, so claiming the period contains seven out of 10 “hottest” years, is a lie. And keep in mind that the 1930’s was hotter than 1998 and 2016, so the last few years are also-rans at best.
Here’s a real unbastardized chart to put the lie to the NOAA/NCEI lies:
http://www.drroyspencer.com/wp-content/uploads/UAH_LT_1979_thru_July_2017_v6.jpg
Hope this graph comes through: ?w=520&h=316&zoom=2
And this:
http://www.drroyspencer.com/wp-content/uploads/UAH-LT-El-Nino-year-rankings1.png
In UAH data, the ten warmest years, from hottest to least hot, were 2016, 1998, 2010, 2015, 2002, 2005, 2003, 2014, 2007 and 2013.
Thus, the past ten years of flat Arctic sea ice trend occurred despite six of those years being among the ten warmest in the UAH satellite record. Furthermore, 2012 was by far the lowest Arctic sea ice minimum, yet all the years since then have been hotter than 2012.
So, it appears that Javier’s observation is valid.
That’s funny! I can’t find the CO2 on that chart!
“Here’s a real unbastardized chart to put the lie to the NOAA/NCEI lies:”
Ah, right ….
Spot the “Version 6.0” in there?
Yup, GISS is a pack of lies.
The Earth is 4.5 BILLION years old. We have THIRTY-EIGHT years of satellite data.
See what I did there?
No.
Another example of willful blindness.
+10
Hey! They have to manipulate with what they’ve got!
And well over a 150 years of collated detailed ice records… see my post below
The so-called “collators” are, like all so-called “climate scientists”, professional prevaricators.
The lower rate of melting of arctic sea ice is occurring at the same time as we are having a lack of sunspot activity it maybe something that is happening like the contraction of the thermosphere.
also, when storms do break up ice sheets and compact them, sunlight goes straight into the surface waters which would otherwise be covered in sea ice, that happened last winter and the floes were large in late june. Ice breakers have been flat out, not even one to spare for a 17 million research jaunt
Mark,
A minor quibble: You said, “…sunlight goes straight into the surface waters…” Strictly speaking, that can only happen between the Tropics of Cancer and Capricorn for short periods of time. Most of the time that sunlight reaches the surface in the Arctic, the rays are far from perpendicular and the water has high reflectivity that can get as high as for snow.
Even at the height of summer, because of the low angle of the sun, the difference in the amount of light reflected from ice vs. water is hard to measure.
As the sun gets closer to the horizon, the difference becomes smaller.
The only difference less ice makes is that it’s easier for the water to lose heat to the atmosphere.
tty August 12, 2017 at 5:30 am
Not a lot of sunlight in the Arctic in winter. Not in Helsinki either as a matter of fact. But it is true that there was a huge growth in ice late in the last winter season:
Indeed there was because according to that graph there was no growth until January, whereas in the average year there would have been 400,000 km^2 of growth. In the next few months growth resumed and the coverage returned to average, what that does mean though is that the ice that did form would be thinner than in a normal year.
Not a lot of sunlight in the Arctic in winter. Not in Helsinki either as a matter of fact. But it is true that there was a huge growth in ice late in the last winter season:
http://polarview.met.no/Statistics/graphs/icechart_season_plot_latest.png
Thanks Javier for this important update on Arctic ice.
Both sides in the climate debate have been quiet on the subject recently. The warmists are disappointed at the death spiral of their death spiral. The ice won’t go away. And the skeptics having been burned by previous predictions of recovery are staying off the subject.
But Javier is right – the stasis of the ice in the last decade is an important story in its own right. It does indeed place a real question mark over the claims of warmest evah atmospheric temperatures. However oceanic processes arw slow and take a long time to turn around.
Arctic ice is a solid tangible index of climate status, unlike temperature measurements with their intractable problem of human contamination.
Nobody seems to have posted this chart. It shows quite clearly that sea ice extent for the decade has been constrained to a very narrow band:
http://www.natice.noaa.gov/ims/images/sea_ice_only.jpg
Except that little bit at the start when Griff was convinced that the end was nigh.
He was very vocal in his prediction that this year would shatter the record for low ice extent.
Now he’s convinced that the end is almost nigh.
Chris Mooney in WaPo authors an article headlined, “Even small boats are tackling the fabled Northwest Passage. The ice doesn’t always cooperate.” Mooney is up there waiting for a green light to go through the NW passage.
https://www.washingtonpost.com/news/energy-environment/wp/2017/08/09/we-wanted-to-be-early-northwest-passage-adventurers-held-back-by-lingering-ice/
From your link I find this an interesting quote:
“There’s far less ice cover on the Arctic in general in the summer months, but that doesn’t mean there’s zero — and it can turn up in different places.”
It seems to me that from that quote the uninformed would have no idea that the ice cover in the summer months is still generally around 4 MILLION square miles which is more than four times larger than Greenland and around the same as Europe and close to 7% of the Earths total land area.
And that’s at summer minimum!
I suppose that doesn’t make the minimum sound scary enough 🙂
Oh well, I wasn’t paying attention, km2 not miles, but still apparently good enough for climate science based on what Chris Mooney said 🙂
Around 4 Million km2 is hardly something to sniff at!!
tobyglyn August 11, 2017 at 10:47 pm
It seems to me that from that quote the uninformed would have no idea that the ice cover in the summer months is still generally around 4 MILLION square miles
Compared with the average during the 80’s of ~7 million km^2 or the average during the 2000’s of ~5.5.
https://ads.nipr.ac.jp/vishop/#/extent
If you want to draw any conclusions about Arctic sea ice trends, keep a couple of things in mind :
1. The satellite data begins in 1979, which happens to coincide with the end of the 1950 to 1978 cool period when sea was presumable at its maximum.
2. Decline in sea ice from 1979 to 2000 is not surprising since it coincides with the 1979 to 2000 warming.
3. Comparing extent of sea ice now (at the end of a warm period) with sea ice extent in 1979 at the end of a cool period) makes no sense at all. What should be compared is extent of sea ice now with the extent of sea ice at the end of the 1915 to 1950 warm period. Unfortunately, we don’t have good data for the earlier time period. We would also like to compare the sea ice extent in 1979 at the end of the 1950 cool period with the extent in 1915, the end of the 1880 to 1915 cool period. But again, we don’t have the data.
Until we can make these kinds of comparisons, conclusions about trends since 1979 don’t mean much.
Actually I think it would probably be possible to get fairly good data for at least the 1930-1950 period. There is quite a lot of Norwegian, Danish and Icelandic data for the North Atlantic sector, and a fair amount of Russian data for the Siberian sector from 1933 on (when regular traffic through the North-East passage started).
The difficult area is Canada, but the data almost certainly exists in RCMP and Hudson Bay Company archives if somebody could be bothered to look for it. For example in 1937 the HBC vessel Aklavik sailed from Cambridge Bay around King William Land, up the Peel Channel and through Bellot Strait into Prince Regent Inlet and then returned the same way to her home base in Cambridge Bay. Since this is the only really difficult part of the Nortwest Passage this means that in practical terms she passed through the passage both ways.
In the same way the partial gap 1940-45 in North Atlantic datasets could certainly be filled in from military archives.
DOE

Trouble is , that while 1955 was obviously much lower than the large increase that followed at the end of the 1970’s, it is unsure exactly what was being measured in this graph
You could tack the early satellite data on like this…
… but I’m not sure we can actually do that, because I suspect they are measuring different things. The DOE graph states “Arctic Ocean” (what is that?) while satellite data is for “Northern Hemisphere”
Actually there is very good Russian, Danish, US, Canadian, Royal Navy, US Navy (including subs under the ice), Alaskan, whaling fleet data right through into the 19th century.
see my post below to a link to this research
Don Easterbrook August 11, 2017 at 11:53 am
3. Comparing extent of sea ice now (at the end of a warm period) with sea ice extent in 1979 at the end of a cool period) makes no sense at all.
This statement is based on your unfounded assumption that we are at the end of a warm period
Don, Connolly, Connolly and Soon have a reconstruction of Arctic Sea Ice extent in their new paper in Hydrological Sciences Journal. The low point before 1979 was 1943. 1979 was fairly high by 20th century standards.
changing the rules when things run against you. And for this we are asked to accept the yoke. Not happening.
Javier, I suggest you read up on the defects of running averages as filters. They are notorious from inverting peaks and troughs in data and are the last thing you want when trying to look for turning points.
https://climategrog.wordpress.com/2013/05/19/triple-running-mean-filters/
This will introduce errors into both your start dates and end dates and will add unnecessary noise to the few points you have.
This article is excellent and informative, but If you’re trying to send a message, be sure to select the endpoints of your trendline with your message in mind. Anything is possible in a world governed by cycles. Let the reader beware.
There is extensive evidence that a north west passage has existed about 1000 years ago, if you track the movements and settlements of the Vikings. 5 centuries later people in Holland heard these Nordic stories of the existence of this passage and tried to establish if it existed.
Sadly the expedition of Willem Barentz ended in disaster.
If Javier is right, this time around there never will be a north west passage….?
Larsen passed through the NWP in 1944 in the wooden St Roch, and the SS Manhattan (oil tanker) followed roughly the same route in 1969.
That route is currently rather blocked.
“Painting Depicting the Meeting in the Northwest Passage of the RMS Nascopie and the HBC Aklavik by the Artist Thomas Harold Beament”
“There is a wonderful painting in the art collection of the Maritime Museum of British Columbia which depicts the historic meeting of the HBC schooner Aklavik with the RMS Nascopie at Fort Ross, Northwest Territories. In 1937 the Nascopie sailed from the Eastern Arctic to Prince Regent Inlet and into the Bellot Strait to allow the Hudson’s Bay Company to establish Fort Ross. While there she was met by the HBC schooner Aklavik which had sailed into Bellot Strait from the Western Arctic.”
http://www.nauticapedia.ca/Gallery/Aklavik_Nascopie_Painting.php
Richard,
Any idea of the route followed by these two vessls?
The brief history I can find seems to indicate the southern route through Bellot Strait and Cambridge Bay.
but it has been open every year for about the last decade, to all types of vessel without icebreaker assistance….
something markedly different from 20th century multi year, multi ice breaker passages on widely separated occasions…
and will very likely open again by September.
Yes, the RECOVERY from the extremes of the late 1970’s is a MASSIVE BENEFIT, isn’t it griff
Maybe they won’t need ice-breakers at some point in the distant future, and other countries won’t have to rely on Russia for safe passage.
Griffie, it was the small vessel in the picture that did the difficult part from Cambridge Bay to Fort Ross by way of King William Island, Peel passage and Bellot strait. That is the only part of the southern (shallow and narrow) route that has always been difficult, even in late summer, and still often is. For example it was there that the Franklin expedition got stuck.
By the way Aklavik was the first vessel to go through the Bellot Strait.
Same route as used by the MV Nunavik carrying nickel ore to China in september 2014.
There’s plenty of evidence of widespread whale hunting and fishing in the MWP in the Canadian Archipelago, as well.
Those days are long gone, made impossible by the massive increase in sea ice in the lead-up to the LIA.
Biodata clearly shows that current levels are only a little bit down from the extremes of the LIA, far higher than the MWP and that the first 3/4 of the current interglacial often had basically zero summer sea ice
Levels at the moment are actually ANMALOUSLY HIGH.
If you rotate the chart above 180 degrees , you will see how well it coincides with the GISP Greenland temperature data.
typo fix…. ANOMALOUSLY…..
Andy
Thx for your comments. Noted. Arctic ice must be compared on millennium time scale, really.
The Inuit did not invent whaling boats and kayaks nor travel all the way to Greenland because there there was no open water in the summer. They obviously used them for hunting sea mammals which provided their food for the winter and the oil to fuel their winter-time oil fires. They travelled to Greenland in the whaling boats.
The current Inuit came over from Siberia about 1,000 years ago. A little known fact. Strange that Siberian Husky does not ring any bells. So, this is not evidence for earlier than 1,000 AD ice conditions but the Inuit would not have survived without open ocean in the summer fairly consistently over the last 1,000 years. The earlier cultures did not use kayaks and whaling boats but some type of floating whale skin bag which also indicates open water.
So, the North-west Passage has probably always mostly melted out every summer for thousands of years. Nothing has changed.
“Nothing has changed”
Whatever happened to “the climate is always changing”?
Climate is always changing. It’s just that during interglacials like the Holocene, the change is cyclical.
It is during glacials, too.
Yes, the Thule inuits dispersed so fast from Alaska to Greenland that the process can’t be resolved by radiocarbon dating. They didn’t do that by walking. They used umiaqs and kayaks.
When the Norse colonized southern Greenland ca AD 990, they found no people there, only old hut ruins and stone tools. The Cape Dorset Eskimo which had no kayaks and were dependent on hunting seals on the winter ice had left southern Greenland because it was to warm.
It wasn’t until about a century later they met up with the Thule inuits which had arrived from the other direction and displaced the remaining Cape Dorset people.
“something markedly different from 20th century multi year, multi ice breaker passages on widely separated occasions…”
Griffie, could you please provide a list of the failedefforts to go through the Nortwest Passage, e. g. 1906-1950?
Everyone who studies ice knows the masie data is NOT
SUITABLE for year to year comparisons.
They even tell you this explicitly.
This analysis is a fraud.
BEST is the FRAUD, mosh…
Paid for by a bunch of far left totalitarians.
And you have lowered your integrity to basically zero by letting yourself be their mouthpiece.
“BEST is the FRAUD, mosh…
Paid for by a bunch of far left totalitarians.
And you have lowered your integrity to basically zero by letting yourself be their mouthpiece”
Charles & David Koch were the largest donors of the 1st phase of the BEST project.
I don’t think “far left totalitarian” has ever been an accurate description of either brother.
I recall that many regulars here were supportive of Richard Muller’s plan at the time, right up until his conclusions didn’t match their preconceived notions.
A common criticism of climatology studies is that they aren’t transparent enough.
The code, raw data, methodology, etc are all available for the BEST project.
There’s been ample time to expose their obvious manipulations & fudging.
“Charles & David Koch were the largest donors of the 1st phase of the BEST project.”
First year only.
Then they realised they had been CONNED.
“There’s been ample time to expose their obvious manipulations & fudging”
Yes , it has been exposed. MANY times.
Who is “anonymous”, Mosh
Soros or Steyer related?
This statement is a fraud.
They explicitly state that their data is better than any other source for day to day activity.
Better.
Therefore it must be fit for year to year comparisons.
Then they say that this better data is not as good to use for comparisons because the other data fits in with AGW theory better.
You know that.
That is why you tie yourself in knots defending the indefensible.
Sad but understandable
“Therefore it must be fit for year to year comparisons.”
No. They say quite explicitly that it is not better for year to year comparisons.
Steven, another record (JAXA) gives roughly the same picture. See https://wattsupwiththat.com/2017/08/11/arctic-melt-season-changes-and-the-arctic-regime-shift/comment-page-1/#comment-2578635 . So IMO the main points of this analysis stand.
PS: From your comment:”A good analyst would compare all datasets.” I tried so with the extent-data from JAXA and the monthly data from NSIDC:
http://i.imgur.com/Zv6Gae8.gif
(I used a 13a loess smoother, the thick line)
All the used records show the same behaviour which not depends on the data sets.
Why have you not factored in the changing salinity of the water?
Here is what I did last week. “Eyeballed” the Danish Met temp record north of 80.
Data starts in 1958.
Noted each year when the daily mean did NOT go above the annual mean curve.
1996, 2004, 2005, 2006, 2010, 2013, 2017.
Of course, the weird variable has been the storms that push the ice around.
Bob Hoye
Actually, years with the daily mean consistent with the long term mean curve indicate that there was very little open water. Years with winter temps above the long term mean indicate open water. That should be obvious.
Very interesting piece of analysis..
All but one year that never went above the ERA40 summer average were this century.
That is actually quite remarkable !!!
http://www.climate4you.com/images/70-90N%20MonthlyAnomaly%20Since1920.gif
(Diagram showing area weighted Arctic (70-90oN) monthly surface air temperature anomalies since January 1920, in relation to the WMO normal period 1961-1990).
Nothing is happening in the Arctic temperature-wise that hasn’t happened before in Fred Singer’s lifetime.
Darn, look at that cold peak in 1978/79. !
No wonder the alarmista scammers and trolls want to start all their charts then.
The anomalous highs of the 30’s and 40’s are indicative of a great deal of heat rejection into the Arctic atmosphere and through it to space. The follow on cold period is therefore indicative of that removal of heat from the weather system. That process was complete by 1965, after which temps were fairly flat as ice had grown and cut off heat rejection from sea to atmosphere. By 1980, sea water temps under the ice had risen to the point where the ice was no longer self sustaining and began to break up. This is essentially why the 1980 to 2000 warming trend looks exactly like the 1920 to 1944 trend. The differences are about 97% in the degree of fiddle. It is a fraction of a degree and no one can say that it is accurate so it is meaningless.
This is what matters now:
How will they attempt to fiddle past and present data to hide the cooling phase ( complete with ice extent expansion) that is presently underway? And will we let them do it?
Please read the small letters under this graph;
“Note to the three Arctic temperature diagrams above: As the HadCRUT4 data series has improved high latitude data coverage (compared to the HadCRUT3 series) the individual 5ox5o grid cells has been weighted according to their surface area. This is in contrast to Gillet et al. 2008 which calculated a simple average, with no consideration to the surface area represented by the individual 5ox5o grid cells.”
Mr. Humlum feels free to recalibrate the data he has not been involved in collecting or processed, the curve he showes is pulled right out of his ass.
If you don’t correct the data for grid size you will violently exaggerate the data from near the poles. Not so long ago in anothe thread Steven Mosher assured us that of course, everybody corrects for grid area. He was wrong as usual.
Consequently Humlum’s ass is much better than yours.
Did it occur to you that you have been brainwashed? What is the the problem with the ability to digest fact? A blockage of a part of the brain that has been conditioned to refute it. One of the facts that is being blocked is that heat melts ice. It’s not an easy one to refute. Keep trying, or perhaps go back to the drawing board. Maybe you can prove that there sun is losing heat, or the earth is flat. Good luck with your “research”. This is a massive failure and exposure of a brainwashed condition. There are professionals that can help you. Please look them up and return to a healthy state of mind. I wish you the best of luck with your health.
Did it occur to you that you can’t handle the truth?
The indisputable fact is that Arctic sea ice has flatlined for a decade. The trend since 2012 is up.
From 1979, the iciest year in the Arctic in a century, the trend was down until 2012. Meanwhile, the trend from 1979 to 2014 in Antarctic sea ice was steeply up. How then could steadily rising CO2 over that interval possibly be responsible for Arctic sea ice decline?
And since the increase in CO2 has persisted since 2012, how do you explain Arctic sea ice gain?
Facts are stubborn things.
The extent has been pretty constant – constantly low – but the volume is declining and also the thickness…
Thick multi year ice has declined dramatically.
The ice condition is such a ‘good’ melt season will inevitably see a new sub 2012 record: only a cold summer has helped us dodge the bullet this year already (and we have a month to go)
“Thick multi year ice has declined dramatically.”
LIAR.
Russian charts show hat multi-year ice ahs increased over the last ten years.
You just make your CRAP up, don’t you , griff.
“constantly low”
LAIR, You KNOW that the current extent is ANOALOUSLY HIGH for the last 10,000 year.
Far HIGHER than the MWP. The only period there has been more Arctic sea ice was during the LIA, the coldest period in 10,000 years.
AndyG55 August 12, 2017 at 3:20 am
“constantly low”
LAIR, You KNOW that the current extent is ANOALOUSLY HIGH for the last 10,000 year.
And do you know that the graph you have posted twice now ends in 1950? Also including the legend is missing which would explain what is being plotted.
The paper you got it from says:
“The minimum sea-ice extent is reached in September (Fig. 2). In the last four decades, the extent and thickness of Arctic sea ice has decreased dramatically (e.g. Johannessen et al., 2004; Serreze et al., 2007; Stroeve et al., 2007; Cavalieri and Parkinson, 2012; Laxon et al., 2013; Lindsay and Schweiger, 2015), and this decrease seems to be by far more rapid than predicted by any climate model (Stroeve et al., 2007, 2012). The Chukchi Sea has become completely ice-free during the summer of the last few years (Figs 2 and 3).”
AndyG55 August 12, 2017 at 3:18 am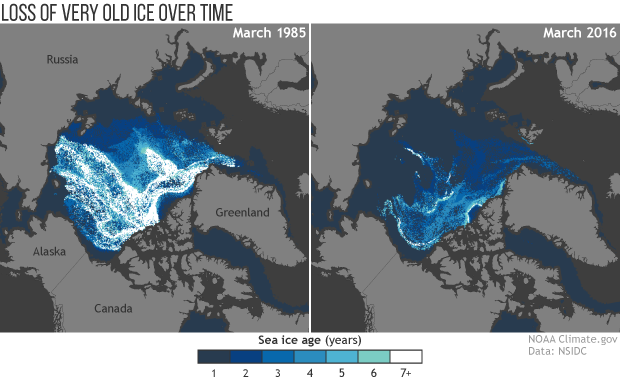
“Thick multi year ice has declined dramatically.”
LIAR.
Russian charts show hat multi-year ice ahs increased over the last ten years.
You just make your CRAP up, don’t you , griff.
Well your producing an unreferenced graph would suggest that you are the one making things up.
Here’s some referenced data:
The age of the sea ice in the Arctic Ocean at winter maximum in March 1985 (left) compared with March 2016 (right). The darker the blue, the younger the ice. The first age class on the scale (1, darkest blue) means “first-year ice,” which formed in the most recent winter. The oldest ice (7+, white) is ice that is more than seven years old. Historically, most of the ice pack was many years old. Today, only a fraction of that very old ice remains. NOAA Climate.gov maps, based on NOAA/NASA data provided by Mark Tschudi.
https://www.climate.gov/news-features/understanding-climate/noaas-2016-arctic-report-card-visual-highlights
“but the volume is declining and also the thickness…”
This is the last refuge of the faithful since they know that ice volume can’t be measured. However thickness can be measured, but only in winter when there is no melt pools, and the trend isn’t obvious:
http://www.cpom.ucl.ac.uk/csopr/seaice.html?show_cell_thk_ts_large=1&ts_area_or_point=all&basin_selected=0&show_basin_thickness=0&year=2014&season=Autumn&thk_period=28
Brainwashed is better then braindead, so instead of sheering Your experience from a series of stays in different coo – coo nests, explain the reasoning of this paper;
http://www.nature.com/ngeo/journal/v1/n11/full/ngeo338.html?foxtrotcallback=true
in context of Humlums out of the ass graph.
If Your answer is just more no clue, no facts, no knowledge no history, do not waste Your time.
“Brainwashed is better then braindead”
How would you know ???
To Gluteus Maximus; Your statement that artic Sea Ice has flattened for the last 10 years, and that 1979 was at the top the last century, put You in the center of Your self.
Quite a cryptic statement on your part.
My statement, OTOH, is as plain and factual as can be. It is objectively the fact that 1979 was at or near the highest Arctic ice year of the past century, and that Arctic sea ice extent has remained the same on average for the past decade.
Objective fact is too strong. We don’t have reliable satellite measurements before 1979 so we are always going to be talking about estimates and reconstructions. These will differ from study to study. The reconstruction of Don, Connolly, Connolly and Soon shown above is slighlty different from that of Walsh et al. Both show significant loss of sea ice since 1979 not previously seen. Walsh does not have 1979 at or near the highest of the last century, and neither does Don et al, although they show it nearer the top.
Here’s an interesting change in the ice melt pattern over on the Russian side:
https://www.reuters.com/article/us-climatechange-arctic-idUSKBN1AR1A3
Of course we have detailed ice records going back to well before the satellite record…
This article documents how records from all sources back to 1850 have been assembled, collated and checked to produce detailed information:
https://www.carbonbrief.org/guest-post-piecing-together-arctic-sea-ice-history-1850
And the conclusions from that research are quite definite:
“Most fundamentally of all, the new dataset allows us to answer the three questions we posed at the beginning of this article.
First, there is no point in the past 150 years where sea ice extent is as small as it has been in recent years. Second, the rate of sea ice retreat in recent years is also unprecedented in the historical record. And, third, the natural fluctuations in sea ice over multiple decades are generally smaller than the year-to-year variability.”
I would dearly like to know how they derived the “annual minimum” for Siberia 1850-1900. During that period two (2) ships passed through the Northeast Passage, Vega (the first ever) in 1878 and Fram (only as far as the Laptev sea) in 1893. There are no other data for the stretch from the Yenisey to the Chukotka.
IIRC, Vega had to overwinter and didn’t reach the Pacific until 1879.
Just for the record, Nansen had no plans doing the Northeast Passage, his goal was to Pole;
https://en.wikipedia.org/wiki/Nansen%27s_Fram_expedition
Val,
What years in the past century IYO had higher ice than 1979? Maybe 1918 or 1919, but sea ice melted rapidly during the early 1920s, and stayed low until the late ’40s, when it started growing again, with wide annual variability, until the late ’70s.
From above:
Other reconstructions and satellite interpretations show one year in the 1970s higher than 1979, but all show years as low as now in the past.
Gloteus, It is worthwhile looking for more recent studies. Things have come on a long way since 1980. As pointed out in the paper co-authored by Soon (Don et al) there was little access to USSR or Russian data then, but these data sets have now become available.