The Permanent Service for Mean Sea Level (PSMSL) is perhaps the best source for sea level data.
Established in 1933, the Permanent Service for Mean Sea Level (PSMSL) has been responsible for the collection, publication, analysis and interpretation of sea level data from the global network of tide gauges. It is based in Liverpool at the National Oceanography Centre (NOC), which is a component of the UK Natural Environment Research Council (NERC).
I recently downloaded the data from their 2014 sea level reconstruction:
Jevrejeva et al, 2014, Global Mean Sea Level Reconstruction
This page provides a short description and file with data of global sea level reconstruction for the period 1807-2010 by Jevrejeva, S., J. C. Moore, A. Grinsted, A. P. Matthews and G. Spada. All questions about the data themselves should be addressed to Dr. Svetlana Jevrejeva.
Authors have used 1277 tide gauge records of relative sea level (RSL) monthly mean time series from the Permanent Service for Mean Sea Level (PSMSL) database [Holgate et al, 2013]. Detailed descriptions of the RSL time series are available from the data page at the PSMSL. No inverted barometer correction was applied. RSL data sets were corrected for local datum changes and glacial isostatic adjustment (GIA) of the solid Earth [Peltier, 2004].
More information about data and methods for the calculations of global sea level and errors can be found in:
Jevrejeva, S., J.C. Moore, A. Grinsted, A.P. Matthews, G. Spada. 2014. Trends and acceleration in global and regional sea levels since 1807, Global and Planetary Change, vol 113, doi:10.1016/j.gloplacha.2013.12.004
The data file can be downloaded by clicking here.
Description of the file:
The file has five columns:
- time (year, month)
- rate of sea level rise (mm)
- error of the rate (mm)
- global sea level (mm)
- error of global sea level (mm)
The data are sampled monthly; so I smoothed them with a 13-month running average to approximate annual variability. I also added a picture of a 12″ (30 cm) wooden ruler for scale.

The key features of Jevrejeva et al, 2014 (J14) are a falling sea level near the end of Holocene neoglaciation phase and then a steady, secular rise of about 1.9 mm/yr since 1860 as the Earth warmed up from the Little Ice Age.
The steady rise from the Little Ice Age is punctuated by a multi-decadal quasi-periodic fluctuation (a cycle to a geologist)…

If someone only looked at the data from the early 1990’s onward, they might be tempted to declare an acceleration in sea level rise.
J14 is definitely an improvement relative to J08; which failed to capture the falling sea level of the neoglaciation phase.
Fun With Sea Level
No post of mine would be complete without sarcastic and/or sophomoric humor… So here it is:


Further Reading
Oh say can you see modern sea level rise from a geological perspective?
Addendum

Is that massive vertical spike at the end real?
It’s in the data. It’s probably due to the 2009-2010 El Niño. Had the reconstruction cover the subsequent La Niña, there would probably be a bigger downward spike right after it.
mm is not a rate. What is the time frame here, David? The spike on the end looks like about 6mm. If that is annual I have to say I had not heard of this. Also, many inhabited places around the world are at water’s edge. Are there significant reports of inundation or abandonment in any of these locales?
The graph isn’t of the rate of sea level rise. It is the average annual sea level in mm. It is sampled monthly. Each data point is the monthly 13-month running average. The rate of sea level rise is the slope of the graph.
The “spike” is about 30 mm from November 2008 to December 2011. 30 mm is just over 1 inch. Had they carried the reconstruction on through the subsequent La Niña, there would almost certainly have been a much larger downward spike.
1 inch per year is a lot over a prolonged period of time. 1 inch annual fluctuations aren’t uncommon. 30 mm annual fluctuations relative a to 2 mm/yr trend aren’t very significant.
John H. : mm is not a rate.
This is the first thing that struck me too. Sadly the authors make the same basic science mistake. They label both the sea level and sea level “rate” in mm. Clearly the ‘rate’ must be per time unit, though I have not yet worked out weather it is per month or per year.
Figure 5. Monthly rate of sea level change… Not accelerating.
Well NO! If you are plotting “rate” and you find a non zero linear fit you have an acceleration. In fact I do not believe that the formula you add in the graph is truly that of the graph. The “x” in your equation is not not the “x” of the abscissa ie year AD. You probably fitted something like (year-1800) as “x”
As the abstract of the Jevrejeva 2014 reports there IS and acceleration in the tide gauge record What she only manages to put in the small print down near the bottom of the paper is that this acceleration happened BEFORE 1900 !!
She clearly states in the paper : no acceleration since 1900.
These are the data columns from the paper…
http://www.psmsl.org/products/reconstructions/gslGPChange2014.txt
gsl_rate (mm) is the monthly delta of the gsl values in mm. I supposed they should have labeled it gsl_rate (mm/m) or gsl_monthly_delta_(mm). If sea level rise was accelerating one would think that the “ups” would be getting bigger with increasing duration than the “downs” over time.
I didn’t read the paper. I just analyzed the data. I don’t see anything that resembles an acceleration. I see a cyclical shift from falling to rising sea level in the mid-1800’s. I suppose if one only looks at 1/2 of a cycle, it could look like an acceleration.
Here is a quick graph with a well-behaved low-pass filter, not a runny mean:
This is a data processing improvement on figure 5 but I don’t have time for a properly labelled graph right now.
It is interesting that the peak occurred BEFORE the 1998 El Nino.
OK, a 48mo gaussian shows the key features of this data.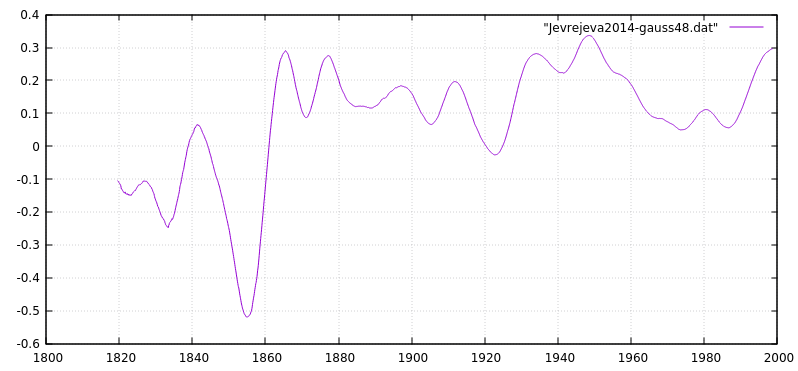
The acceleration was more or less step fn around 1860. The early 20th c. warming and late 20th c warming are seen reflected in the MSL rate of change, as is the post WWII cooling.
Interesting… (I clearly need to advance beyond Excel.)
If anthropogenic CO2 increase was only supposed to be significant after 1960, there is NO evidence at all of it being visible against the natural rate of change in the rest of the data.
A humility worthy of respect.
If you would like to try some filters other than distorting runny means, look at climategrog: https://climategrog.wordpress.com/category/scripts/
There are several awk scripts which will work cross-platform from a command line or “run program” under windoze. The script takes a file name and the number of samples as filter lenght. See comment in the headers
eg gauss.awk jevrejava.dat 12
While I’m not against the idea of this being some kind of cyclic change, if you only have half a cycle there is no justification for claiming one. For that the data, all one can say is that there was an acceleration, or a change from negative to positive change. Even saying acceleration is a bit deceptive since it was a punctual event and saying acceleration gives the impression of a more continuous process.
I think Jevrejeva did some good work on the data but reporting an “acceleration” in the abstract, without saying that it happened BEFORE 1900 is also a misrepresentation which will get quoted as proof of a human impact shown in GMSL.
If you look throughout that graph you will see other similar spikes. Just eyeballing it you can see that some spikes were bigger.
Being at the end of the time series, it sticks out like a sore thumb.
What matters is what the United Nations believe and demonstrate by their actions or lack of action.
I wrote a little blog about the UN HQ on the New York East river.
https://thedemiseofchristchurch.com/2016/05/06/un-headquarters-and-usd1-2-billion-upgrade-and-rising/
Cheers
Roger
Somehow I never thought of half an inch as being massively vertical in any sense.
I was just thinking that. Without historical perspective, the graph seems worse than it is (like temperature anomalies). Need to add this data onto the below graph to bring it up to date. Not knocking David’s post, data is still data.
https://wattsupwiththat.com/2015/06/01/greenpeace-should-stop-fabricating-global-warming-claims/
How’s this then?
Nice David! Had not seen that one before. That should keep a lot of the “massive vertical spike at the end” comments to a minimum.
So when did the Bosphorus dam break, and the Black Sea fill up? Surely that would have made a sudden dip in sea levels. I thought it was about 5500 BC, but there is no equivalent drop in sea levels on that graph.
R
Just a quick calculation, as you described, sea level would have reduced by 1.5m if the bowl was empty. But there was already a fresh inland lake, so somewhere much less than 1.5m (if the theory is correct). If the picture below is correct then much-much less as there was only a few meters of level to fill.
That is us reaching the “tipping point” [sarc]
The time series ends in 2010. It might have something to do with this:
An extreme event of sea-level rise along the Northeast coast of North America in 2009–2010
https://www.nature.com/articles/ncomms7346
Abstract
The coastal sea levels along the Northeast Coast of North America show significant year-to-year fluctuations in a general upward trend. The analysis of long-term tide gauge records identified an extreme sea-level rise (SLR) event during 2009–10. Within this 2-year period, the coastal sea level north of New York City jumped by 128 mm. This magnitude of interannual SLR is unprecedented (a 1-in-850 year event) during the entire history of the tide gauge records. Here we show that this extreme SLR event is a combined effect of two factors: an observed 30% downturn of the Atlantic meridional overturning circulation during 2009–10, and a significant negative North Atlantic Oscillation index. The extreme nature of the 2009–10 SLR event suggests that such a significant downturn of the Atlantic overturning circulation is very unusual. During the twenty-first century, climate models project an increase in magnitude and frequency of extreme interannual SLR events along this densely populated coast.
No, no it is not Keitho. Go anywhere in the world and measure the actual sea level rise and they are nothing like this massive, insane lie. EG. I live in Sydney and our ocean levels have been measured with precision since about 1880 at Fort Denison and I can tell you that the tide levels have changed by a tad over two inches in that period and the rate at which the level is rising has slowed quite significantly and continues to slow over the last 50 years. People with oyster farms etc who keep meticulous personal records for their businesses over long time frames, (80 years in Broken Bay) will tell you the same story all round Australia.
Go to your local spot like Fort Denison and see the tide level changes for yourselves….”they” are lying…yet again. This is what “they” do.
The “liars” indicate virtually no sea level rise at Fort Denison…
https://tidesandcurrents.noaa.gov/sltrends/sltrends_global_station.htm?stnid=680-140
Thanks for your reply Bill ( and everyone else ). Like you I live next to the sea and I have seen no changes over almost 60 years hence my brusque question.
There is a shipwreck (Kakapo) on my beach that occurred in 1900 and it only gets touched by the sea when exceptional high tides and swells happen together with low pressure. Photographs of it from way back show conditions regarding sea level to be much the same as now.
Thanks for the good work David, most interesting, and I look forward to seeing that even more massive downward spike as El Nino effects fade. Cheers.
That spike faded 6 years ago… The Jevrejeva reconstruction ends 7 years ago.
Since Maunders Minimum and the restart of Sunspot Cycles, 1900 to 2008 being the strongest century of sunspot activity, and, they really only began measuring the Arctic Ocean size in 1979 to say this. Too, much bad information and Joseph Goebbels propaganda is out there and not getting better. Dr. Watts has made a measurable change or stop in bad information. The oceans will probably rise as sunspot activity continues. We should find as much Viking era information and look at that for the next possibility. It was a time, Greenland was clear of Arctic Ice. As for the work presented here, scientists used pre-satellite reconstruction in hurricane activity as well and I welcome it. Sincerely, Paul Pierett
Only parts of Greenland were “…clear of Arctic Ice” in Viking times, Paul. Else the Greenland Ice Core record that goes back to and through the ice ages would not exist!
Artic Ice is sea ice … no glacial ice 🙂
tomwys1 July 20, 2017 at 8:32 am
And my big question is, …… just how much of the Greenland Ice Core record that goes back to and through the ice ages ……. is missing, …. melted away, gone, kaput, disappeared, ….. missing?
If the not so warm …… Late 20th Century Warm Period …… is the cause of this, to wit:
Then just how much was the “melting” of the Greenland ice sheet significantly accelerated during the really, really warm temperatures of the Minoan Warm Period, the Roman Warm Period and the Medieval Warm Period? To wit:
Greenland ice cores are taken from the absolute summit of the sheet, which is some 3,000m up, and does not melt. So the core is a complete record of each year.
Greenland melting occurs at lower levels. It also occurs at the base, due pressure, friction, and geothermal activity. So the sheet spreads out at the base, and squeezes into the sea like toothpaste from a tube.
But Greenland is a basin surrounded by mountains, and so the ice finds it difficult to get squeezed into the sea. And its base is not warmed by encroaching seas. The result is that Greenland is a relic ice sheet, that would have flowed and melted away in any other circumstance. It shouldn’t really be there, in our current climate and temperatures.
http://forum.arctic-sea-ice.net/index.php?action=dlattach;topic=867.0;attach=11392
R
It’s the old thing of “I read somewhere”. A Jesuit Priest supposedly had a map of every inlet on Greenland he picked up at the Pope Map Outlet in Singapore. All kidding aside, It was a Viking map. North Greenland may have only been cleared for a while, but it was long enough to map it. I may have gotten that from a book called Ice Finders. I learned recently that a British ship was stuck in the Ice of Greenland and was saved by a US ship. They took part of the planking to build the President of the USA’s Oval Office Desk. I have about dried up my present research. I think it is time for a new research path. Let’s find the Jesuit Map.
ralfellis July 20, 2017 at 1:39 pm
I would think that iffen Greenland is a basin surrounded by mountains, then that basin would be chocked-full of glacier ice up to the tops of the mountains after several multi-million year Ice Ages.
On the other hand, if there are several “breaks” or valleys that permit the contents of that basin to be flushed into the ocean, the depth and width of those “valleys” are surely the result of “meltwater” erosion or glacier “flow” erosion. Remember now, low hills, high hills and mountains really don’t pose a hindrance when the force of gravity starts “sucking” that glacier ice downhill to sea level elevation.
ralfellis continues:
It is my opinion, based on the following study, that there must have been ….. like 6,000+- years of massive melting of the Greenland glaciers, from both the mountaintops, basin and valleys, to wit:
And ralfellis, …… here is commentary I penned a few years back, to wit:
If it is settled Science that:
1. The Greenland Ice Sheet (GIS) is up to 4,688 feet thick with the lowest level dating back to roughly 9704 BC (11,700 BP). http://www.gfy.ku.dk/~www-glac/papers/pdfs/219.pdf
2. The accepted start of the warm Holocene Interglacial Period (HIP) began at 11,700 years BP. http://en.wikipedia.org/wiki/File:Holocene_Temperature_Variations.png
3. The Late Wisconsin Glacier (LWG) covered much of Long Island with ice up to 3,300 feet thick at 18,000 years BP when it stopped advancing. http://en.wikipedia.org/wiki/Long_Island_Sound
4. Via sea level proxies the LWG started to quickly melt at 21,000 years BP. http://schools-wikipedia.org/images/439/43917.png
Then would someone please answer my following questions which are:
1. How thick was the GIS at 18,000 years BP?
2. Did the GIS also start quickly melting at 21,000 years BP or did it not start melting until 15,000 years BP?
3. How much of the current GIS is a remnant of the LWG of 18,000 years BP: all, part, or none of it?
4. If all or part of the current GIS is a remnant of the LWG then does the lowest level actually date much farther back than the settled Science date of 11,704 BP?
5. If the settled Science date of 11,704 BP for the lowest level of the GIS is correct then is it a scientific fact that the GIS had also completely melted prior to the accepted start of the HIP and has since reformed to its current 4,688 feet thickness?
6. If the GIS completed melted prior to 11,704 BP then did the earth experience a much more pronounced period of warming prior to the accepted start of the HIP than it is currently experiencing?
Cheers, Sam C
@Kaiser Derden – almost the entirety of Greenland is in the Arctic Circle. There are smallish glaciers on other bits of land inside the Arctic Circle. There certainly is “land ice” included in “arctic ice.”
I stood on Prudhoe Bay on May 2006. It eventually melted and the long haul truckers got a relief. Going back nearly a 1000 years and being an Absolute on the topic, leaves us vulnerable. Let’s not step out so far. I studied the Med Sea and answer the question On Answers.com that the depth varies from dessert to about 5,000 feet. I was ganged up on. No, you are wrong.. why? They went to some on line sight for a quickie answer. `
Notice that at the recent Columbia University sponsored Sea-Level event, the Mörner/Klein Fiji Island paper and information were glaringly absent, as was participation by David Legates, and a host of other true experts. What’s worse, no papers presented discussed the clearly discernible solar signal in short term Sea-Level variability. The (to date) non-transparent “data” corrections that obtain the “new” 3.9mm rate of rise claim cross validation with Tide Gauges, but which ones, and where are they located. All available to me still remain within a 95% confidence limit (up and down) that stays linear and are currently heading down to the lower bound as the solar output continues to wane.
I suggest looking at Dave Burton’s (well put together) Sea-Level Rise webpages . They use the accurate PSMSL data, but juxtaposed with a CO2 overlay, and other choices, demonstrating to all, the total absence and lack of CO2 signal in Sea-Level Rise hard data. What is “hard data?” Measured, verified, and (cross)validated actual data – not “semi-empirical,” or modeled, or adjusted, or GIA “corrected.”
Jevrejeva et al Fig1. looks highly suspicious, almost as a part of the ‘hockey stick’, but we have to ask: what if it is, however crude, reasonable representation of reality?
Why the Sea level change should so suddenly reverse around 1860, and go up in a linear fashion?
Couple of years ago I plotted this graph
http://www.vukcevic.talktalk.net/NANV.gif
Note that the horizontal (x-axis) scales coincide in 1860, and from then there is a linear drift. If this has any relevance in regard to the Jevrejeva Fig1. it points to the tectonic causes as a significant contributor to the sea level rise.
Few more details at these WUWT comments .
1860 is roughly the time that glaciers stopped advancing and began to retreat. Glacial advance = sea level drop. Glacial retreat = sea level rise.
Thanks David
Any idea why the reversal in glaciers size would happen around mid 1880s, since neither the
global temperature reconstructions
or the instrumental records for the
CET
indicate that the temperatures might be responsible.
The warm up from the LIA started around 1600. It took a while for in to get warm enough to reverse the mass balance trends.
correction ‘mid 1800s’
“1860 is roughly the time that glaciers stopped advancing and began to retreat. Glacial advance = sea level drop. Glacial retreat = sea level rise.”
Think it is a coincidence that this is about the same time the CAGW use as the starting point for warming?
CAGW is a cat’s cradle of coincidences.
Vuk, not in any way to criticize what you wrote, but what the heck are “high latitude tectonics” and what are the units on the red vertical scale, and what was the source of such data? You are a rather cryptic commenter, but obviously one whose thoughts have a wide range, and some of us might like to know a bit more about your insights. Even ones that sound absurd at first glance.
Hi there SR
It refers to what goes on at and just south and north of Iceland. I assembled a data file using wide range of sources available on the internet (Iceland’s, British, Smithsonian etc ).
Why Iceland matters?
”Denmark strait is bottleneck on the superhighway in the oceans global circulation”-Woods Hole Oceanographic Institution
“North Icelandic Jet current contributes to a key component of the Atlantic Meridional Overturning Circulation (AMOC), also known as the “great ocean conveyor belt,” which is critically important for regulating Earth’s climate.”
Units are plain numbers (events recorded), while the red curve is output of a low pass filter, used for clarity.
“Even ones that sound absurd …”
Ah, missed that bit. Absurdity is kind of a iintelegence, i.e. sqr(-1) * intelligence.
Ok vukcevic, now we know WHERE “high latitude tectonics” are, but we still don’t know WHAT they are.
Earthquakes? Volcanoes? Tidal Waves? Lemming Migrations?
~¿~
Passive learning is far less enriching than doing even a little bit of research personally, I would highly recommend it.
What?
No seriously, What?
It’s YOUR graph, Vuk. I shouldn’t have to do independent research to figure out what it measures. And if you’re not willing to be spacific about your data I’m going to assume that it’s because it’s been so heavily data mined and cherry picked as to be worthless. We already know you’re limiting to data from a spacific region, so what other parameters have you set? Size of the earthquake? Depth of epicenter? Phase of the Moon? Is the elephant wiggling it’s trunk?
I usually find your posts at least interesting, and usually informative. But you’re being very evasive about this. And this is Climate Science, I don’t give anyone the benefit of the doubt anymore. Even those on my ‘side’ need to show their work before I’ll trust it.
~¿~
Love your chart. The low parts and 1970 numbers match the lower sunspot activity which causes drought. We are in a sunspot minimum now and I’d like to see the numbers added through the end of 2030. The two smaller cycles began Jan 2008 – 2019 and 2020 ends 2031. Sincerely, Paul Pierett
If you see a turtle on Al Gore’s head you can be pretty sure it didn’t get there by itself.
+√-1
Yes, Al Gore went to the docter to address the Turtle problem and when the doctor asked him how he got the turtle on his head, the turtle aswered; “It started with a lumb”.
Don’t take that reconstruction too seriously.
“RSL data sets were corrected for local datum changes and glacial isostatic adjustment (GIA) of the solid Earth [Peltier, 2004].”
That “Peltier 2004” is the giveaway. It means that they use the ICE-5G model for GIA. Unfortunately ICE-5G is known to be obsolete and grossly inaccurate. Details here:
http://onlinelibrary.wiley.com/doi/10.1002/2016JB013154/full
Sea Level rise….read thermal expansion and not forget the response of sea and lake levels to solar minima/maxima which is not really remarkable if you think about it. Real sea level fall and rise comes with the onset of coming and going of ice ages when huge masses of water are transformend in the expanding continental ice caps and that are released approx. 100.000 years later when the next short lived inter glacial takes place. Therefore I put my cards on sea level decline, about 400 ft with certainty. See where that puts our ports and our water front properties…LOL. In my humble opinion therefore that it would make more sense to focus on dealing with the next ices age and how to prevent the next big impact from space that could trigger the next extinction event. We have the technology to do that, All humanity has to do is grow up and stop wasting money and resources on political doctrines. Besides that it would be a lot cheaper make plans how to engage the next glaciation event and sanitise the space around our planet from killer objects able to destroy our entire biosphere as it has happened many times in the past. Besides that it would give humanity some kind of real perspective. An answer to the ever burning question that obviously tortures so many minds. An answer to the reason why we are here at this moment in time. What I like about this view is that it is a positive one, that it is science based, realistic and the only logical step to make. All it takes is to look at the geological evidence and draw our conclusions or wait for a smaller piece of debree to hit a city. That would change everything. Cheers
Got my vote!
Jevrejeva 2014 used the older ICE5G glacial isostatic adjustment model which is substantially different than the previously used models which was ICE4G.
For example, in Blue below is the Jevrejeva reconstruction for Arctic sea level while Black is if they used the older ICE4G model. Something as simple as this makes a huge difference.
http://ars.els-cdn.com/content/image/1-s2.0-S0921818113002750-gr12.jpg
And then for Scandavia, which turns a huge rising trend back to the flatter one it should be.
http://ars.els-cdn.com/content/image/1-s2.0-S0921818113002750-gr13.jpg
Now even ICE5G model has been replaced with ICE6G which uses GPS station data which is again substantially different. So even Jevrejeva 2014 has OVERESTIMATED sea level rise because it is the older guessed-at model versus the newer GPS actually-measured model.
The newer model made a huge difference in glacial mass estimates for Antarctica from the Grace satellite for example. ICE6G below.
http://onlinelibrary.wiley.com/doi/10.1002/2014JB011176/full
I knew that recent GPS data demonstrated that GIA estimates were too high for Antarctica.
So, J14, with its overestimated SLR, still doesn’t demonstrate anything ominous.
Have a look at this and you will see that even ICE-6G probably violently overstimates GIA:
http://onlinelibrary.wiley.com/doi/10.1002/2016JB013154/full
If the goal is to measure some best ‘average’ global ocean volume, then i suppose this approach makes sense.
However, it makes no sense at all to assess the potential impacts of CO2 driven global warming. For that, the individual unadjusted tide gauge records make the most sense.
They are measuring sea level where it matters, on the coast where sea level rise could actually cause damage. We assume that whatever geological background motion that’s happening in the area is constant over short time scales. We assume that any sea level changes before ~1950 have nothing to do with CO2 and can also be treated as part of the baseline.
So, the best way to assess co2 driven sea level risk is to look at individual long-run tide gauges, subtract out all baseline trends pre 1950, and only consider acceleration above that trend without any sort of extra adjustments cobbled into it.
There is not enough continental ice available to cause any sea level rise. Antartica has it’s own weather system and ice didn’t retreat there for the past 15 million years. In terms of stability this is as stable as it can get. The Greenland Ice Cap is gaining mass in record amounts since we started obeservations. These simple facts should be enough to sink the AGW Titanic.
Before Antartica and Australia separated, there wasn’t any ice in that region.
Don’t tell the Warmists, who took almost 100 years of scientific data, and very precise measurements of lab co2 radiative measurements, and used them to predict full meltdown of both Antarctica and Greenland within 400 years.
They also used Mannian math to calculate that if they were wrong and it instead took 1000 years to occur that the rate of sea level rise would only be 4 feet every ten years, starting at the year 2000.
All of this is cited in the Nixon white house archives, and the expert report from 1965 is available online.
Sea level measurements are very noisy at the level of precision considered here (millimeter). Getting a first derivative – a sea level rise speed – is difficult and subject to arbitrary choices. Only fools attempt to get a second derivative – the acceleration.
Agree, in some places it varies up to 30m on daily basis. Millimeter precision then is not science.
Agree! Meaningless statistical horseplay. If you need pointless newsprint to line your birdcage, this is the stuff to look for!
When discussing ocean levels is it possible that the land is sinking due to how the tectonic plates move or is that a dumb question?
I see history shows where long ago they showed land bridges in one place and lakes/oceans in another and I find it interesting that they are gone.
The land is sinking in some places and rising in other places. Seas are sinking in some places and rising in other places – waves, tides, wind, ocean currents, thawing glaciers, etc.
Need to add density changes in the local water column.
This data is old, but easy to remember – 13,000 years ago the ocean level was 130 m lower than today.
Thank you Curious George
Most of my shoes have thicker heels than the expected real sea level rise this decade. By the time the laces get damp I suspect I will be buying some new shoes.
The last plot is labeled gsl_Rate (mm). Rate does not have units of millimeters. Is it supposed to be mm/y? That would not seem to be correct either since the plot oscillates around something very close to zero (<1).
That is the month to month change in sea level in mm.
OH, mm/month. That explains why it is so close to zero on average. Thanks!
If we’re getting technical don’t we need to include expansion of the Earth’s rocky crust due to warming in our calculations? I think it’s a mistake to believe that the ocean is analogous to a thermometer. For one a thermometer has a bulb so that expansion of the liquid inside the thermometer is accentuated over expansion of thermometer itself.
” RSL data sets were corrected for local datum changes and glacial isostatic adjustment (GIA) of the solid Earth [Peltier, 2004].”
Why do they make isostatic adjustment to RSL. Then it is no more RSL, but some hybrid version.
You could try to measure the amount of water in the sea, and you could also define it as how much the sea have raised over the sea bed, but then make it clear.
Then you have RSL, which is sea level at the shore and what peoble should care about.
These two definitions should be stated whenever you report any sea level, so that all knows what you are talking about.
They’re trying to derive eustatic sea level changes. That’s why they correct for datum changes and GIA.
I think the most accurate method would be to calculate the total volume of land that sticks out of the water. Except of course that that would present the mirror image problems of sea level.
“The key features of Jevrejeva et al, 2014 (J14) are a falling sea level near the end of Holocene neoglaciation phase and then a steady, secular rise of about 1.9 mm/yr since 1860 as the Earth warmed up from the Little Ice Age.”
Australia’s CSIRO average estimate for the 20th century is 1.6mm/yr which includes satellite altimetry so they both seem eminentl reasonable allowing for a margin of error. However both estimates are dwarfed by the geology of Hallett Cove in SA which can show an average rise of 16.25mm/yr for 8000 years with only aboriginal cooking fires and traditional burn-offs to flush out game to point the finger at anthropogenic CO2.
Where’s Nick and Griff to explain the anthropogenic CO2 component nowadays? Come on and don’t be shy, let’s hear the seance fellers.
oops ’eminently’
Anyhow they’re still settling the science for human habitation of Oz-
http://www.smh.com.au/technology/sci-tech/aboriginal-archaeological-discovery-in-kakadu-rewrites-the-history-of-australia-20170719-gxe3qy
but note how the learned professor knew the sea level was so low at that time between Papua New Guinea and Australia.
This would be about the twentieth time somebody reports finding proof that humans were in Australia before 40,000 BP. They never stand up to serious scrutiny. In this particular case they use ”Bayesian modelling” of dates, but without explicitly stating their prior which is always a warning signal.
I did kinda figure a few thousand years was a bit fuzzy and they’re still busy settling the science tty, but don’t let on with these dogmatic paleo types you’re a tad skeptical as it seems to tip them even more into doomsday mode 😉
If you’re looking for data from a specific tide gauge, Dave Burton’s site is very good too:
http://www.sealevel.info/
If you click on Data on the left you can pick a country. Say India.
The 2 arrows at the top of the chart will move you to additional tide gauges for the same country.
Bombay has been 0.8 +/- 0.1 mm. So less than the global average.
Dave’s site is very good!
I hadn’t before looked at his lists of gauges. They are really nice. As an example:
‘Holgate-9’ — Nine excellent tide gauge records of sea-level measurements
http://www.sealevel.info/MSL_holgate9.html
Only nine gauges, but they all have over 90 years of records. Numerous other similar lists. And the lists have lots of useful details.
David,
Thanks for another outstanding effort presenting the data and following up answering questions.
Is there any good reason that the data/plots available stop around 2014? not to criticize your fine effort at all, working in private industry all my life one wonders why latest data is not more available.
The reconstruction only runs up to mid-2010.
P L Woodwork using Liverpool tide data does not show a dip at 1860, what it does show is a cyclic steady increase, with possible increase in the more recent time. Have you mistaken one of these dips (sun moon effect) for a change in trend?
onlinelibrary.wiley.com>doi>pdf
Climate change sea level alarmism is nonsense. At any location, the local sea level is dominated by land movements, not climate change. And worldwide, coastal land areas over the past 30 years have actually increased (e.g. from river silting and land uplift) more than they have decreased (e.g. from subsistence), as revealed from actual satellite observations:
http://www.nature.com/nclimate/journal/v6/n9/full/nclimate3111.html
https://www.deltares.nl/en/news/how-the-earth-has-changed-over-the-past-30-years/
Yep…
https://wattsupwiththat.com/2016/08/30/earths-surface-gaining-coastal-land-area-despite-sea-level-rise/
You can almost always make some valid argument either way about whether sea-level rise is accelerating.
When I looked at data posted by the EPA through 2015, I found deceleration over the last five-year interval but acceleration over the last ten-, twenty-, and forty-year intervals.
Those results are really less interesting than that the recent (various-interval-length) accelerations are replicated earlier last century–with higher rates of acceleration–after which deceleration occurred, all before carbon-dioxide concentration had increased much.
In short, whether sea-level rise is accelerating tells us very little about what will happen next. Which is why we laymen are justified in distrusting the government-funded scientists who cite that quantity as cause for alarm.
Here’s my own SLR analysis using PSMSL data with GPS vertical corrections:
https://climateadj.wordpress.com/2017/01/28/sea-level-rise-acceleration-and-trends/
Bottom Line: Not much if any acceleration.
Just for shits and giggles, someone should add measured sea level rise since the Statue of Liberty was built to that Statue of Liberty graphic.
It does. The sea level reconstruction back to 1800. Construction on the SoL started in 1875.
David, why is it that your graph is different from that of PL Woodwork of Liverpool University?
It does not show the dip at 1860.
onlinelibrary.wiley.com>doi>pdf
It’s not “my” graph. The data are from:
It’s a global reconstruction of eustatic sea level change. It’s different than PL Woodwork of Liverpool University because it’s not a global reconstruction of eustatic sea level change…
This is a single sea level record. It’s not even included in the PSMSL because…
http://www.psmsl.org/data/longrecords/
Sorry P L Woodworth Geophysical Research Letters volume 26, p1589 (1999)