Guest essay by Robert Balic
A summary of a problem with estimates of the average concentration of carbon dioxide in the atmosphere and questioning of how it is possible that the rate of increase correlates well with global temperature anomalies.
I saw an interesting plot in the comments of of WUWT a while ago. It was based on the work of Murray Salby who pointed out the strong correlation between the concentration of carbon dioxide in the atmosphere (NOAA ESRL CO2 at Mauna Loa) and the integral of mean global temperature anomalies. How well the CO2 levels correlate with various temperature anomalies can be seen in this plot of the derivative of CO2 levels with respect to time (rate of CO2 level increase) alongside some estimates of global temperature anomalies – HadSSTv3 SH (southern hemisphere sea-surface temperatures) and RSS (lower troposphere temperatures from satellite observations).

http://woodfortrees.org/graph/esrl-co2/mean:12/derivative/scale:3/plot/hadsst3sh/from:1958/offset:0.3/plot/rss/offset:0.2/from:1990
The first time that I saw this, I thought that what was meant by “derivative” was an estimate from differences between consecutive months but in ppm per year (as time is in years) so I was twelve times as confident that something was amiss as I should have been. Even after realizing that the results were in ppm per month, I thought that the results were still implausible. That changes in sea surface temperature would have an effect on CO2 levels is plausible but to correlate so well and then to be measured so precisely in order to be able to see the correlation did not seem possible.
In the above plot, the CO2 levels in ppm per month were scaled by 3 to compare with temperature anomalies. If I were to use ppm per year, then I would divide by 4 to do the same comparison iehey are not the same dimensions so the scaling is irrelevant. The data clearly needs to be scaled and also offset to fit each other well so by good correlation I am referring to the way they differ from a line of best fit after scaling to have the same slope.
I have put this out there in comments on blogs and received few replies. One that I need to mention is the claim that the derivative values are some sort of concoction and are so small that they are negligible, about 0.03% of CO2 levels. I don’t know why I need to point this out but an average of 0.125 ppm per month is the rate of change of CO2 estimated using the same method since even Newton was a boy and is equal to 90 ppm per 60 years. Its not negligible but there is the question of whether the uncertainty in measurements are too large to see fine trends over a period of a few years (and you should never multiply the quotient of two values of different dimensions by 100 and call it a percent).
Eyeballing the graph, it appears that the data needs to be very precise in order to see a correlation and a little bit of math makes things clearer. Rather than using the above derivative of smoothed data (12 month moving mean), I took the CO2 levels from woodfortrees.org and the difference between values 13 months apart. Essentially the same with the results being in ppm per year.
There is a good fit to the global temperature anomalies, especially RSS lower troposphere after 1990 (and to HadSSTv3SH before 1990) when the rate of change of CO2 levels is scaled by 0.26 and offset by -0.30. The mean absolute differences between the two is 0.13 and the standard deviation (SD) is 0.17 but varies from 0.08 to 0.2 for blocks of 1 year .
Using the lower value, this is consistent with an uncertainty in GTA of 0.1 K and in monthly CO2 levels as low as 0.34 ppm as calculated using
0.26^2 x 2ΔCO2^2 + ΔT^2 = (2 x 0.08)^2 where ΔCO2^2 and ΔT is the random error of CO2 levels and GTA which would be 2SD of repeat measurements.
This assumes that when differences are at a minimum that it is solely due to random error in the two measurements but its worth remembering that HadSSTv3NH differs much more than this from the rate of CO2 change so there are obviously other errors. Its also a stretch to assume perfect correlation of the real values, especially since its claimed that CO2 levels have increased due to human emissions and the latter have been at a steady rate for the last three years. There is also the question of why such a good correlation with SH sea-surface temperatures and not NH, and why should the correlation be so perfect when things like changes in ocean currents should have a large effect on how much is sequestered into the depths of the oceans.
So unlike I first thought, the precision didn’t need to be ridiculously good to see the correlation but this is still to good to be true.
Discover more from Watts Up With That?
Subscribe to get the latest posts sent to your email.
Ferdinand
You have not explained from what particular experiment / test results you believe that the net effect of more CO2 in the air is that of warming rather then cooling?
Bindidon
In the city that you live in, have minimum temperatures been rising or falling during the past 20 years?
Henry,
As CO2 retains more IR upward (as measured by satellites) and sends more IR downward (as measured by surface stations), it must give more warming than cooling (as it does in the stratosphere), because energy can’t be destroyed or created to/from nothing… If that is a lot of difference, is a different question…
Ferdinand
You have to present a balance sheet of how much radiation is deflected 1-5 um 12 hr /day and how much is retained 24hr/ day by the odd 100 ppm extra.
henryp on April 8, 2017 at 1:09 pm
GHCN V3 station 61710384000 BERLIN-TEMPEL
Trend for the unadjusted tmin data jan 1997 – dec 2016: + 0.28 °C / decade
Hope it helps you…
Ferdinand
You have to present a balance sheet of how much radiation is deflected 1-5 um 12 hr /day and how much is retained 24hr/ day by the odd 100 ppm extra.
That should read:
You have to present a balance sheet of how much radiation is deflected away from earth 0-5 um 12 hr /day in the areas where CO2 absorbs and how much is retained 24hr/ day by the absorption of CO2 in the 14-15 um range, in both cases by the odd 100 ppm extra. This cannot be done with a closed box experiment and neither can it be done “with a satellite’. On top of that we have the problem that we also sit with absorption of water [vapor] in the 14-15 um range.
Particularly, graphs 6 (bottom) and 7 of the report below prove my point that the CO2 is also cooling the atmosphere, i.e. absorptions of the CO2 in the 1-2 um that we picked up via the moon i.e. we can qualitatively measure the energy (radiation) reflected from earth by the CO2 via the moon
http://astro.berkeley.edu/~kalas/disksite/library/turnbull06a.pdf
Bindidon
the point behind my question was that you must always first find out what goes on in your own backyard, as, in my case, I got a bit of a surprise. My finding was that the increase in CO2 here in Pretoria did not cause any increase in minimum T over the past 40 years; instead it went down, even though [as we all know] CO2 went up.
I don’t know about your station Tempelhof 10384000 because I do not see data there beyond 2008.
Berlin station 726160 at the airport shows a rise of 0.58K/decade from 1996-2017 for minima. However, for means the result is almost identical. For maxima it rose by 0.65K/decade showing that the rise in Tmean and Tmin in Berlin appears to be caused by increasing solar radiation. Knowing a bit of my sun, the increase in radiation is most probably due to more sunshine hours in Berlin, i.e. less cloudiness and less rain as determined by the ‘weather’. – nobody knows which way the wind blows, exactly – but it appears that the weather is getting better. That will be a good thing as I happen to be on holiday in Germany in August; perhaps we must chat over a cup of coffee and put both our brains together. Besser, vielleicht, wenn das wetter so gut ist, machen wir ein Bier?
henryp on April 9, 2017 at 6:49 am
Berlin station 726160 at the airport shows a rise of 0.58K/decade from 1996-2017 for minima. However, for means the result is almost identical. For maxima it rose by 0.65K/decade showing that the rise in Tmean and Tmin in Berlin appears to be caused by increasing solar radiation.
What I experience here with you perfectly fits to what you present all the time: spurious matters with no relation to reality.
You don’t need more than to google to find out where your strange Berlin station 726160 is located in:
https://de.flightaware.com/resources/airport/KBML/services/FBO/Berlin_Municipal_Airport
It’s in USA (NH). There are many cities called Berlin in the USA, henryp…
A simple Google search for station 61710384000 would have been helpful for you to understand your blind-alley.
I’m sorry henryp: you make me losing some precious time here I would rather spend for more important things. Let me wish you all the very best.
Joe – The climate scientist April 7, 2017 at 2:29 pm
“There is near perfect correlation of the last 30 or so years (as compared to the last 100 years, 200 years, last 1,000 years, etc)
Therefore it proves co2 is the primary driver of AGW. (do pay any mind to the lack of correlation in the prior 1,000 years, they are ot relevant)”
The correlation proves nothing unless you can prove causation.
I have here just as good correlation with the PAUSE included, but I have no means of proving causation.
http://www.vukcevic.talktalk.net/MTC1.gif
I still have difficulty with the fact that Mona Loa is next door to the most active volcano on earth.
CO2 may be well mixed but it in not necessarily evenly distributed.
Steve,
There are about 70 stations maintained by different organisations of different countries that measure CO2 in “background” conditions, that is as far as possible away from local contamination. Even at Mauna Loa most of the measurements are done in trade wind air, only passing ocean waters for thousands of km.
Have a look at lots of stations and their data at:
https://www.esrl.noaa.gov/gmd/dv/iadv/
This nice little video says it all…
Steve in SC on April 8, 2017 at 1:54 pm
I still have difficulty with the fact that Mona Loa is next door to the most active volcano on earth.
I can understand! And there were many asking for the same.
Please have a quick look at a page dated 2008 (!)
https://www.skepticalscience.com/co2-measurements-uncertainty.htm
and follow the messages posted by commenter “Mizimi” (1, 7, 9, 11, 12) and all answers related to them.
I’m all but a fan of SKS but they bring sometimes really valuable information.
As I recall there is a 3 year lag between NH and SH CO2 increase. Is that correct, and if so can it be reconciled with a mostly natural CO2 growth? That is, due to the ITCZ, anthropogenic CO2 transfers slowly from north to south, whereas if warming oceans were the primary source, it would slowly transfer from south to north. –AGF
agfosterjr.
The increase indeed is near ground in the NH first, taking ~6 months to the height of Mauna Loa and 1-2 years to the SH, which proves, together with the opposite δ13C drop (from low-13C fossil fuels) that human emissions are the main cause, as about 90% of all human emissions are in the NH. The graph is here (but needs a more recent update!).
The NH oceans being colder than the SH oceans, with consequent higher CO2 carrying capacity, and the SH oceans being prevented from warming further because they are already at the maximum temperature allowed by the greenhouse effect (whether radiative or mass induced) as per Willis’s thermostat hypothesis (which was actually noted by others prior to Willis if I recall my 60s education correctly) any warming of the entire system has a disproportionate effect on the CO2 content of the NH oceans.
Hence one does not need to invoke human emissions to explain observations.
Whilst I have every respect for Ferdinand and his detailed analyses the fact is that over the years I have noted that behind everything he says there are certain basic assumptions which do not necessarily hold true because alternative explanations are available such as this.
I should have said that the SH oceans are CLOSER to the maximum temperature allowed by the greenhouse effect so that any warming (or cooling) of the entire system has a disproportionate effect on the CO2 content of the NH oceans.
Stephen,
How do you explain the huge drop in δ13C of the (NH) ocean surface (and the SH as measured in ice cores and CO2 monitoring stations) since ~1850? Again in the NH first and years later in the SH:
http://www.ferdinand-engelbeen.be/klimaat/klim_img/sponges.jpg
and
http://www.ferdinand-engelbeen.be/klimaat/klim_img/d13c_trends.jpg
Low C13 isotope emissions from the organic content of NH oceans since the LIA ?
Stephen Wilde:
Low C13 isotope emissions from the organic content of NH oceans since the LIA ?
Would be a little difficult as all ocean CO2 (deep and surface) have 13C/12C ratio’s (+0 to +5 per mil) above the current ratio in the atmosphere (-8 per mil)… Thus more outgassing from the oceans, wherever that would be, or even more CO2 exchanges between oceans and atmosphere, would increase the 13C/12C ratio in the atmosphere.
It seems that your ocean outgasssing theory violates some observations…
BTW, human emissions are in 13C/12C ratio far below (-24 per mil) the ratio in the atmosphere…
Have you considered this?:
From the analyses shown, it can be seen that there is no evidence to suggest that carbon dioxide from the burning of hydrocarbons has any influence on atmospheric levels. There is significant correlation of atmospheric CO2 with ocean temperature which might be explained by Henry’s law of gas solubility in water. It is also shown that changes in CO2 occur after changes in temperature, and in particular ocean temperature. An apparent periodicity in the correlation may suggest a link toocean circulation patterns.
The idea of natural saturating CO2 sinks as suggested by the UN IPCC has been shown to be flawed because it simply is not supported by the data.By example it has been shown that cumulation of all positive time series with a slight upward trendcan be made to closely match the Mauna Loa atmospheric CO2
record even when there is no linkage between datasets. This process cannot be used to demonstrate a relationship between anthropogenic releases of CO2 from burning hydrocarbons as it is inappropriate and leads to the spurious long atmospheric lifetimes for CO2 used by the IPCC.”
and especially :
“Although not dealt with in detail in this work, isotopic changes in atmospheric carbon dioxide(13C/12C ratio) could be explained by dynamic fractionation taking place at the air/ocean interface.Global average out-gassing of carbon dioxide would inherently create a change in atmospheric isotopic ratio”
from here:
http://www.scribd.com/doc/129802522/Natural-or-Not
Stephen,
I had some discussion in the past with Jonathan Drake, as he was the author of a theory that the CO2 levels from ice cores needed a “correction”. Don’t remember what it was (temperature?) but it was a quite strange idea at that time…
isotopic changes in atmospheric carbon dioxide(13C/12C ratio) could be explained by dynamic fractionation taking place at the air/ocean interface
There is indeed a fractionation when CO2 transfers from the oceans into the atmosphere and back. In both cases the lighter fraction increases. The back and forth transfer gives an overall drop of about – 8 per mil between ocean surface and atmosphere. That can be seen in the isotopic difference between the ocean waters (0 to +5 per mil δ13C, depends of biological activity) and the atmosphere (-6.4 per mil δ13C) in pre-industrial times. In current times, both the atmosphere and the ocean surface dropped in δ13C level, due to human use of fossil fuels. If there was more upwelling from the deep coeans (which gives abundant biolife), that would give an increase of the δ13C levels in the atmosphere, not a further decrease…
Has anyone done research on the percent components of gasses released by volcanoes? SO2 would have a cooling effect when vented high enough in the atmosphere. What effect do other gases have?
noaaprogrammer on April 8, 2017 at 9:13 pm
You are right to mention SO2, as this gas really is a problem subsequent to every eruption due to the change of the so called Stratospheric Aerosol Optical Depth. This has been accurately measured by satellites.
What now concerns CO2 output by volcanoes: I think Ferdinand Engelbeen informed us that it is at best 1% of what humans emit. About CH4 I don’t know anything valuable.
noaaprogrammer,
A nice overview of volcanic gases is here:
http://volcano.oregonstate.edu/book/export/html/151
Only with explosive eruptions (like with the Pinatubo), the stratosphere is reached and SO2 transforms to SO3 (with ozone) and that attracts water vapor to form H2SO4 + water drops which reflect/scatter sunlight, cooling the earth somewhat, but also enhancing photosynthesis (thanks to the scattering). The particles drop out of the stratosphere in 1-3 years as they get heavier over time. If SO2 doesn’t reach the stratosphere, that rains out in a few days. The same for other acids (HCl, HF).
Nearby large emissions of active volcanoes (or even non-active), CO2 can suffocate plants (Mammoth Lakes in the US and some lake in Africa) and even animals/humans. Some volcanoes contain relative huge quantities of HF (Iceland), sufficient to kill grazing sheep and cows after an eruption. SO2 in large concentrations is toxic when inhaled,…
And, according to you, the cumulative CO2 from all those events should still be in the atmosphere in a ratio of 1:2. So, where are they?
Bart,
That remark only proves that you have no idea where you ar talking about.
Any extra CO2, whatever the origin, above steady state for the current average ocean surface temperature (which is ~290 ppmv for ~15°C) is removed by the sinks at a ratio of 0.02 per year (~51 years e-fold decay rate), surprisingly linear over the past near 60 years.
Thus a continuous emission of ~0.05 ppmv/year from volcanoes partly remains in the atmosphere until the extra pressure in the atmosphere is high enough to give an equal sink rate. That is with a CO2 pressure in the atmosphere of 0.05/0.02 = 2.5 ppmv extra above steady state.
That the current sink rate is only half human emissions is simply because the extra pressure in the atmosphere is not high enough to remove all emissions in the same year as emitted: either double it to 220 ppmv above steady state (with constant emissions) or halve human emissions.
You are making up arbitrary rules, and treating CO2 from different sources differently. If half of human emissions remain in the atmosphere, then half of all emissions from any source must remain in the atmosphere. There is no way around this. To hold otherwise is a throwback to an age when, e.g., planets were said to arbitrarily move in perfect circles, for no particular reason than that being what the observers wanted to believe.
Bart,
For someone as brilliant as you are, you have obviously no idea how the real world works.
I am not treating CO2 from different sources different. I do treat different processes different.
What you don’t understand (or refuse to understand) is that different processes are at work in nature.
Most of the carbon cycles are temperature driven. That kind of processes doesn’t remove one gram of CO2 out of the atmosphere after a full cycle, no matter how much CO2 is in the atmosphere: as much CO2 is going in as is going out, as long as the temperature change (seasonal, year by year) remains the same. That is the case as good as for human as for natural CO2 in any mix which that moment is available in the atmosphere (or other reservoirs). That is largely the case for atmosphere-vegetation exchanges and partly the case for the ocean surface. That gives the ~5 years residence time of any CO2 molecule in the atmosphere.
Any additional CO2 injected in the atmosphere, whatever the origin (volcanoes, humans), has no influence on this process.
There IS a temperature controlled dynamic equilibrium between ocean surface and atmosphere, controlled by Henry’s law. Any change in that equilibrium, either in the ocean surface or the atmosphere will give a change in in/out fluxes between these two, trying to re-establish that equilibrium. The influence of temperature is exactly known: between 4-16 ppmv/K for short term to very long term changes (the latter including the deep oceans).
The influence of any extra CO2 pressure in the atmosphere above that equilibrium is exactly known too: a half life time of ~35 years. Or an order of magnitude slower than the residence time.
Again applicable for any mix of human and natural CO2 in the atmosphere. This is the process that is directly influenced by an extra injection of CO2 into the atmosphere.
If you don’t understand that difference in real world processes, completely based on observations, then any further discussion has no sense and you may add yourself to the gallery of misunderstood geniuses, together with Dr. Salby, Dr. Harde, Segalstad, Richard Courtney,…
Ferdinand, you seem to be relying on an assumption that the ocean surface releases CO2 in a response related solely to global average air temperature.
I referred you to a chart that showed the main bands of CO2 to be in the areas beneath the subtropical high pressure cells where most sunlight enters the oceans.
The implication is that the thermal energy in sunlight entering those regions drives CO2 out of the sunlit waters at a far greater rate than would be expected from the operation of Henry’s Law alone.
“What you don’t understand (or refuse to understand) is that different processes are at work in nature.”
It does not matter. They must all treat the same compound the same.
“That kind of processes doesn’t remove one gram of CO2 out of the atmosphere after a full cycle, no matter how much CO2 is in the atmosphere: as much CO2 is going in as is going out, as long as the temperature change (seasonal, year by year) remains the same.”
Assertion. Begging the question.
“There IS a temperature controlled dynamic equilibrium between ocean surface and atmosphere, controlled by Henry’s law.”
And, there is a temperature controlled dynamic equilibrium all the way down to the bottom of the oceans as well.
“…to the gallery of misunderstood geniuses, together with Dr. Salby, Dr. Harde, Segalstad, Richard Courtney,…”
I do not know much about the middle two, but am happy to be included with the first and last. He who laughs last has the loudest laugh.
Bart,
I know that you are narrow minded if your theory is even remotely in danger…
I never, ever, discriminated between CO2 sources. Thus please don’t repeat that kind of nonsense again and again. All extra CO2 is indiscriminately absorbed by any of the sink processes.
What you refuse to take into consideration is that there are differences in absortion rates in different kinds of processes: some processes are near indifferent for extra CO2 in the atmosphere, while quite sensitive for temperature changes, others are less sensitive for temperature changes and more sensitive for CO2 pressure changes in the atmosphere. There is the difference. Not in the origin of any (extra) CO2 of what is in the mass and mix in the atmosphere at any time.
Assertion. Begging the question.
The largest CO2 in and out fluxes are from the seasonal changes.
That is about 60 GtC in and out the biosphere and about 50 GtC out and in the ocean surface. Countercurrent for both and the net result is about 10 GtC in and out the atmosphere or average globally about 5 ppmv up and down.
That is already a point of disagreement: in/out fluxes are at no moment in time all together in the atmosphere as total input or as total output: thus the residual 10 GtC two-way seasonal cycle as measured in the atmosphere from the +/- 110 GtC in/out fluxes never “dwarfs” the one-way addition of 9 GtC human emissions over a year.
From 1984 to 2003.5 CO2 levels increased with 30 ppmv or about 10% CO2 increase in the atmosphere.
Temperature went up in the same period with 0.45°C. So far so good.
Did the seasonal cycle and net sink increase with 10% to remove all human CO2 of each year? Well let us look at the net result over two equal periods around the above years (*):
http://www.ferdinand-engelbeen.be/klimaat/klim_img/seasonal_CO2_MLO_BRW.jpg
Only near ground in the NH, there is a slight increase in seasonal amplitude, thanks to longer growth seasons and more CO2 in the atmosphere. At Barrow (and most all near surface NH stations), the change in amplitude for 10% CO2 increase in the atmosphere is ~2 ppmv on an amplitude of ~14 ppmv or about 7%. Not bad.
If we may assume that at maximum the near sealevel stations in the NH represent 1/4th of the total mass of CO2 in the atmosphere, then the change in seasonal amplitude is less than 2% for a 10% CO2 increase in the atmosphere. Not as good.
Not only that, it hardly did help in the removal of the extra CO2: the yearly emissions still were about twice the yearly removal of CO2, thus if we may assume a 50:50 absorption rate between oceans and vegetation, the increase in net sink rate for the second period was about 0.25 ppmv (0.5 GtC), within 110 GtC seasonal in/out fluxes. Simply negligible for a 10% increase of CO2 in the atmosphere.
Conclusion: a substantial increase of CO2 in the atmosphere has hardly any influence on the bulk of the natural in/out fluxes. The removal of any extra CO2, whatever the source, needs other processes…
And, there is a temperature controlled dynamic equilibrium all the way down to the bottom of the oceans as well.
Which needs at least 8 centuries to have any measurable influence on atmospheric CO2 levels…
————————————-
(*) these periods were taken as that was from the start of regular δ13C measurements at several stations, which proves that the main seasonal CO2 change is from NH extra-tropical vegetation. I can repeat that for the first and last decade of the full period of CO2 measurements.
Stephen,
The main release of CO2 from the oceans is due to the higher seawater temperatures near the equator and side bands, air temperatures are secondary. Sunlight of course is the main driver. The main CO2 releases are at the upwelling zones near the (Chilean/Peruvian) coast, where CO2 rich deep ocean waters are upwelling and are heatied up.
But I don’t think that there is more CO2 release than by the pCO2 difference between ocean surface and atmosphere per Henry’s law…
“Which needs at least 8 centuries to have any measurable influence on atmospheric CO2 levels…”
No, the influence is immediate. You must have balance between what is being transported into the surface system via upwelling, and what is being transported out via downwelling, or there will be an accumulation. The accumulation needs on the order of 8 centuries to equalize. During the interim, you get an approximately integral relationship from temperature anomaly to CO2.
Bart:
No, the influence is immediate. You must have balance between what is being transported into the surface system via upwelling, and what is being transported out via downwelling, or there will be an accumulation.
Bart, there is no observed huge change in deep oceans water circulation in the past centuries, except a seasonal and ENSO one. That is a matter of months to years. Even less for the CO2 concentrations in the deep water upwelling.
Even if there was a sudden increase in either amount of upwelling waters or concentration that would be met with a change in the atmosphere within a decade or two, fully compensating for the change in upwelling. Here for an enormous change of 10% in upwelling CO2 concentration:
http://www.ferdinand-engelbeen.be/klimaat/klim_img/upwelling_incr.jpg
Maximum 30 ppmv extra in the atmosphere in 1-2 decades for a huge change which in reality should be much smaller and may need millennia in the deep oceans.
The reaction of the ocean surface – atmosphere tandem is simply much faster than the changes in or exchanges with the deep oceans.
The influence of temperature on the in/out fluxes is similar and fully compensated with a change of 16 ppmv/K.
“Bart, there is no observed huge change in deep oceans water circulation in the past centuries, except a seasonal and ENSO one.”
Yet another assertion, along with fantasy math and a fantasy plot.
Bart,
Never heard of Le Chatelier’s principle? Is perfectly applicable for the dynamics between the atmosphere and the deep oceans…
“Never heard of Le Chatelier’s principle? Is perfectly applicable for the dynamics between the atmosphere and the deep oceans…”
Indeed, it is. The system will tend to resist a change in CO2 concentration due to our relatively tiny inputs.
Mass extinctions caused by — or occurring during — large increases in CO2 in the atmosphere? That gives me an idea for an SF short story, wherein such increases in CO2 cause some plants to become mobile and carnivorous — like Triffids.
Repeated from a long way above, since it replied to a comment 2 days ago so might not be seen by many.
George, Robert B:
I think the correlation is really quite simple. We know that CO2 follows temperature of the SH oceans, becuase of the yearly up-lesser down-bigger up pattern of the Mauna Loa CO2 measurements. We also know that CO2 levels are generally rising, at a fairly constant rate. When you differentiate the function, you remove that trend part, and so you remove the anthropogenic component, leaving the change-in-temperature component, which does indeed have a visible effect and reflects the oceans emitting and absorbing CO2 as they warm and cool.
Rich.
Fine except the seasonal component is determined by NH temperatures and the whole point was how fine the correlation is. Too small to be seen with a realistic uncertainty of measuring global levels from one spot and since many things affect the amount of CO2 in the atmosphere, highly unlikely that the rate really does follow temp.
“…highly unlikely that the rate really does follow temp.”
And yet that’s exactly what it has been doing for the past 59 years. We have the “southern ocean” clue, so maybe it IS simply of function of changing SSTs. At some point, if the correlation doesn’t break, even the ferds of this world will have to admit the the correlation is real. In fact, a prolonged cooling spell (and subsequent reduction in the growthrate) will largely debunk the notion that carbon growth is a function of the growing rate of human emissions…
Robert, as a request, should you ever post another piece, please get with anthony and/or moderation to keep the peops from going off topic. (don’t know if they will actually do that) We certainly don’t need courtney doing that. Someone upthread raised the question as to whether the correlation would hold in the early 20th century. i replied to that person, simply answered his concerns (with a graph made by ferdinand), and richard harped on me for being off topic. Moderation recently scolded steven mosher (of berkley earth) for the same behavior as richard’s. i’d much rather have heavy handed moderation than the heavy hand of another commentor (and a canadian at that!) telling me what to do here. That might help in making your post more personally rewarding for you and everybody else as well. i know richard has been around a long time, so he does have seniority here. (and i personally love the guy) But, PLEASE, don’t encourage his behavior…
Robert, why do you say that the seasonal component is determined by NH temperatures when your graph uses hadsst3sh (for Southern Hemisphere)? And personally, I think it is highly _likely_ that the rate of CO2 change follows temperature of the southern oceans, because that is where most of the water in the world is, and they do heat up in the austral summer.
Do you know any statistics? In order to be convincing you would need to compute an R^2 value or the like, with specific data, and then we could argue about what the result means.
Rich.
“When you differentiate the function, you remove that trend part, and so you remove the anthropogenic component…”
No, you remove the trend, i.e., the first order polynomial portion of the signal. But, the anthropogenic signal is made up of more than a trend. In particular, the trend itself has a trend, and that is not removed.
But, the temperature relationship already explains this trend of the trend. Hence, there is little to no room for anthropogenic forcing to fit. The conclusion is necessarily that anthropogenic forcing can have no significant impact.
Bart,
You do compare the trend in temperature with the trend in the derivative of the trend in CO2. That has no bearing in any physical process: either compare T with CO2 or dT/dt with dCO2/dt.
The trend in T results in maximum 16 ppmv/K increase in CO2 per Henry’s law and its variability is good for only +/- 1.5 ppmv around the total ~90 ppmv increase, which is caused by the ~170 ppmv human emissions.
The conclusion is necessarily that temperature can’t have a significant impact…
Unlike natural CO2 orbital OCO-2 nanoscanner has revealed anthropogenic CO2 organising itself like stargate replicators
http://media.moddb.com/cache/images/games/1/14/13378/thumb_620x2000/Replicator_Beetle1.jpg
It’s worse than we thought! In the fashionable state of heightened alarm /sarc is perhaps necessary.
On a more serious note. According to http://www.marinebio.net/marinescience/02ocean/hwgeo.htm Hawaii is in the middle of geological “hot spot”: Mauna Loa erupted in 1984 and Kilauea is considered to be one of the most active volcanoes on Earth today. On the seafloor 20 miles to the southeast of Hawaii is an active volcanic area with periodic eruptions.
Why would CO2 measurements over there reflect human activity only?
Jaakko,
They have a simple method to see if the CO2 levels are only from trade winds or when these are contaminated by volcanic vents: if the variability in CO2 within an hour (of 40 minutes 10-second snapshots + calibration) is more than 0.25 ppmv. the data are marked and not used for daily to yearly averages. Still available if you are interested.
If you still don’t trust the Mauna Loa data, you can use these from the South Pole: same trend, only lagging the NH data with a few ppmv. Or the “global” dataset: the average of several near sealevel stations, thus excluding Mauna Loa, the South pole,…
What about choosing e.g. the Easter Island, Chile instead?
https://www.esrl.noaa.gov/gmd/dv/data/index.php?site=EIC¶meter_name=Carbon%2BDioxide&frequency=Monthly%2BAverages
The datasets end there by dec 2015 but that is here not the point I guess. Let us compare the monthly outputs for jan till dec 2015:
Mauna Loa, USA
MLO 2015 1 400.05
MLO 2015 2 400.38
MLO 2015 3 401.58
MLO 2015 4 403.68
MLO 2015 5 404.16
MLO 2015 6 402.93
MLO 2015 7 400.93
MLO 2015 8 398.90
MLO 2015 9 397.66
MLO 2015 10 398.22
MLO 2015 11 399.95
MLO 2015 12 401.56
Easter Island, Chile
EIC 2015 1 397.12
EIC 2015 2 397.12
EIC 2015 3 397.09
EIC 2015 4 397.42
EIC 2015 5 397.02
EIC 2015 6 397.18
EIC 2015 7 398.18
EIC 2015 8 398.23
EIC 2015 9 398.13
EIC 2015 10 398.77
EIC 2015 11 399.22
EIC 2015 12 400.11
Both differ due to the different place: that can be accurately corrected.
You can compare Mauna Loa with the world’s mean: the difference is incredibly tiny.
Ferdinand
Clearly, your pertinent ignoring my question implies that you cannot present me with the balance sheet that I asked for. Therefore, your assumption that the increase in CO2 ‘must be causing some warming’ has no fundamental scientific proof. There is sufficient evidence I could provide suggesting that it could in fact be that the extra CO2 is cooling the atmosphere, as my summary of results here in South Africa seem to suggest.
Samuel
I remember we used to measure CO2 in nitrogen [or air?] quantitatively by using IR spectroscopy and a specific wavelength in the 4-5 um range, cannot remember the exact wavelength. I am not sure how it is done lately and I sure do not know how it was done before IR, but it might be someone here knows? That might be interesting to know.
henryp,
As we are discussing the variability of T and CO2, that is my priority these days, thus a little patience may be warranted on questions outside the topic…
I know the outgoing spectra of CO2 (Modtran), thus I can calculate the outgoing heat retention, but I have never looked at the CO2 influence on incoming spectra, thus I need to look at that first before I can give you an answer…
In the early days, the NDIR measuring equipment was calibrated with CO2 in N2 mixtures, out of fear for internal oxydation of the calibration gas containers. When was discovered in the early sixties that CO2 in N2 did give a difference in results than for CO2 in air, all equipment was recalibrated with CO2 in (dry) air mixtures and all previous results were adjusted accordingly. Since then still all calibrations are with CO2 in air. Most measurements still are with NDIR, as that is very robust and can be automated, unattended for weeks. Other techniques are used too: GC, mass spectroscopy, the latter when also isotopic compositions are desirable.
For the measurements/calibrations at Mauna Loa see:
https://www.esrl.noaa.gov/gmd/ccgg/about/co2_measurements.html
Accuracy of NDIR, which is frequently (every hour) calibrated, is better than +/- 0.2 ppmv.
The historical measurements were by wet chemicals methods, best accuracy around 3% or +/-10 ppmv. Needed a lot of skill, fresh reagents, frequent manual calibration,…
Ferdinand
You cannot ‘calculate’ that which has never been measured [yet]…..
Suffice to say that is very unlikely [to me] that the retention of emission 14-15 um [-88C?] will weigh up against the deflections of sunlight by the CO2 in the UV, 1-2um and 4-5 um ranges as the energy involved coming from the sun are multiples of the emissions coming from earth…
You would have to come up with some kind of a real life time experiment, perhaps like a grand scale high walled open box experiment, keeping CO2 on the ground high and at a controlled concentration, and determining the warming effect on the ground [compared to neighboring walled ground without added CO2] in W/m2 per 0.01% CO2 per day.
Good luck with that…..
Thanks for your explanation of methodology. That was interesting. What was the wavelength again that we used to measure the CO2?
Bartemis
Thanks for keeping the discussion here alive and for all your inputs. Like I said before, I think we are discussing non-issues because I could not detect any warming by CO2 in the data, e.g. according to my data, there has been no warming in the SH. So, I am sure you will agree with me that there is NO man made GLOBAL warming….
The lesson of scientific endeavors throughout the Enlightenment era to date is one of the pitfalls of relying on intuition. Intuition gave us leaches and bloodletting, epicycles and absolute time.
Intuition tells us that increasing CO2 should result in warmer surface temperatures. However, given the very poor track record of intuition, it is incumbent upon us to prove to a reasonable standard that it, in fact, does.
We have no such proof. We have no conclusive evidence of it at all. That is the point at which we stand today.
BTW: Intuition also told us our emissions were driving atmospheric CO2. That intuition was clearly wrong, too.
TWIMC: I have explained numerous times, here and at other venues, the fundamental flaw in the pseudo-mass balance argument. This absurd bit of illogic basically says that any change in the output state of a given system cannot be due to a given input if it is less than the sum total of a different input over all time.
It is innumeracy on stilts. It betrays an egregious lack of understanding of and familiarity with dynamic systems. I explained why here, for any who are interested.
Bart,
That “explanation” starts with a complete non-argument:
0.5*Ea := Ea + En + U
Basic error: at steady state, En and U are equal. When in the first year Ea is added, that doesn’t give enough extra pressure in the atmosphere to remove 0.5*Ea, as the observed sink rate is*0.02 Et, where Et is the total extra CO2 pressure in the atmosphere above steady state. That is not the extra pressure by human emissions of one year, except for the first year…
There is no reason at all to assume that the net result of all in/out fluxes is always half human emissions. It may be zero if we should halve our emissions today and it will assymptote to zero if we keep emissions constant for a long time, as CO2 levels in the atmosphere still go up, pushing more and more CO2 into the sinks, until the sinks equal the emissions.
Basics of a dynamic system in equilibrium is that any disturbance of the process is met with a response that tries to counter the disturbance. That is called Le Châtelier’s principle.
For the oceans starting with CO2 influxes and outfluxes in equilibrium (“steady state”) that gives that any extra CO2 injected in the atmosphere will be met with a change in the inputs and outputs that counters the disturbance: the pressure increase caused by the extra injection decreases the input from the upwelling waters and increases the output into the polar sinks of the oceans, thus effectively removing (part of) the injected amount.
How much is removed, can be calculated if the amounts injected are known and the resulting increase in the atmosphere is measured. That is the case for CO2 over the past 60 years. The current net sink rate is ~2.15 ppmv at a CO2 pressure above steady state of ~110 ppmv.
That gives an e-fold decay rate of the extra CO2 pressure of 110 / 2.15 ppm/year = ~51 years or a half life time of ~35 years, Quite constant over the past 60 years, thus a surprisingly linear process.
Next step is that you split the formula into:
0.5*Ea := Ea + En – Ua – Un
which says that nature on its own is
En – Un := Ua – 0.5*Ea
But, we don’t know Ua. If the sinks are very responsive, it can be as high as Ea itself, which leaves
En – Un = 0.5*Ea
Where you violate the fact that the sinks react equally to natural and human CO2:
If Ua equals Ea, then Un should equal En (if we assume the formulas are right, which they aren’t) with as result a zero change in the atmosphere, which violates the observed increase…
Another problem is that En and Un are largely temperature controlled processes and Ua is a pressure controlled process, not comparable at all: mostly independent of each other and with an order of magnitude difference in decay rates…
Further:
Human emissions increased a fourfold since 1958. If the sinks are very responsive (which they are not with a 0.02 sink rate), then En (and thus Un) MUST have increased a fourfold in lockstep with human emissions…
“Basic error: at steady state, En and U are equal.”
You have refuted yourself at the very first sentence. If the quantity is in motion, it is not in steady state.
“Where you violate the fact that the sinks react equally to natural and human CO2: If Ua equals Ea, then Un should equal En…”
Again, only in steady state, and we are not in steady state. The symbol “:=” means “approximately equal”. Yes, if Ua := Ea, then Un := En. But, that means that the difference between Ua and Ea is small, and cannot explain the rise we have seen. The difference between Un and En is small, too, but only in relation to Un or En themselves. But Un and En are so much larger than Ua and Ea that the difference between them can explain the rise that is seen.
The rest of your post is just gibberish. You are making up physical laws that hold only in the Fernandian universe. The sinks take up in proportion to the input. That is the entire input, both natural and anthropogenic. The sinks cannot treat inputs of the same substance differently.
“0.5*Ea := Ea + En + U” is not only a non-argument, it also a misrepresentation of the “SS argument”, which doesn’t involve the observation that the airborne fraction is about 0.5. After having had the mass balance argument explained to him so many times, it is disappointing (to say the least) that Bartemis can’t even give an accurate account of the argument.
The argument is actually
C’ = Ea + En – Un
which can be rearranged to give
En – Un = C’ – Ea
The observations tell us the RHS is negative, so algebra tells us the LHS is negative as well, hence we know the natural environment is a net carbon sink, and is opposing the rise, rather than causing it.
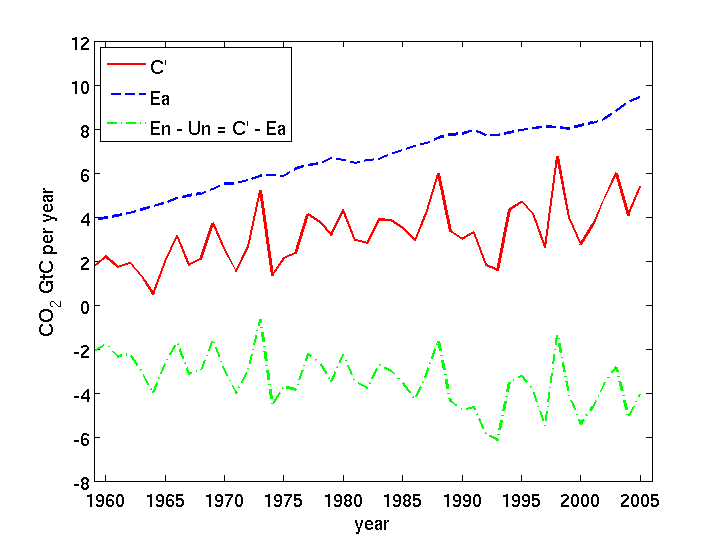
Note this isn’t a model of the carbon cycle and is not intended to be, it is just a constraint that the carbon cycle must obey in order to satisfy conservation of mass (which I think we can take a read). Sadly until Bartemis stops trying to treat it as a model of the carbon cycle, rather than just as a statement of a constraint on the carbon cycle, he is unlikely to make any progress.
BTW it isn’t a Skeptical Science argument, you can find it in the IPCC reports and plenty of journal papers on the carbon cycle.
This is absolutely idiotic. I have a response, but it is being delayed for reasons I do not know.
Ferdinand –
“Basic error: at steady state, En and U are equal.”
Wrong on the very first step. If a thing is in motion, it is ipso facto not at steady state!
“Where you violate the fact that the sinks react equally to natural and human CO2: If Ua equals Ea, then Un should equal En…”
The symbol “:=” means “approximately equal”. Yes, defintely, if Ua := Ea, then Un:= En. But, if Ua := Ea, it cannot be responsible for the overwhelming majority of the rise, whereas if Un := En, because the quantities are so much larger, they can.
Ferdinand –
“Basic error: at steady state, En and U are equal.”
Wrong on the very first step. If a thing is in motion, it is ipso facto not at steady state!
Mod – I have tried to post responses several times, and it is not coming through. Can you advise?
Thanks,
Bart
Bart,
Wrong on the very first step. If a thing is in motion, it is ipso facto not at steady state!
My God, don’t you have better arguments than that?
If we MAY start at some point in long gone times that the ocean surface was in steady state with the atmosphere and then we add some extra CO2 into the atmosphere, that will decay with an observed speed of 51 years e-fold rate or 35 years half life time or a fraction of 0.02 as sink rate. Thus in the first year of such an addition, not 50% but 98% of the first injection will remain in the atmosphere.
If we keep the injection constant for many years, the increase in the atmosphere will push more and more CO2 in the sinks, until the yearly injection and the yearly sinks are equal.
That is for an increase in the atmosphere of injection/year / 0.02.
The symbol “:=” means “approximately equal”. Yes, defintely, if Ua := Ea, then Un:= En. But, if Ua := Ea, it cannot be responsible for the overwhelming majority of the rise, whereas if Un := En, because the quantities are so much larger, they can.
Come on Bart, if Ua = Ea, then nothing happens with the atmospheric levels, see my first reaction.
The Un := En which “can” do “something” is just a modern form of handwaving…
BTW, in fact near all U is caused by human emssions, as near all increase in the atmosphere is from that source and thus all extra sinks, see again my first reaction…
Bart,
You have refuted yourself at the very first sentence. If the quantity is in motion, it is not in steady state.
If you never read beyond the first words, you can say any nonsense you want. I wrote my response with the situation starting at steady state, that is at a fixed temperature and no human additions. From that point on, any additional injection of CO2 – whatever the source – is removed with a ratio of 2% of the total increase in the atmosphere above steady state…
Un and En are so much larger than Ua and Ea that the difference between them can explain the rise that is seen
Just handwaving…
The sinks take up in proportion to the input. That is the entire input, both natural and anthropogenic.
The sinks do NOT take up in proportion to the input of one year. They take up in proportion to the total pressure in the atmosphere above steady state, whatever the cause and mix in the atmosphere. That is elementary physics of any dynamic process.
Still no answer to the fact that human emissions / increase / sinks increased a fourfold over the past decades while natural emissions didn’t? THAT is a real violation of the equality of CO2 whatever the source for the sinks…
“…if Ua = Ea, then nothing happens with the atmospheric levels…”
But, I never said Ua = Ea. I said Ua := Ea. It is a very important distinction.
The very essence of engineering is taking limits, and noting what happens when one approaches a given condition. In this case, Ua := Ea means the sinks take out nearly all of the anthropogenic input, which in turn means that the discrepancy must be made up by natural input/output conditions.
You seem to be very uncomfortable with what is basic engineering practice, which is why I think you really don’t have a lot of experience with dynamic systems, and you really should not be posing as an expert on these issues.
“Just handwaving…”
No. It really is not handwaving. It is very well grounded. The natural flows are very significantly greater than the anthropogenic contributions. Estimates are on the order of 33X as large, and it could easily be much higher. That’s at least one and a half orders of magnitude. It’s huge.
“Still no answer to the fact that human emissions / increase / sinks increased a fourfold over the past decades while natural emissions didn’t? THAT is a real violation of the equality of CO2 whatever the source for the sinks…”
Atmospheric CO2 buildup can come about in two ways: 1) from increasing input 2) from decreasing output. As you well know, my hypothesis is that temperature is modulating the output, with a decrease in the amount that downwells with ocean currents as the temperature rises.
But, there could have been rising natural emissions as well. The fact is, we do not know, and cannot tell with the information currently available. The information we do have simply tells us the rise is temperature dependent, and is therefore not anthropogenically driven. No other observation uniquely establishes attribution, but this does.
Bart:
The information we do have simply tells us the rise is temperature dependent, and is therefore not anthropogenically driven. No other observation uniquely establishes attribution, but this does.
The information we have from basic physics is that any rise in temperature of the oceans gives not more than 16 ppmv/K per Henry’s law. Proven over 800,000 years of ice core measurements. Proven by over 3 million recent seawater samples. The rest of the 110 ppmv above steady state is not from the temperature rise.
Not only has the slope of T only a small influence on CO2 levels and is the match between T and dCO2/dt entirely spurious, it is not unique, as human emissions show exactly the same curvatory at twice the increase in the atmosphere, without violating any observation…
Looks like I will have to repost my response. This is very annoying, especially because the subject is so monumentally blinkered. Computer scientists like DM should not be engaging in scientific discussions for which they have no training or aptitude. This is actual physics, not manipulation of 1’s and 0’s.
Ferdinand –
“Basic error: at steady state, En and U are equal.”
Wrong on the very first step. If a thing is in motion, it is ipso facto not at steady state!
“Where you violate the fact that the sinks react equally to natural and human CO2: If Ua equals Ea, then Un should equal En…”
The symbol “:=” means “approximately equal”. Yes, defintely, if Ua := Ea, then Un:= En. But, if Ua := Ea, it cannot be responsible for the overwhelming majority of the rise, whereas if Un := En, because the quantities are so much larger, they can.
DM –
Just stop. Please. It is painful to watch you flail about with such limited understanding.
“En – Un = C’ – Ea”
No.
En – Un = C’ – (Ea – Ua)
A portion of the sinks is necessarily a response to anthropogenic forcing. That is how a dynamic system works. And, if Ea := Ua, then nature, on its own, is a net source.
Ferdinand –
“Basic error: at steady state, En and U are equal.”
Wrong on the very first step. If a thing is in motion, it is ipso facto not at steady state!
“Where you violate the fact that the sinks react equally to natural and human CO2: If Ua equals Ea, then Un should equal En…”
The symbol “:=” means “approximately equal”. Yes, defintely, if Ua := Ea, then Un:= En. But, if Ua := Ea, it cannot be responsible for the overwhelming majority of the rise, whereas if Un := En, because the quantities are so much larger, they can.
DM –
“En – Un = C’ – Ea”
No.
En – Un = C’ – (Ea – Ua)
A portion of the sinks is necessarily a response to anthropogenic forcing. That is how a dynamic system works. And, if Ea := Ua, then nature, on its own, is a net source.
I note that Bartemis has not acknowledged his misrepresentation of the “SS argument”.
Ua is essentially zero. Anthropogenic uptake of carbon from the atmosphere is negligible.
“A portion of the sinks is necessarily a response to anthropogenic forcing. ”
As I said:
“Note this isn’t a model of the carbon cycle and is not intended to be, it is just a constraint that the carbon cycle must obey in order to satisfy conservation of mass (which I think we can take a read). Sadly until Bartemis stops trying to treat it as a model of the carbon cycle, rather than just as a statement of a constraint on the carbon cycle, he is unlikely to make any progress. “
You are still trying to treat the mass balance equation as a model instead of merely a constraint.
No! That is your mistake. Ua is not anywhere close to zero.
This is a dynamic system. The system responds to the inputs. Ua is necessarily proportional to the input.
Ua is uptake by anthropogenic sinks, not uptake of anthropogenic emissions.
“Ua would be the uptake of carbon due to anthropogenic activities, but this is essentially zero, so we can safely exclude it from the analysis.”
Perhaps you need to take the time to understand the mass balance argument before dismissing it.
Also you are STILL trying to treat the mass balance equation as a model of the carbon cycle, rather than just a constraint that it obeys. How many times does this need to be pointed out to you?
If you want to arbitrarily define Ua that way, then you are missing still another term which is uptake of anthropogenic emisssions.
You cannot neglect that term. It would not exist without the anthropogenic input. You seem to think nature takes only a fixed amount, and no more. That is incorrect. This is a dynamic system. It responds to all forcing. It expands in response to all additional forcing.
You just have no idea what you are talking about. You have no training in this field. You have no understanding of what a dynamic feedback is. I personally find it offensive. You are a blind man presuming to lead the blind.
Bartemis, not only are you showing that you can’t set out the mass balance argument accurately, but that you also fundamentally don’t understand it.
“If you want to arbitrarily define Ua that way, then you are missing still another term which is uptake of anthropogenic emisssions.”
Ua has been defined that way (uptake by anthropogenic sinks – e.g. carbon capture and sequestration), because that is the only definition which is consistent with the definitions of Un (uptake BY natural sinks), En (emissions FROM natural sources) and Ea (emissions FROM anthropogenic sources). Again you are trying to treat the mass balance equation as if it was a model of the carbon cycle, rather than a simple statement of a constraint that it must obey. You will make little progress until you stop making this error.
BTW are you willing to admit that you misrepresented the “SS argument”?
“Ua has been defined that way (uptake by anthropogenic sinks – e.g. carbon capture and sequestration), because that is the only definition which is consistent with the definitions of Un (uptake BY natural sinks), En (emissions FROM natural sources) and Ea (emissions FROM anthropogenic sources).”
Then, in your description, Un is necessarily a function of both En AND Ea. The term
En – Un = C’ – Ea
is actually
En – Un(En,Ea) = C’ – Ea
The part on the left is not independent of Ea, therefore, you cannot say that nature on its own is a net sink. You must show that En – Un(En,0) is negative for nature to independently be a net sink. You can linearize about this point:
En – Un(En,Ea) := En – Un(En,0) – P*Ea
where P is the partial derivative of Un with respect to Ea evaluated at (En,0). That gives you
En – Un(En,Ea) = C’ – (Ea – P*Ea)
If the partial derivative is near unity (and, the evidence indicates it is), then
En – Un(En,Ea) := C’
and nature on its own is a net source.
I do not expect you to understand all this, because you have shown you are an idiot. But, for others, that is why the pseudo-mass balance argument is dumb, dumb, dumb, dumb, dumb.
Mod – could you please show my response in full? Yes, it is caustic. Deservedly so. This guy is an idiot.
At least I don’t have to repeatedly misrepresent my interlocutors arguments and then avoid admiting it when it is exposed by being insulting. That is no way to discuss science, because as I pointed out, being insulting leaves you in a position where you cannot admit you are wrong without looking a complete fool, and the ability to be able to admit you are wrong is a necessary component of science.
I’ve not misrepresented a thing. You are implicitly making a claim that nature is static, and has no response to anthropogenic forcing.
You have arbitrarily defined “nature”, and set it apart. But, the natural sinks are inextricably intertwined with the anthropogenic input. So, when you write
En – Un = C’ – Ea
you actually mean
En – Un(En+Ea) = C’ – Ea
i.e., Un is a function of both natural and anthropogenic inputs. It is not a constant, it is dynamic. It has a definite sensitivity to the forcing level. As a result, saying En – Un(En+Ea) is less than zero does NOT say nature is a net sink. That would only be the case if you could say En – Un(En) is less than zero.
But, you can linearize, and say that
En – Un(En) – P*Ea := C’ – Ea
where P is the partial derivative of Un with respect to Ea. Then,
En – Un(En) := C’ – (Ea-P*Ea )
If the partial derivative is near unity, then nature is a net source. And, the data indicate that P is, indeed, near unity.
Bartemis wrote “I’ve not misrepresented a thing.”
O.K., give a URL for a Skeptical Science post where I gave an argument including “0.5*Ea := Ea + En + U”, which you assert to be part of the “SS argument”.
“You have arbitrarily defined “nature”, and set it apart”
This is absurd, the definition of “natural” (“existing in or derived from nature; not made or caused by humankind.”) in this context is obvious and straightforward and not in the least arbitrary.
“i.e., Un is a function of both natural and anthropogenic inputs. ”
The mass balance equation is not a model of the carbon cycle, just a statement of a constraint that must apply to it, you will not understand the argument until you stop making this error.
“The mass balance equation is not a model of the carbon cycle, just a statement of a constraint that must apply to it…”
Then, it has nothing to say on the matter of attribution, and is useless.
Yes it does have something to say about attribution because (i) we have observations and (ii) we have a constraint that we know applies to the carbon cycle, and the fact that total uptake by natural sinks is greater than total emissions from natural sources can be derived from those two facts. This means that the natural environment is a net carbon sink and hence is opposing the rise not causing it.
Bartemis wrote “I’ve not misrepresented a thing.”
I replied “O.K., give a URL for a Skeptical Science post where I gave an argument including “0.5*Ea := Ea + En + U”, which you assert to be part of the “SS argument”.
The lack of a URL from Bartemis is a tacit admission that he misrepresented my argument, and he knows perfectly well that he misrepresented it.
” This means that the natural environment is a net carbon sink and hence is opposing the rise not causing it.”
No, nature by itself is a net source. You can only call it a net sink if you illegitimately include the natural response to anthropogenic forcing on the “natural” side of the ledger. But, if you take away the anthropogenic forcing, that response fades away, the sink activity shrinks, and natural source activity exceeds it.
I know you do not understand this. That is because you are an idiot. But, perhaps it will be helpful for non-idiots reading this exchange.
Bartemis wrote “No, nature by itself is a net source. ”
This is obviously incorrect, because if both nature and mankind were net sources , then atmospheric CO2 levels would be rising faster than either, as both would be contributing to the rise. However, this is not what we observe, what we observe is that atmospheric CO2 is rising more slowly than the rate of anthropogenic emissions, which means the net result of everything else (i.e. the natural carbon cycle) must be a net carbon sink.
still no URL…
“This is obviously incorrect, because if both nature and mankind were net sources , then atmospheric CO2 levels would be rising faster than either, as both would be contributing to the rise.”
That is incorrect. The rise is only a fraction of total forcing.
Both are contributing to the rise, but in proportion to the feedback factor, each one in the same ratio, as they must. As that ratio is small, anthropogenic forcing cannot account for the lion’s share of the rise.
Bartemis wrote: “Both are contributing to the rise, but in proportion to the feedback factor, each one in the same ratio, as they must. ”
No, if both were contributing to the rise in any proportion, then atmospheric CO2 levels would be rising faster than anthropogenic emissions, but that is not what we observe. The fact that the increase is slower than the rate of our emissions means that the natural carbon cycle is opposing the rise, which is just what you would expect from Le Chatellier’s principle (if you perturb a system away from it dynamic equilibrium, the feedback mechanisms will respond to oppose that perturbation).
“O.K., give a URL for a Skeptical Science post where I gave an argument including “0.5*Ea := Ea + En + U”, which you assert to be part of the “SS argument”.”
In your equation, C := 0.5*Ea. That is how you make your conclusion.
“This is absurd, the definition of “natural” (“existing in or derived from nature; not made or caused by humankind.”) in this context is obvious and straightforward and not in the least arbitrary.”
The expansion of the natural sinks in response to anthropogenic forcing is caused by humankind. Therefore, by your definition, they are not natural.
You are twisting yourself in knots with word games. But, the fundamental fact is that sink activity depends intimately on the total amount of forcing, and anthropogenic inputs are a part of that total forcing.
Bartimus wrote ““O.K., give a URL for a Skeptical Science post where I gave an argument including “0.5*Ea := Ea + En + U”, which you assert to be part of the “SS argument”.”
In your equation, C := 0.5*Ea. That is how you make your conclusion.”
That is not a URL. Neither is it my equation, but a quote from your misrepresentation of it. Show me where *I* said that as part of the mass balance argument, not where you said I said it.
“The expansion of the natural sinks in response to anthropogenic forcing”
The expansion of natural sinks is not in response to anthropogenic forcing, but in response to rising atmospheric CO2 levels. However, this is just another attempt to treat the mass balance equation as a model of the carbon cycle, rather than as a constraint. If you persist in making this error, you will make no progress. I may have mentioned this before.
“The expansion of natural sinks is not in response to anthropogenic forcing, but in response to rising atmospheric CO2 levels.”
Which is itself a response to total forcing. You can’t wriggle out of it this way. A function of a function is just another function.
“However, this is just another attempt to treat the mass balance equation as a model of the carbon cycle, rather than as a constraint.”
A useless constraint on the question of attribution.
““The expansion of natural sinks is not in response to anthropogenic forcing, but in response to rising atmospheric CO2 levels.”
Which is itself a response to total forcing. You can’t wriggle out of it this way. A function of a function is just another function.”
So you would agree that anthropogenic emissions are causing atmospheric CO2 levels to rise?
If not, please explain how the expansion of natural sinks can be in response to anthropogenic forcing (via rising atmospheric CO2 levels) if anthropogenic forcing is not causing atmospheric CO2 levels to rise.
I am still waiting for the URL that demonstrates you did not misrepresent me.
“So you would agree that anthropogenic emissions are causing atmospheric CO2 levels to rise?”
Of course they are. But, only by a small percentage of the total observed rise.
Here is a URL. You stated, exactly
C’ = Ea + En – Un
Substitute C’ := 0.5*Ea and U = -Un to get
0.5*Ea := Ea + En + U
This is elementary algebra. I sense an attempt at misdirection.
I am tired of putting on a show of negotiation here, as if our viewpoints were equally valid. They are not. DM has a totally misbegotten viewpoint of how feedback systems work.
This is the equation:
En – Un(En+Ea) = C – Ea
If we take En0 to the the nominal natural input at the beginning of the 20th century, then using the partial derivative P of Un evaluated at En0, we have
En-En0 – P*(En+Ea-En0) := C-C0 – Ea
The total observed rise is then
C – C0 = (1-P)*(En-En0 + Ea)
The observed rise is approximately C – C0 := 0.5*Ea, which means that if P is greater than 0.5, then Ea necessarily cannot account for the entire rise. As P approaches unity, it can provide less and less of the overall rise.
The rate of change of CO2 to temperature relationship indicates that P is near unity, and most of the rise has to come from the (1-P)*(En – En0) term, i.e., it is almost totally natural.
Bartemis wrote “Here is a URL. You stated, exactly
C’ = Ea + En – Un
Substitute C’ := 0.5*Ea and U = -Un to get
0.5*Ea := Ea + En + U
This is elementary algebra. I sense an attempt at misdirection.”
This is deeply dishonest. I did write “C’ = Ea + En – Un”, but the rest is Bartemis’ invention, that he tried to pass off as being mine. The only place in that comment where I mention “0.5” is where I am quoting Bartemis’s misrepresentation of the argument!
““0.5*Ea := Ea + En + U” is not only a non-argument, it also a misrepresentation of the “SS argument”, which doesn’t involve the observation that the airborne fraction is about 0.5. After having had the mass balance argument explained to him so many times, it is disappointing (to say the least) that Bartemis can’t even give an accurate account of the argument.”
How utterly cynical.
Bartemis wrote:
““So you would agree that anthropogenic emissions are causing atmospheric CO2 levels to rise?”
Of course they are. But, only by a small percentage of the total observed rise.”
In which case anthropogenic emissions are causing only a small percentage of the expansion of the natural sinks (which respond to changes in atmospheric CO2 levels). So what is causing the majority of the expansion of the natural sinks?
“So what is causing the majority of the expansion of the natural sinks?”
It’s all proportional, and it works out as I have indicated:
C – C0 = (1-P)*(En-En0 + Ea)
If P is near unity, and observations indicate it is, then the overall impact of Ea is small.
This is textbook feedback. Nothing at all unusual or exotic about it.
“It’s all proportional, and it works out as I have indicated:”
saying “its all proportional” is not saying where the “the majority of the expansion of the natural sinks?”, it is just obfusacation. If the natural sinks expand in response to increasing atmospheric CO2 and anthropogenic forcing has only caused a small proportion of the increase in atmospheric CO2, then it has only caused a small proportion of the expansion of the sinks. So what physical process causes the rest of the expansion of the sinks?
I note that Bartemis is ignoring the fact that the URL he gave to show he hadn’t misrepresented me only confirms the fact that he had, as the “In your equation, C := 0.5*Ea. That is how you make your conclusion.” was never part of my argument, but Bartemis claims that it is and just keeps doubling down when his dishonesty is demonstrated.
Not negotiating. It is not my problem that you do not understand even the most rudimentary dynamic systems theory.
Bartemis wrote “Not negotiating.”
This isn’t a negotiation. I have (repeatedly) shown that you have dishonestly misrepresented my arguments, and you are given a chance to prove that you didn’t. All you are doing by responding in this way (i.e. bluster) is demonstrate to everybody that you know that you misrepresented me, and doing so doesn’t bother you. Not responding would be a more rational option, at least then you could pretend you were unaware of your misrepresentation, rather than compounding it.
Eeeeh
Eish
Eeee
I have never seen so many people saying so much about ……nothing…..really…!@ur momisugly!
More carbon is better and does not cause any warming.
The pseudo-mass balance argument is the fundamental underpinning behind the belief that human activity is driving atmospheric CO2 concentration. It forms the foundation for their faith.
All the talk about isotope ratios, all the other crap, these are just rationalizations piled on top. They believe they are fundamentally right because they accept the premise of this very silly argument.
It isn’t so. The pseudo-mass balance argument has no impact on the question of attribution. It is merely a trivial tautological statement, sprinkled with a wholly-disconnected-from-reality inference of a static sink response.
Bart,
Again you are a master in mispresenting other’s opinion, conscious or not.
The mass balance is the most important point and you need to have extremely good arguments to prove that humans are not the cause of the increase in the atmosphere while we emit twice the amounts still residing in the atmosphere. Including the fourfold rise in emissions and a similar fourfold rise in increase in the atmosphere and a fourfold increase in the net difference: the net sink rate.
I am still waiting for your explanation for the absence of any indication that the natural carbon cycle also increased a fourfold in the same period, as that violates the equality of all CO2 – whatever the source – for the sinks if human CO2 was not the cause of the atmospheric increase…
There are several other additional arguments, which exclude oceans and vegetation as main sources of the increase:
– the oxygen balance
– the pre-WWII drop in 14C levels
– the 13C/12C ratio decay rate
– the ocean surface pH, pCO2 and DIC measurements
See further: http://www.ferdinand-engelbeen.be/klimaat/co2_origin.html
Without the oceans or the biosphere as main sources and human emissions as highly probable source it is just a waste of everybody’s time to insist that humans are NOT the cause of the increase, only based on curve fitting of two straight lines on very shaky grounds…
Well, Ferdinand, I think that if you did not have the crutch of the pseudo-mass balance argument, you would begin looking more closely at those other evidences, and realize that they are merely consistent, but not uniquely so, with the notion that humans are in control of atmospheric CO2.
I am going to kick that crutch out from under you if it kills me. Because it is utterly false. There is no requirement that the rise must be from anthropogenic releases of CO2, merely because the rise is less than the sum total of all human release of CO2. That is like saying that if a lake rises 2 feet, and the sum total of rain 30 years ago would have raised it 4 feet, then the rise is from the 30 year ago rains.
It doesn’t work like that. The water from those rains has long since dissipated. The CO2 from earlier in the past century has long since dissipated. It is not accumulating. The flows are continuous, and they sweep it away.
Bart,
If the mass balance was the only argument, we could have a discussion about the influence of the carbon cycles on the increase, but the other evidence, based on observations is unambiguously:
– The oceans can’t be the source of the extra CO2, as the 13C/12C ratio is higher than in the atmosphere (including the isotopic shift at the surface), thus substantial emissions, or even increased circulation, from the oceans (deep or surface) would increase the 13C/12C ratio of the atmosphere, while we see a huge drop: 10 times the change measured in ice cores over 800,000 years or coralline sponges between 600 – 170 years ago.
– The oceans can’t be a source as the measured pCO2 difference over all oceans is 7 μatm higher than in the atmosphere, thus the net flux is from the atmosphere into the ocean surface (including the upwelling and sink areas), not reverse.
– The ocean surface in general (excluding the main source/sink places) can’t be the source, as DIC (total inorganic carbon) increased in lockstep with the increase in the atmosphere while the pH (slightly) dropped. If the extra CO2 in the atmosphere was from the ocean surface, DIC would drop and pH would go up.
Three separate lines of evidence that show that the oceans are not the cause of the increase in the atmosphere, to the contrary, they are major sinks.
For the biosphere, that is quite simple: plant growth produces O2, plant decay/digestion uses O2. The O2 balance shows that the biosphere is a growing net sink for CO2, the earth is greening, confirmed by satellite measurements of chlorophyl.
Thus where does the extra CO2 comes from, as neither the oceans or vegetation are the sources?
“Thus where does the extra CO2 comes from, as neither the oceans or vegetation are the sources?”
The oceans are the source. But, it does not require additional input from upwelling transport. It can as easily be from a temperature induced restriction of downwelling transport.
This is a balanced process. Modulation of the flow at either end causes change.
Bart,
The oceans, including the source and sink places, are measured net sinks for CO2 from the atmosphere. There is simply no restriction in sink capacity near the poles, despite an overall increase in temperature of the ocean surface…
“The oceans, including the source and sink places, are measured net sinks for CO2 from the atmosphere.”
That is circular reasoning.
“There is simply no restriction in sink capacity near the poles, despite an overall increase in temperature of the ocean surface…”
Assertion. Begging the question.
Bartemis says: ““The oceans, including the source and sink places, are measured net sinks for CO2 from the atmosphere.”
That is circular reasoning.”
So inferring that the oceans are net sinks from measurements that show the oceans (including the source and sink places) are net sinks is “circular reasoning”? Sorry, that is an absurd objection, the reasoning could hardly be more linear.
“…measurements that show the oceans (including the source and sink places) are net sinks…”
There are no such measurements. When you understand the math, you will understand why.
Bart,
As usual, you reject any observation that counters your almighty theory.
At every place over the oceans where frequent samples were taken, the carbon content goes up and pCO2 goes up, following, not leading, the change in the atmosphere. Combined over the full ocean surface, that shows that there is a small, but measurable average pCO2 difference between atmosphere and oceans, slightly higher in the atmosphere. That is what is measured. No theory as nice as yours can withstand an observation that proves it wrong. Let it be that your theory not only violates this one, but every single other observation that was taken over the years.
Thus sorry, either accept that your theory is wrong, or come with extremely good arguments that the observations must be wrong.
That is circular reasoning. without a shred of evidence why it would be a circular argument is anyway not a valid argument…
“As usual, you reject any observation that counters your almighty theory.”
No, I reject quack observations like the pseudo-mass balance argument. I have shown in mind-numbing detail why it is stupid beyond measure.
“…following, not leading, the change in the atmosphere.”
Nonsense. You cannot tell what is leading and what is following by taking a few isolated measurements. You are asserting something for which you have no evidence. And, judging by the comments, I am not the only one who has noticed your tendency to do this.
Bart:
Nonsense. You cannot tell what is leading and what is following by taking a few isolated measurements. You are asserting something for which you have no evidence.
Already forgotten?
Every place in the oceans where is measured over longer periods shows that DIC (total inorganic CO2) is increasing (and pH slightly decreasing) in lockstep with CO2 in the atmosphere. That can only be the case if CO2 enters from the atmosphere into the oceans, not reverse.
———————————————–
Bart, you only have shown that you are not reasonable at all.
Not one observation backs your theory. All observations – even if they are sparse – refute your theory.
So the observations must be wrong, as your theory is right and above any doubt and not refutable, because then you refute the observations…
Even when there is an alternative “theory” which simply obeys the mass balance and fits all observations, That can’t be right, as your theory is the one and only and there is no place for any alternative…
Sorry Bart, that is not science, that is fanatism.
“That can only be the case if CO2 enters from the atmosphere into the oceans, not reverse.”
Absolute nonsense. It is a symmetric relationship. You cannot determine causality merely by noting that both are doing the same thing.
The only observation that is unique as far as attribution is concerned backs me up: the rate of change of CO2 concentration is proportional to temperature anomaly. None of your wailing can change that.
That observation contradicts the hypothesis that humans are driving concentration.
It’s not a close call. You will see, as events unfold.
Bartemis wrote “There are no such measurements”
yes, there are, Ferdinand has already pointed them out to you. Saying they don’t exist won’t make them disappear, no matter how many times you say it.
Bartemis writes “No, I reject quack observations like the pseudo-mass balance argument”
In that case Bartemis rejects the principle of conservation of mass and a bit of basic algebra, which is all that the mass balance analysis actually consists of. A theory of the carbon cycle that doesn’t obey conservation of matter (i.e. carbon is spontaneously created or destroyed, rather than merely transferred from one reservoir to another) is absurd, but those would be the only theories where the mass balance analysis does not apply.
Bart:
Absolute nonsense. It is a symmetric relationship. You cannot determine causality merely by noting that both are doing the same thing.
Bart, you are only digging deeper in the pit you have digged for yourself.
Basic chemistry of the oceans:
If the CO2 flux is from the ocean surface into the atmosphere, then DIC (CO2 + bicarbonates + carbonates) decreases and pH increases.
If the CO2 flux is from the atmosphere into the ocean surface, then DIC (CO2 + bicarbonates + carbonates) increases and pH decreases.
The latter is what is observed.
What is further observed:
– The drop in δ13C in the ocean surface simply follows the one in the atmosphere. There is no low-13C CO2 source in the ocean surface or deep oceans. Biolife even increases the δ13C level in the surface…
– Measurements all over the oceans show an average pCO2 difference of ~7 μatm higher in the atmosphere than in the ocean surface, including the source and sink places. The latter show the lowest pCO2 levels, thus the highest sink rates.
– There is no indication of any reduction in sink rate over time. To the contrary, the pCO2 difference at all places where pCO2 is measured over longer periods show an increasing pCO2 difference, thus more uptake, in ratio to the extra pressure in the atmosphere…
“If the CO2 flux is from the ocean surface into the atmosphere, then DIC (CO2 + bicarbonates + carbonates) decreases and pH increases.”
You are using a straw man argument here. It is not an outgassing of the surface oceans per se that is causing the atmospheric buildup, i.e., not a simple rebalancing between the oceans and atmosphere. It is a buildup within the surface ocean layer due to temperature dependent restriction of outflow.
Increasing content of the oceans necessarily results in increasing content of the atmosphere. The DIC (CO2 + bicarbonates + carbonates) increases and pH decreases, exactly the same as it would for the symmetric case where there is inflow to the atmosphere.
Bart,
Keep on digging:
It is a buildup within the surface ocean layer due to temperature dependent restriction of outflow.
Warmer oceans are more depleted of CO2 than cooler oceans.
When a parcel water flows from the upwelling place to the sink place, that loses or absorbs CO2 in ratio to the pressure difference with the atmosphere. That changes from overpressure near the equator to underpressure near the poles.
Everywhere the temperature changes, the pCO2 of the ocean surface changes with 16 μatm/K. Thus more CO2 is released into the atmosphere and for equal CO2 upwelling the downwelling waters are depleted of CO2, compared to before the temperature increase.
Thus with warmer ocean surface waters, there is no buildup of CO2 in the water itself, it builds up in the atmosphere and the waters sink with less CO2.
That is until the CO2 buildup in the atmosphere is high enough to compensate for the warmer ocean surface.
That is at ~16 ppmv/K in both directions…
No. There are more CO2 laden waters upwelling every second. If that CO2 is restricted from downwelling at the exact same rate, there will be an accumulation.
You are still stuck in a static world. That is not this world.
Bart,
Indeed you do keep digging…
No. There are more CO2 laden waters upwelling every second. If that CO2 is restricted from downwelling at the exact same rate, there will be an accumulation.
You are still stuck in a static world. That is not this world.
You really don’t understand what a simple, not so complex dynamic system in the real world is.
I am talking about the full dynamics of the oceans:
At one (warm) side of the world, CO2 is released, depending on quantity of water upwelling, temperature and C concentration in the water and CO2 concentration in the atmosphere. Let’s say 10,000 tons CO2/minute.
At the other (cold) side of the world, CO2 is removed, depending of the concentration in the atmosphere and the quantity of water downwelling, temperature and C concentration in the waters, say again 10,000 tons CO2/minute.
As far as I know that is a prototype of simple straightforward dynamic process.
Now, for any reason (melting ice pack…) the sink places warm up with 1 K in temperature. That gives a static increase per Henry’s law of 16 μatm pCO2 at every m2 of the oceans where the temperature did increase with 1 K.
Because of that, less CO2 is absorbed in the sinking waters, as the sink rate is directly proportional to the pCO2 difference between atmosphere and ocean surface. Let’s say the sink rate drops to 9,500 tons/minute.
The difference between the incoming 10,000 and outgoing 9,500 tons/minute remains in the atmosphere, increasing the CO2 pressure in the atmosphere.
The increase in CO2 pressure in the atmosphere has a twofold effect: it reduces the pCO2 difference and thus the CO2 release at the upwelling sites and increases the pCO2 difference and uptake at the downwelling sites. Until both are at 9,750 tons/minute. That is at an increased pressure in the atmosphere of 16 μatm (ppmv).
That is fully dynamic. Not by coincidence the same value as for a single sample of seawater per Henry’s law…
BTW, for an asymmetric temperature increase at the sink places, the in/out fluxes are ultimately reduced and the difference remains in the ocean surface. The 250 tons CO2/minute difference is simply transported from sources to sinks with the waters, not via the atmosphere…
It doesn’t work that way, Ferdinand. Far from forcing CO2 back down, the release of the gas from the upwelling waters produces less overall partial pressure with which to force downwelling.
That is because every ounce of it that goes into the air is that much less that is flowing via the ocean currents from the upwelling areas to the downwelling ones.
Let me repeat that:
That is because every ounce of it that goes into the air is that much less that is flowing via the ocean currents from the upwelling areas to the downwelling ones.
It’s a zero sum game. What you take out to put in the atmosphere has to come from somewhere. It comes from the oceans itself. You have devised a perpetual motion machine in which atmospheric partial pressure comes from nowhere, and adds to the already existing partial pressure in the oceans.
The atmospheric pressure does not force CO2 into the water. The waters are depleted by the flow into the atmosphere. The net effect of atmospheric pressure is zero. Actually, slightly less than zero, as it acts as a pressure release valve.
What you seem to want not to understand, or to avoid understanding, is that this is not a shallow pond of water. The processes which produce equilibration between the ocean/air interface must be replicated all the way down to the depths. The entire ocean undergoes a top to bottom change via the very slow processes of advection and diffusion. In the near term, the surface oceans gain concentration, and the atmosphere necessarily gains, too, in an accumulation such that the rate of change is proportional to the temperature anomaly.
Now, if you had a shallow pond of water, these processes would work out in short order, and you would reestablish a steady state condition rapidly following a change in temperature. But, this is not a shallow pond of water. This is the oceans, which run deeper than the tallest peak is tall, and have a total mass of 1.4 yotta grams. Nothing that involves that ginormous a mass is going to happen quickly. It is absurd to imagine it so.
Here is a concrete example. I have a sink, i.e., a lavatory, and it has a flow of water coming in such that the balance between inflow and outflow through the drain produces a steady state 5 cm water level.
I now close the drain halfway and, based on the rate of inflow and the size of the sink, I can calculate that it will take 10 minutes for the water to reach the 10 cm mark. It will follow an exponential curve so, for the first minute or so, the rise will be remarkably linear.
Ferdinand is saying that, without changing the rate of inflow or the drain configuration, I can stop the rise if I merely divide the inflow so that some flows through a separate channel (that separate channel is analogous to the atmospheric uptake of CO2, which is just that: a diversion of the flow from the ocean currents). He says that the extra pressure from the separate flow will force more water down the drain. But, that ignores the fact that the other flow will no longer be the full flow.
It would be doing work on the flow, forcing water down the drain, merely by dividing it. That requires free energy. It is perpetual motion of the first kind (work without the input of energy). It is quite impossible.
Bart:
That is because every ounce of it that goes into the air is that much less that is flowing via the ocean currents from the upwelling areas to the downwelling ones.
Strange, I fully agree on that…
The atmospheric pressure does not force CO2 into the water. The waters are depleted by the flow into the atmosphere. The net effect of atmospheric pressure is zero.
With that statement, you have digged so deep that the walls did collapse and now you are buried under the sand…
Pay for your rescue by repeating Henry’s law 100 times:
the amount of dissolved gas is proportional to its partial pressure in the gas phase
As a consequence, any CO2 flux between ocean surface and atmosphere is proportional to the pCO2 difference between these two, as good as is the case for carbonating Coke before filling the bottles (3-6 bar, depending of temperature), or reverse if you open the bottle at ambient CO2 pressure (0.0004 bar).
For the upwelling places the pCO2 of the warm oceans is ~700 μatm. That currently gives an influx of 40 GtC/year CO2 into the atmosphere which is at 400 μatm.
As a consequence, if the atmosphere should ever reach 700 μatm, then the influx would be zero. Thus the net effect of the atmospheric CO2 pressure is of utmost importance.
In general, warmer oceans at any part of the oceans gives a higher pCO2 of the surface with ~16 μatm/K. For a fixed CO2 pressure in the atmosphere that gives an increased influx or a reduced outflux, depending of the local pCO2 of the waters. If the pCO2 of the atmosphere increases with 16 ppmv/K, the original fluxes get just restored. If the pCO2 of the atmosphere increases with more than 16 ppmv/K, more CO2 will be pushed into the sinking waters and less released at the upwelling sites.
The processes which produce equilibration between the ocean/air interface must be replicated all the way down to the depths
No, the equilibration is very fast between atmosphere and ocean surface (less than a year half life time) and can be considered as quasy-static for the average temperature/pCO2 of the ocean surface. The equilibration with the deep oceans is largely restricted to some small sink and upwelling zones with extreme differences in pCO2, where the full dynamics must be taken into account. That is a much slower process than for the rest of the ocean surface: a decay rate of ~51 years (including vegetation) for any extra CO2 in the atmosphere above or below the long term steady state…
As the overturning of the deep oceans is ~800 years, we will probably not ever see the increase back at all: total human CO2 released until now would increase the deep oceans CO2 mass with 1% or at full equilibrium 3 ppmv extra in the atmosphere…
Bart:
Ferdinand is saying that, without changing the rate of inflow or the drain configuration, I can stop the rise if I merely divide the inflow so that some flows through a separate channel
That is not what I am saying, what I am saying is that warmer oceans release more CO2 into the atmosphere, thus less is reaching the sinks via the water phase and more is reaching the sinks via the air phase. There is already a natural flux of ~40 GtC/year from upwelling to sinks via the atmosphere. That is influenced by ocean surface temperatures.
If the extra CO2 in the atmosphere pushes more CO2 into the sinking waters is a matter of temperature at the sink places: if that also increased, then less CO2 will be pushed in the sinking waters thus overall less CO2 sinks with the waters than was upwelling. That means no “piling up” of CO2 in the water phase, just the opposite.
The difference between upwelling and sinks remains in the atmosphere and increases the CO2 level/pressure there (until steady state is reached again – if ever).
Conservation of mass is at work every moment of time.
I don’t think that the energy needed to transfer CO2 from liquid to air or reverse is even measurable on local or global scale (it is measurable at laboratory scale), but anyway pressure differences are good workhorses…
Ferdinand – The splitting of the CO2 flow between the ocean currents and atmosphere has no positive impact on the downwelling transport. To claim so is to be claiming perpetual motion.
All you need to know is that there is an upwelling flow coming in that was set in motion many centuries ago, and so is not going to change. There is a downwelling flow whose transport of CO2 is modulated by temperature. As a result, CO2 will accumulate in the surface system when temperature rises, the physical manifestation of which is that the rate of change will be proportional to the temperature anomaly, at least in the near term relative to oceanic turnover time.
That is a physically rigorous description of a physically viable process, and it is what we see in the data.
Is it the “recording” of the co2 present at the surface when that water was downwelling in the arctic long ago?
Something like that, I expect. Along with the sum total of whatever it picked up or lost on its centuries long trek.
The point mainly is that it is a continuous flow that cannot be altered by anything in the short term, and is thereby effectively an exogenous input to the surface system over timelines of interest.
Bart:
Ferdinand – The splitting of the CO2 flow between the ocean currents and atmosphere has no positive impact on the downwelling transport. To claim so is to be claiming perpetual motion.
The splitting of the CO2 flow has no impact on the downwelling transport, as long as there is no change in surface temperature and no change in CO2 pressure in the atmosphere.
If there is a change in temperature, the fluxes between ocean temperature and atmosphere will change and thus the amount of CO2 remaining in the transported waters.
If there is a change in the amount of CO2 in the atmosphere, the fluxes will change, and thus the amount of CO2 remaining in the transported waters.
Temperature has an influence of 16 ppmv/K in both directions.
CO2 in the atmosphere has an influence directly proportional to the average pCO2 difference between ocean surface and the atmosphere,
Nothing to do with perpetual motion: the energy from any (partial) pressure difference is all what you need…
There is a downwelling flow whose transport of CO2 is modulated by temperature. As a result, CO2 will accumulate in the surface system when temperature rises.
Please Bart, you still are digging…
There is zero backward or forward transport within the water flow between upwelling and downwelling. CO2 diffusion within water is very slow, much slower than the speed of the Gulf Stream. You need wind and waves to have some reasonable exchange speed with the atmosphere for only the surface. Thus any CO2 change in the ocean surface is by exchanges with the atmosphere (and some by the biological pump with the deep oceans).
For a warmer ocean surface, that means more CO2 release in the tropics, thus the waters start already more depleted. At the time they reach the sinks, they stiil are depleted and in the sink areas they absorb less CO2 due to the higher temperature of the ocean surface, thus less pCO2 difference with the atmosphere and thus less CO2 flux into the oceans.
There is no extra accumulation of CO2 in the ocean surface anywhere, there is depletion of CO2 everywhere from upwelling to sinks for warmer oceans. The accumulation of CO2 is in the atmosphere, not in the ocean surface…
That is a physically rigorous description of a physically viable process
It is the exact opposite of what physics say: warmer waters hold less CO2…
“There is zero backward or forward transport within the water flow between upwelling and downwelling.”
That is completely counter to everything that is known about transport phenomena.
“…warmer waters hold less CO2…”
Which means that the downwelling waters that have warmed are carrying less CO2 down with them, while the upwelling waters concentration remains unchanged. There is thereby an induced imbalance, and CO2 must accumulate within the surface system.
You are arguing in favor of perpetual motion, Ferdinand. Work performed without an input of energy is a perpetuum mobile of the first kind.
Furthermore, by the way, if what you are claiming were true, it would act equally on the anthropogenic flow. You must always treat the natural flow and the anthropogenic flows equally.
So, in line with your claim, the anthropogenic flow would produce atmospheric pressure, which would drive the downwelling transport, and the anthropogenic contribution would settle out to a constant level.
You could argue that the response might be so long term (long time constant in a simple single box model) that, in the near term, the anthropogenic flow would accumulate. But, the timeline has to be the same for both natural and anthropogenic flows, so you cannot get the natural impact settling while the anthropogenic input continues to accumulate. That is what your model does. That is why it is non-physical.
The only model consistent with the data and the laws of nature is that both flows have the same qualitative impact, but the anthropogenic flows are so much smaller than the natural ones that they have relatively small absolute impact. That is what I have been describing to you all along.
I think we’ve said everything that can be said, and I have work to do. All I can do is show you how this world you have constructed in your mind is a fantasy. I think I have done that. Equal treatment of anthropogenic and natural flows must be obeyed. Work requires input of energy. Any remaining misconception on your part is beyond my capability to address.
Until we meet again…
Bart:
The point mainly is that it is a continuous flow that cannot be altered by anything in the short term, and is thereby effectively an exogenous input to the surface system over timelines of interest.
The input from the deep oceans can not be altered, but any change in that input can be met on short note by changes in the atmosphere. Even if we had a sudden enormous 10% increase in CO2 upwelling (either water flow or CO2 concentration), that is countered in 1-2 decades by only a 30 ppmv CO2 increase in the atmosphere. Still far from the current 110 ppmv increase (90 ppmv since Mauna Loa).
Moreover, with a ~800 cycle, the upwelling now represent the sink rates of the warm MWP and will drop for ~400 years into the sink rates of the LIA, just the other way out…
“Even if we had a sudden enormous 10% increase in CO2 upwelling (either water flow or CO2 concentration), that is countered in 1-2 decades by only a 30 ppmv CO2 increase in the atmosphere.”
Quite impossible. That is extraction of work to overcome the thermal barrier of the warmer waters without an input of energy. Classical perpetual motion.
You are arguing, e.g. in the lavatory example I gave above, that by putting the spout of the diverted flow closer to the drain, you can make the rise stop, because it gets to the drain faster that way.
No, sorry. There is still no input of energy to do the extra work. There is no different arrangement or time shift that can be exploited to create work from nothing.
Bart,
Really you have no clue where you are talking about. This is so elementary that I get more sure with the day about your complete lack of knowledge of simple real life processes.
That is completely counter to everything that is known about transport phenomena.
As said a few times below, the diffusion coefficient of CO2 in water is extremely small: 0.00016 mm2/s. That even only counts if you have a pCO2 difference in the liquid, thus can’t pile up CO2, only can level CO2 between water parcels. Even if there would be a CO2 doubling in one parcel, connected to the next, its diffusion would be trivial (a few meters) over the time that the THC needs from the upwelling zones to the sink zones of less than a year (~1.8 m/s, 20,000 km).
There is thereby an induced imbalance, and CO2 must accumulate within the surface system.
Which is completely impossible: if the ocean surface gets warmer, more CO2 is emitted in warm places and less absorbed in cold places. Thus everywhere, at every point of the ocean surface, the warmer oceans are depleted of CO2 compared to a colder surface. Thus indeed, less CO2 sinks into the deep oceans, while the inflow remains the same, but that difference accumulates in the atmosphere, not in the ocean surface.
Work performed without an input of energy is a perpetuum mobile of the first kind.
Bart, the amount of energy necessary to move 0.0001 ppmv CO2 between atmosphere and oceans and back is simply negligible. Moreover, the fact that the movement solely is by pressure differences (temperature induced or not) is enough to do the job. Most energy work in the real world is from pressure differences…
the anthropogenic flow would produce atmospheric pressure, which would drive the downwelling transport, and the anthropogenic contribution would settle out to a constant level
Yes, it does, but because of the long relax rate (~51 years) not all human (or volcanic) CO2 is removed in the same year as emitted…
But, the timeline has to be the same for both natural and anthropogenic flows, so you cannot get the natural impact settling while the anthropogenic input continues to accumulate.
The timeline IS the same for any input, human and natural alike above the steady state.
Where you still go wrong, is that the main in/out fluxes are seasonal, which is a mainly temperature driven phenomenon, hardly influenced by any increased pressure in the atmosphere. The huge in/out fluxes over the seasons didn’t increase over time with sufficient amount (i.e. sufficient difference between ins and outs) to get all extra CO2 out of the atmosphere (human or not).
There is an order of magnitude difference between the seasonal temperature caused residence time (~5 years) and the pressure caused removal rate of any extra CO2 (~51 years).
That is extraction of work to overcome the thermal barrier of the warmer waters without an input of energy. Classical perpetual motion.
Pressure differences have all the potential energy needed to do that work…
Bart,
My energy necessary to move 0.0001 ppmv CO2 in real life is ~40 GtC/year moved from the ocean surface into the atmosphere where the surface is warm enough, transported by the atmosphere to the sink places and pushed back into the ocean surface, everywhere the ocean surface gets cold enough.
The energy involved comes from the increase/decrease in water temperature: that gives a higher/lower pCO2 in the ocean surface and that delivers the potential energy to move CO2 out of the oceans into the atmosphere or reverse. The potential energy is transformed into kinetic energy at a loss of potential energy of 750 μatm (ocean surface) down to 400 μatm (atmosphere) at the upwelling zones. The same, in reverse order, happens at the sink places: 400 μatm (atmosphere) down to 250 μatm (ocean surface)…
The temperature induced pCO2 difference does all the necessary work…
This is starting to get annoying, Ferdinand. You have descended to the level of “crank”, and are now promoting perpetual motion.
– I have no idea why you are going on about diffusion.
– “Thus indeed, less CO2 sinks into the deep oceans, while the inflow remains the same, but that difference accumulates in the atmosphere, not in the ocean surface.”
It accumulates in both, as it must, producing a dynamic in which the rate of change is proportional to temperature anomaly.
“Bart, the amount of energy necessary to move 0.0001 ppmv CO2 between atmosphere and oceans and back is simply negligible.”
The work that is required is that needed to push the CO2 at the same rate as it is upwelling into the downwelling waters when the downwelling waters have warmed.
Atmospheric pressure does nothing to help overcome that barrier. It is merely a splitting of the flow, not an energy source.
“Yes, it does, but because of the long relax rate (~51 years) not all human (or volcanic) CO2 is removed in the same year as emitted…”
Doesn’t work, because you have to apply the same relaxation time to the natural source.
“Pressure differences have all the potential energy needed to do that work…”
You do not produce energy merely by splitting a flow.
“…and pushed back into the ocean surface, everywhere the ocean surface gets cold enough.”
Sorry, no. You are descending into crackpottery.
There is a longer response in the queue, but basically, you have descended to the level of perpetual motion crackpot here. Splitting the flow does not add energy, and energy is necessary to overcome the thermal barrier to downflow transport created by an increase in temperature.
The point is that, the atmosphere has nothing to do with it, and is beside the point. It is just riding upon the ocean’s back.
So, you get a temperature increase. Downwelling at the surface level carries less CO2 down, so the surface level increases. This drives the downwelling faster.
In your world, it stops there, and it takes only a short while to reach an equlibrium condition.
But, the THC extends all the way down to the depths of the oceans and back up again. So, the upper level is induced by the added CO2 to transport more CO2 down. But, it is then resisted by the next layer of ocean, which is tuned to the previous volume of downwelling. That resistance now has to be overcome.
Then, the downwelling encounters the next level, and its resistance also has to be overcome.
You have to keep doing this all the way down, and it takes a very long time before a new equilibrium can be achieved. As long as you have an imbalance between what is upwelling, and what is downwelling, you will get an increase in the level at the surface. And, you will not equilibrate the downwelling to the upwelling until every level of resistance has been overcome.
Bart,
You simply don’t understand anything of basic physical processes that is the problem.
Take your:
I have no idea why you are going on about diffusion.
If there is no/little diffusion within a water flow, there is no piling up of CO2 within the water flow possible. If the temperature of the waterflow between upwelling and sinks gets up, nothing happens within the waterflow between different parcels, as there are no exchanges between them. If that flux was isolated from the atmosphere (as it is mostly isolated from the deep oceans), then what upwells simply downwells back into the deep, whatever its temperature or CO2 content.
It accumulates in both, as it must, producing a dynamic in which the rate of change is proportional to temperature anomaly.
Bart are you really that dumb, or is it only to rescue your theory? If the ocean warms everywhere, there is less CO2 in every point of the ocean surface than before the increase in temperature. Less CO2 everywhere in every point of the ocean surface.
Thus there is no CO2 accumulation in the ocean surface with increasing temperatures, there is an overall decrease of CO2 in the full ocean surface.
The work that is required is that needed to push the CO2 at the same rate as it is upwelling into the downwelling waters when the downwelling waters have warmed.
That energy is already inherited in the potential energy which is the CO2 pressure in the atmosphere: thanks to the higher temperature in the tropics at 750 μatm to push 40 GtC CO2 into the atmosphere at 400 μatm, a drop of 350 μatm, which gives all the kinetic energy needed.
The same at the sink side: 400 μatm drops to 250 μatm in the cold polar waters, a drop of 150 μatm, that is enough to sink 40 GtC into the deep.
If the downwelling waters warm with 1 K the local pCO2 of the ocean surface increases with 16 μatm, thus gets 166 μatm. as the sink flux is proportional to the pCO2 difference between atmosphere and surface, the 40 GtC/year drops to 35.7 GtC/year. Thus 4.3 GtC (~2 ppmv) remains in the atmosphere in the first year of a warming of 1 K. Until the pCO2 in the atmosphere gets 16 ppmv/K higher. Then the outflux or 40 GtC/year is restored. Thus the accumulation of CO2 due to an ocean surface temperature increase is in the atmosphere, not in the ocean surface
Atmospheric pressure does nothing to help overcome that barrier. It is merely a splitting of the flow, not an energy source.
Please Bart… Pressure IS at least an energy carrier or not much would work in this world. Even a pressure difference of 0.000001 bar CO2 (1 ppmv) higher in the atmosphere will push some extra CO2 into the ocean surface…
Doesn’t work, because you have to apply the same relaxation time to the natural source.
It does apply. If you know of any natural source that increases the CO2 pressure in the atmosphere (volcanoes?), the same 51 years decay rate is applicable.
You do not produce energy merely by splitting a flow.
No, that uses the available energy:
– A drop of 350 μatm potential energy to push CO2 from the ocean surface into the atmosphere.
– A drop of 150 μatm potential energy to push CO2 from the atmosphere back into the ocean surface.
“…and pushed back into the ocean surface, everywhere the ocean surface gets cold enough.”
Sorry, no. You are descending into crackpottery.
Bart if you don’t understand that colder waters do dissolve more of any gas from the atmosphere above it from the moment on that the partial pressure of any of these gases in the water is below the partial pressure of the same gas in the atmosphere, then it I rest my case…
Bart:
the atmosphere has nothing to do with it, and is beside the point.
Bart, please! The atmosphere has everything to do with it as there is no internal CO2 transport within the waterflow from upwelling to sinks. None at all. ALL changes in CO2 content of the water is via the atmosphere (and a small part by the biopump into the deep oceans).
So, you get a temperature increase. Downwelling at the surface level carries less CO2 down, so the surface level increases.
Bart, can you give in detail how CO2 in the surface water level increases, while less is transported down with the sinking waters. How does that CO2 move from sinking waters against the flow to increase the local CO2 levels nearby/at the sinks?
This drives the downwelling faster. But, it is then resisted by the next layer of ocean, which is tuned to the previous volume of downwelling. That resistance now has to be overcome.
I am completely confused now. Are you talking about the total volume of water or the CO2 content which have nothing to do with each other? Even if there was a tenfold increase in CO2, you would hardly see any difference in water volume.
CO2 has no influence whatever on the downflow water volume, Temperature and wind does have some influence, but that is mostly temporary (seasonal, El Niño), the rest is good for a Holywood disaster film…
“You simply don’t understand anything of basic physical processes that is the problem.”
Quite the contrary, I understand quite well that you have a simplified view that simply does not apply in this world.
“Thus there is no CO2 accumulation in the ocean surface with increasing temperatures, there is an overall decrease of CO2 in the full ocean surface.”
Again, you are living in a static universe. New parcels of CO2 are being released from upwelling waters every second to replenish what is lost, and keep pushing it on upward.
Again, this is a very simple, and legitimate, mass balance argument. If you have a set amount upwelling, and you restrict downwelling, then you must have an accumulation. That accumulation will continue until an equilibrium in the flow is reestablished. As the THC takes many centuries for circulation, that is the order of time that is required to reestablish equilibrium.
Bart,
Answers are further down, no further discussion here, it gets very messy…
Ferdinand
says
With the same reasoning, one can argue that there is no sea level rise possible, as the huge tidal changes show that the ocean mass is not saturated and the rise due to warmer oceans and ice melt is trivial compared to the total mass going up and down every 12 hours or so.
Henry
says
This melting of ice [in the NH] has something to do with this small amount of 90 ppm of CO2 that you think is coming from us, and that you guys keep arguing about, that we all know is like dung in the air?
Then I remind you again that you have still not proven [by any reasonable scientific test] that the net effect of more CO2 in the atmosphere is that of warming rather than cooling.
Henry,
Nothing to do with rising CO2 levels, only with rising temperatures…
Which still results in rising sea levels at an extreme “speed” of 2-3 mm per year…
But that is impossible, if we follow the reasoning of Richard…
It’s already abundantly clear that temperature drives natural CO2 emission on this planet. More warmth produces more animal life and therefore more respiration, (most from insects and soil microbes). More warmth and more CO2 produces more plant life sucking up the more abundant CO2 which is then more food for yet even more animal life. The only real limitations seem to be temperature and how much carbon is around to cycle.
A quote from this study http://www.nature.com/nature/journal/v488/n7409/full/nature11299.html underscores that very fact
From reports like this one, https://svs.gsfc.nasa.gov/12226 , there’s no question earth is getting greener …
.. but from the paper above, the real eye opener is the stated magnitude: DOUBLED CO2 UPTAKE IN 50 YEARS!!
So while it does not appear that the small amount of added human CO2 is doing much of anything to raise global temperature, our CO2 emissions may in fact be giving a VERY SIGNIFICANT boost to life on this planet!
Keep up the good work, drill baby drill!
The Original Mike M,
I don’t think your bookkeeper would be happy with you if you give him only half the figures: indeed there are more sinks and the earth is greening, but that is because humans have added lots of CO2 first…
Temperature is good for only 290 ppmv, the rest is thanks to our emissions…
“but that is because humans have added lots of CO2 first”
The percent of overturned CO2 that was added by humans is going down as we keep adding it! Seeing life respond by doubling its uptake proves that there is not enough carbon in the carbon cycle to begin with – it wants MORE! What is wrong with giving earth’s biosphere more of what it wants? It used to have a LOT more 100 million years ago – it appears that plant genes “remembered” and want it higher.
Ferdinand : “If we didn’t add such large quantities of CO2, CO2 levels would go down, back to the steady state by Henry’s law, that is ~290 ppmv for the current average sea surface temperature. ”
This is one of the silliest misinformed things I’ve ever read! Since WHEN has the ocean ever “obeyed” Henry’s Law? Explain why it didn’t “obey” it 150 MYA when CO2 was north of 2000ppm ? Even then the pH remained above 7.5 – why do you think that was?
No Ferdinand! The ocean is NOT some container of distilled water, it is highly buffered and more importantly … full of LIFE.
The big difference is that LIVING organisms like coccolithophores never read about Henry’s Law so they just ignore it – and your pathetically simplistic viewpoint.
Gee, where does all that ocean CO2 go Ferdinand? http://www.independent.co.uk/news/science/climate-change-atlantic-plankton-bloom-reflects-soaring-carbon-dioxide-levels-scientists-say-a6750241.html
CO2 uptake by life in the ocean is estimated at 50 PETAGRAMS per year! https://epic.awi.de/37516/1/CC_PrimaryProduction.pdf So much for your silly babble about Henry’s Law.
Correction – Per the paper, NPP of ocean is 50 petagrams of CARBON … not CO2.
Mike
I am with you all the way!!
Problem is how we can change the perception of many people & media in the world who have been brainwashed into believing that a change of 90 ppm of CO2 [0.009%] extra in the atmosphere is responsible for global warming and any ‘climate change’ in general….
“The ocean is NOT some container of distilled water, it is highly buffered and more importantly … full of LIFE.”
Amen! Additionally, they are always flowing and circulating, and they are vast beyond most peoples’ comprehension.
Mike,
We aren’t talking about 150 million years ago, as much of that CO2/carbonate now rests in the nice white cliffs of Dover and doesn’t buffer the oceans anymore. We are talking about the past few million years with what we see in ice cores: a CO2/T ratio of ~16 ppmv/K, the same as Henry’s law gives (4-17 ppmv/K) for the solubility of CO2 in seawater. Confirmed by over 3 million seawater samples in the past decades.
Human emissions are ~9 GtC/year, nature absorbs ~4.5 GtC/year. Without human emissions, CO2 levels would go down…
The Original Mike M April 11, 2017 at 5:25 am
Ferdinand : “If we didn’t add such large quantities of CO2, CO2 levels would go down, back to the steady state by Henry’s law, that is ~290 ppmv for the current average sea surface temperature. ”
This is one of the silliest misinformed things I’ve ever read! Since WHEN has the ocean ever “obeyed” Henry’s Law?
Always, it has no choice, basic physical chemistry!
Explain why it didn’t “obey” it 150 MYA when CO2 was north of 2000ppm ? Even then the pH remained above 7.5 – why do you think that was?
That’s about right, pH 7.5 would correspond to about 2000ppm.
No Ferdinand! The ocean is NOT some container of distilled water, it is highly buffered and more importantly … full of LIFE.
The Henry’s Law coefficient of CO2 in seawater is ~29mol/(m^3 bar) at 25ºC. The life in the ocean has no effect on the concentration ratio across the boundary.
and how much co2 is being released
by thawing permafrost?
The Original Mike M April 10, 2017 at 12:42 pm:
“It’s already abundantly clear that temperature drives natural CO2 emission on this planet.”
so tell us — where do you think the 40 billion tons of co2 we emit every year goes?
If nature takes out at least half of all human emissions, then why is it a stretch to think that nature can’t take out the whole shebang?
“where do you think the 40 billion tons of co2 we emit every year goes”
Increasingly more and more of it is gladly being sucked up by plants and recycled like the rest. It’s like fertilizing your lawn. If it is very sparse then not very much will be used initially. But as it fills in it will use more and more.
Another analogy is a closed loop fountain. The pump is cavitating because there is not enough water (CO2) in it. We are slowly adding water and the height of the fountain (amount of life) is getting higher (doubled per that study).
Fonzie and Original Mike,
If we didn’t add such large quantities of CO2, CO2 levels would go down, back to the steady state by Henry’s law, that is ~290 ppmv for the current average sea surface temperature. Thus don’t wish for stopping human emissions…
And Fonzie, for any simple, straight linear process, the sink rate is directly proportional to the extra pressure above the steady state. Thus halving current human emissions would bring the sinks back in equilibrium with the emissions…
“… for any simple, straight linear process, the sink rate is directly proportional to the extra pressure above the steady state. Thus halving current human emissions would bring the sinks back in equilibrium with the emissions…”
No. The sink rate is directly proportional to the pressure. Period. Not the pressure above a fictional steady state, but the entire pressure. Thus, it is a function of total flow rate, of which anthropogenic components are a small part.
If human emissions were halved, they would just be a smaller portion of the overall flow, of which they are already a small portion. It would barely even register.
Bart,
You may be brilliant in your own profession, but here you show – again – that you have some lack of experience in simple straightforward, linear processes in the real world around you…
No. The sink rate is directly proportional to the pressure. Period. Not the pressure above a fictional steady state, but the entire pressure.
The sink rate is not proportional to the CO2 pressure, it is proportional to the (partial) pressure difference between the atmosphere and the ocean surface (or the water within plant alveoles).
That is what Henry’s law says. When the pCO2 of the ocean surface and the pCO2 in the atmosphere in average are equal, there will be a dynamic equilibrium (“steady state”) between the two: as much CO2 is coming in from warm oceans as is absorbed by cold ocean surfaces. Flux in and flux out ~40 GtC/year. Net flux zero.
Currently the pCO2 difference between the atmosphere and ocean surface is 7 μatm higher in the atmosphere. Thus there is more flux out of the atmosphere into the oceans than reverse, thus your theory of the oceans as source is proven wrong…
If you want to split hairs, replace everywhere I said “pressure” with “partial pressure”. Again, you are just grasping at straws.
To you, the natural equilibrium level is a magical thing that just exists, and you can build your house on top of it. But, your foundation is sand. Anthropogenic flows are subject to the same equilibrium dynamics, and they cannot affect the equilibrium level by anything greater than their proportion to the natural flows.
Bart,
You only have shown – again – that you don’t know what you are talking about.
It is not about the word “partial”, it is about absolute pressure against pressure difference
The source/sink rate is not proportional to 400 μatm (~ppmv) in the atmosphere. It is proportional to (750 – 400) μatm at the upwelling places near the equator and (400 – 250) μatm at the sink places near the poles.
If it was proportional to the absolute pressure in the atmosphere, no CO2 was left in the atmosphere…
A temperature incease in the ocean surface does increase the pCO2 difference at the upwelling and does decrease the pCO2 difference at the sink zones. That changes the in-out fuxes, leading to an increase of CO2 in the atmosphere. The reaction on that increase is opposite to the increase in temperature and at 16 ppmv/K the original fluxes are restored. The poles were never CO2 sources, at least not as long as there was sea ice.
“The reaction on that increase is opposite to the increase in temperature and at 16 ppmv/K the original fluxes are restored.”
No. Sorry. That is not how it works. By the time the atmosphere has built up enough CO2 to equalize the last batch that upwelled and failed to downwell, more has upwelled and failed to downwell.
It is a dynamic process. It is on a treadmill, and it will not catch up until either temperature reduces, or after centuries, when overturning has resulted in less upwelling transport and a new equilibrium level.
You are stuck in a static world. That is not the world we live in.
Bartemis April 11, 2017 at 4:39 am
“… for any simple, straight linear process, the sink rate is directly proportional to the extra pressure above the steady state. Thus halving current human emissions would bring the sinks back in equilibrium with the emissions…”
No. The sink rate is directly proportional to the pressure. Period. Not the pressure above a fictional steady state, but the entire pressure. Thus, it is a function of total flow rate, of which anthropogenic components are a small part.
No you’re wrong, Henry’s Law is pCO2=kH⋅[CO2] at equilibrium when the sink rate will be zero. The sink rate will depend on the difference pCO2-kH⋅[CO2].
“Increasingly more and more of it is gladly being sucked up by plants and recycled like the rest.”
be quantitative; how much more CO2 is being taken up by plants?
afonzarelli April 10, 2017 at 5:24 pm wrote
“If nature takes out at least half of all human emissions, then why is it a stretch to think that nature can’t take out the whole shebang?”
because that’s not how the physics of gas absorption in a liquid works.
Phil. @ur momisugly April 11, 2017 at 4:16 pm
You are not following the conversation.
crackers345 @ur momisugly April 11, 2017 at 4:44 pm
You aren’t, either.
You are both irrelevant.
Bartemis April 11, 2017 at 5:32 pm
Phil. @ur momisugly April 11, 2017 at 4:16 pm
You are not following the conversation.
No I’m leading it, why would I follow someone like you who doesn’t have a clue about the relevant science.
If you think so, then OK. I’m not a shrink.
Bartemis April 11, 2017 at 5:48 pm
If you think so, then OK. I’m not a shrink.
Not a scientist either clearly.
“Phil.” makes the most significant comment on this thread: ” Not a scientist either clearly.” Thanks.
Bart,
I begin to think that you never, ever have seen a simple, linear dynamic process from nearby.
What you are telling here is pure nonsense:
By the time the atmosphere has built up enough CO2 to equalize the last batch that upwelled and failed to downwell, more has upwelled and failed to downwell.
How much CO2 is entering the atmosphere from the upwelling sites is directly proportional to the local pCO2 difference between the ocean surface and the atmosphere.
How much CO2 is leaving the atmosphere at the sink sites is directly proportional to the local pCO2 difference between the atmosphere and the ocean surface.
At any inbetween place, the flux of CO2 in or out (even in and out over the seasons) is directly proportional to the local pCO2 difference between the atmosphere and the ocean surface.
The local pCO2 difference is what counts, if there is no difference, there is no CO2 flux (or to be strictly scientific: as much CO2 molecules transfer from atmosphere to liquid as reverse).
The only way that CO2 in the downwelling waters may fail to downwell is when the waters themselves fail to downwell. That is the very unlikely scenario of “The Day after Tommorow”.
Otherwise the only CO2 exchange in the ocean flow from equatorial upwelling to polar sinks is between the ocean parcels and the atmosphere and a mainly biological one between ocean parcels and the deep oceans. There is no backward or forward propagation of CO2 between ocean parcels on their voyage between tropics and poles.
The observed exchange rate between ocean surface and atmosphere is less than a year (but limited to 10% of the change in the atmosphere).
The observed exchange rate between the deep oceans (+vegetation) and atmosphere is ~51 years (practically unlimited).
The latter is fast enough to deal with any change in temperature or concentration or flux from the deep oceans, but too slow to remove all human emissions in the same year as emitted.
You are stuck in a static world. That is not the world we live in.
Bart, what part of the dynamic changes in the above dynamic fluxes between (deep) oceans and atmosphere don’t you understand?
Don’t start with fantasy stories that CO2 piles up in the waters before downwelling and therefore the CO2 levels go up in the atmopsphere: the cold waters near the poles have the largest undersaturation (250 μatm) for CO2 on earth, thus sucking their maximum flux of CO2 out of the atmosphere (at 400 μatm). Any temperature change at the downwelling places is fully compensated with a change of 16 ppmv/K in the atmosphere within a decade or so.
“You are stuck in a static world.”
Bartemis keeps saying this, but the mass balance clearly isn’t a static analysis. This is what you get if you apply the mass balance analysis to the osbervations:

which has a rather large trend and quite a lot of inter-annual variability for a static analysis!
I suspect this is why Bartemis likes to misrepresent the mass balance argument by using the airborne fraction of 0.5 to make it static:
“In your equation, C := 0.5*Ea. That is how you make your conclusion.”
I don’t make my conclusion that way, and Bartemis knows perfectly well that I don’t because I have pointed out his dishonest misrepresentation on more than on occasion, and he has no substantive response, just bluster and insult.
I wouldn’t connect the constant airborne fraction with the mass balance equation, because (i) it is not necessary and (ii) it would weaken my argument because the mass balance equation holds for any system that obeys conservation of matter (which the carbon cycle obviously does), but the constant airborne fraction is contingent on the (approximately exponential) form of anthropogenic emissions. Which is why Bartemis tries to substitute it as a straw man.
Ferdinand Engelbeen @ur momisugly April 12, 2017 at 3:28 am
“The only way that CO2 in the downwelling waters may fail to downwell is when the waters themselves fail to downwell.”
That is incorrect. This is a transport problem, Ferdinand. You have reduced an amazingly complex phenomenon into a trivial problem, but the solution exists only in your own head.
It’s ridiculous. You and Phil and the others are living in a fantasy realm in which you have appointed yourselves gods, and asserted away all the complexities. You are like the monks of yore, insisting that the planets must move in perfect circular patterns, with no physical backing whatsoever, and mocking those who insist that the Earth is not at the center of it all.
dikranmarsupial @ur momisugly April 12, 2017 at 3:54 am
Dumb, dumb, dumb, dumb, dumb.
Phil. @ur momisugly April 11, 2017 at 6:06 pm
So, being a “scientist” means taking a laboratory result from pure sample in a beaker at steady state under controlled conditions and constant temperature, and extrapolating it with no time lag across an immense active system with enormous time lags and huge temperature swings, and calling it truth.
As my friend Inigo Montoya would say, “You keep using that word. I do not think it means what you think it means.”
Bart:
That is incorrect. This is a transport problem, Ferdinand. You have reduced an amazingly complex phenomenon into a trivial problem, but the solution exists only in your own head.
It is a trivial problem, once you accept the observations, but there you don’t accept what you don’t like.
The observations show a surprisingly linear net sink rate in direct ratio to the extra CO2 above the steady state of the oceans per Henry’s law. That are facts.
Part of that sinks in the biosphere, part in the oceans. The first is measured via the oxygen balance, the second is measured via lots of frequent pCO2 measurements all over the oceans.
That this refutes your hypothesis, together with the opposite δ13C drop, makes not the slightest impression on you. You still come with the hypothesis that CO2 accumulates in the surface waters (which is true, but in reverse order), thus is the cause of the increase in the atmosphere, without a shred of evidence, while the observations show exactly the opposite…
Thus it is only in your head that the problems are…
“It is a trivial problem…”
Yes, and it is trivial that the planets revolve in circles about the Earth. You are hopeless.
Bartemis, every time you respond “Dumb, dumb, dumb, dumb, dumb.” you are just confirming that you know you did misrepresent me, and you are unable to refute the evidence that you did. I don’t need to engage in frequent ad-hominems, I don’t need to misrepresent your arguments in order to show them to be incorrect, and I don’t need to run away from arguments I can’t answer by writing “Dumb, dumb, dumb, dumb, dumb” (a better approach is to admit you can’t answer them, as that is the rational thing to do). You should ask yourself why you do need to do those things.
You also ought to read what Fred Singer “wrote about this (note his choice of words, not mine). If you want to marginalise yourself, then this argument is about as good as the claims that the greenhouse effect violates the second law of thermodynamics (it very obviously doesn’t) or that climate is driven by Jupiter-Saturn Syzergy (however you spell it). Entirely your choice.
I wrote “I don’t make my conclusion that way, and Bartemis knows perfectly well that I don’t because I have pointed out his dishonest misrepresentation on more than on occasion, and he has no substantive response, just bluster and insult.”
Utterly predictably, Bartemis responded “Dumb, dumb, dumb, dumb, dumb.”
Not a great advert for climate skepticism. The Fred Singer article (again, his choice of words not mine) I mentioned is discussed here. Bart is there on that thread:
“I am very tired of those who deny that the greenhouse effect exists based on a misunderstanding of the 2nd law and, usually, a failure to view the system as dynamic with continual influx of energy from the Sun. The GHGs do not heat the surface, per se, they merely impede the outflow so that extra energy, relative to what would be the case without the GHGs, accumulates before equilibrium is established.
There are two particular GHE disbelievers who like to post here on WUWT who always seem to swoop in when I am having a serious discussion with someone with opposing views and embarrass me. I wish they would stop.”
Oh, the irony! ;o)
By all means DM, tell everyone far and wide that you stand with the infamous Doug Cotton against me. He and you make a good pair of cranks.
Look, DM. I gave you the math. I spelled out in lucid detail what is wrong with your argument. You’ve got no leg to stand on, except your bludgeoning insistence on repeating the same flawed argument ad nauseum. I have no further interest in making futile arguments against invincible ignorance.
But, I am curious… Are you now saying Fred Singer is an authority to be trusted on all matters climate related?
Bartemis writes “Look, DM. I gave you the math.”
Bartemis finds a new way of evading the fact that he dishonestly misrepresented my argument…
“I spelled out in lucid detail what is wrong with your argument.”
by bringing up his criticism of the straw man he set up! You would be better of either by not replying, or better still, admitting you misrepresented me, apologising, and addressing the argument I actually did make. By repeatedly replying without actually addressing the charge, you are just making it clear that you are not engaging honestly in truth-seeking scientific discussion. I’m not sure what you seek to gain by that.
“But, I am curious… Are you now saying Fred Singer is an authority to be trusted on all matters climate related?”
No, of course not, but not being driven by petty partisan animosity, I don’t have a problem with agreeing with climate skeptics when I think they have a point, as Singer does in that article. Clinging on to obviously incorrect arguments, such as that the rise in atmospheric CO2 is natural, will just get climate skeptics marginalised. I don’t particularly want that, I want a climate debate based on rational discussion of the science, but its entirely your choice.
Bartemis April 13, 2017 at 10:36 am:
>> Look, DM. I gave you the math.
what you haven’t given is the physics.
or are you just curve-fitting?
“…or are you just curve-fitting…”
The folly of the pseudo-mass balance argument is completely separate from the issue of modeling the evolution of CO2. It is a very elementary math error, to wit, the part on the side of the ledger that is ascribed to nature is not independent of anthropogenic influence. Hence, it does not tell us what nature on its own is doing.
Nothing to do with curve fitting. Just simple math. The pseudo-mass balance argument is a very stupid argument on a very elementary level.
One more time Ferdinand (and Phil) – The very fact that CO2 was over 2000ppm 150MYA annihilates your ridiculous assertion that the ocean is somehow “supposed to obey” Henry’s law, that atm CO2 would magically be at ~290ppm if not for the CO2 added by human’s burning FF. That assertion is junk science pure and simple! (And you won’t weasel out of it Ferdinand, you stated:“If we didn’t add such large quantities of CO2, CO2 levels would go down, back to the steady state by Henry’s law, that is ~290 ppmv for the current average sea surface temperature. ”)
LIFE and geology are the key factors in ocean chemistry. Henry’s Law is not some factor to be used to argue how much CO2 there ought to be in the atmosphere, it is merely a regulating factor in the dynamics of CO2 exchange between the air and the ocean.
The amount of CO2 in the ocean and in the air is controlled by LIFE … not Henry’s Law. (And I additionally submit that humans are alive.)
Here’s the proof – https://hub.jhu.edu/2015/11/26/rapid-plankton-growth-could-signal-climate-change/
How is that not a good thing? How is lowering ocean pH not a good thing when it helps recycle calcium to be available for the things like coccolithophores? (The things that built the White Cliffs of Dover per your example back when CO2 was far more plentiful.)
Also, your assertion of natural absorption is WAY off! Total global NPP is over 100 Gt/yr not 4.5 and it is rising more quickly than human emissions as well thus LOWERING the percentage of the human CO2 in the air.
Here you go – https://www.nature.com/articles/ncomms13428
Your 4.5 Gt number is not the total natural absorption. It is merely the difference between natural emission (mostly respiration) and natural absorption; just a lame attempt to hide the overall planetary carbon cycle from view to fool people into thinking that human emissions are over an order of magnitude more influential than they actually are in relation to the natural carbon cycle.
MIKE Good comment.
The Original Mike,
In short: if you don’t know the most elementary points of what happens in the oceans and between oceans and atmosphere, then it is difficult to have a discussion…
Indeed biolife has an impact on CO2 exchanges between atmosphere and oceans, as good as temperature and (bi)carbonate content (and thus pH).
The net result of all CO2 movements between atmosphere and ocean surface over a full seasonal cycle is about 0.5 GtC increase in the upper ocean layer while the atmosphere increased with 4.5 GtC and humans emitted 9 GtC in the same year.
That is what is measured.
The increase in total carbon in the ocean surface over the past (at least) 30 years is 10% of the change in the atmosphere. No matter how much biolife increased or not, only depending on temperature and the change in the atmosphere. The ocean surface simply follows Henry’s law for free CO2 in seawater (and the Revelle factor for the rest of the carbon species).
Henry’s law still works today, as it worked millions of years ago with much higher (bi)carbonate content in the ocean waters.
Mike,
In addition:
Nobody hides the natural cycle (even the IPCC gives it a nice place). The point is that the height of the natural cycle is completely irrelevant for the total amount in the atmosphere. No matter if 100 GtC or 200 GtC or 1,000 GtC cycles in and out within a year. What counts is the difference at the end of the year.
The year by year variability of the natural cycles is not more than +/- 1.5 ppmv around the trend of 90 ppmv in the past near 60 years.
Without human emissions, the natural difference did get up with temperature at a “speed” of 0.02 ppmv/year over a period of 5,000 years of warming in 8 periods over the past 800,000 years.
These days the CO2 increase is 2 ppmv/year. All natural? While humans emit 4 ppmv/year…
It is getting quite messy here…
I don’t think that Bart ever will admit that his theory is wrong, while it violates every single observation. Maybe after a cooler period – if that comes sooner or later – when temperatures get negative and CO2 levels still go up, as was the case in 1945-1975 and 1997-2014…
Bye for now, up to the next round…
“… when temperatures get negative and CO2 levels still go up, as was the case in 1945-1975 and 1997-2014”
What on earth are you talking about here, ferdi?(!) If the temp/growthrate correlation holds true, CO2 levels won’t go negative until temps are where they were circa 1920. The bigger question is this: if we get an extended cooling spell and the carbon growthrate falls lock step along with it, will you admit that YOU are wrong?
Exactly, Fonz.
Hopefully, if the ~60 year cycle is sustained, we will see that soon. So far, it looks to be on track. The AMO is in its down cycle:
http://woodfortrees.org/plot/esrl-amo
The PDO is hung up momentarily, but appears in the process of crashing like it did after the blip in 1960:
http://woodfortrees.org/plot/jisao-pdo
That appears to have been buoying temperatures through this El Nino episode. Once it is well and thoroughly gone, throw your hands up in the air and enjoy the ride. And, make sure you have a warm coat for the winter.
Indeed, in the 1960-1975 period, CO2 rate of change did go up (in lockstep with human emissions), while temperatures did go down with the AMO cycle. Seems not so good for Bart’s theory…
It will be interesting times when temperatures go down…
Annualized Mauna Loa dCO2/dt has “gone negative” a few times in the past (calculating dCO2/dt from monthly data, by taking CO2MonthX (year n+1) minus CO2MonthX (year n) to minimize the seasonal CO2 “sawtooth”.) This occurred during the global cooling period from ~1940-1975.
These 12-month periods are (Year-Month ending):
1959-8
1963-9
1964-5
1965-1
1965-5
1965-6
1971-4
1974-6
1974-8
1974-9
Short time periods are affected by short term processes which independently affect temperature or CO2 in differing fashion, and my measurement error. They do not provide any guide.
This is a stochastic process. You have to employ a variety of fuzzy logic to grasp what is going on. The general behavior is
dCO2/dt = k*(T – T0)
Mean rate of change does not go negative until T descends below T0.
… by measurement error…
Fat fingers.
Bart,
If over a period of 57 years some 35 years show a negative correlation between T and dCO2/dt, then one need to question the basic assumption that the trend is caused by T. That simply may be spurious, only caused by the fact that the endpoints in both cases are higher than the beginpoints.
On the other side, human emissions and CO2 increase show a similar behaviour both directly and in the derivatives for any period longer than 5 years, including the noise.
The start period 1958-1975 is important (and in extension 1950-1975), as that is exactly the period where the AMO is negative and temperatures drop, thus should show a drop in CO2 rate of change, which is not the case, not even in a period where human emissions still were small.
“On the other side, human emissions and CO2 increase show a similar behaviour both directly and in the derivatives for any period longer than 5 years, including the noise.”
Nonsense. Human emissions do not even begin to match in the variability. The only correlation is spurious, as it is in low frequency, low information, low order polynomial behavior.
“The start period 1958-1975 is important (and in extension 1950-1975), as that is exactly the period where the AMO is negative and temperatures drop, thus should show a drop in CO2 rate of change, which is not the case, not even in a period where human emissions still were small.”
It is a very good match, and you are clutching at straws:

Bart,
You can integrate what you want, that doesn’t prove that the integral of T has any physical meaning, only that it gives a similar curvatory that human emissions already have without integration.
The discussion is on the lower level: despite that temperatures still are above the baseline in the period 1958-1975, the correlation between T and dCO2/dt is negative and you need to apply a negative factor to match the slopes. Thus effectively putting the amplitudes upside down.
That is the case for 35 years of the 57 years graph, but the first period is the most interesting, as that is still with low levels of emissions and a firm drop in AMO/temperatures.
What we can conclude from this:
1. The correlation between the variabilities is real, but hold as good for T and CO2 as for dT/dt and dCO2/dt, with for these two with the physical “normal” lag for CO2 and dCO2/dt.
2. The use of one factor to match both amplitude and slope doesn’t make any sense as that leads to absurd situations in 35 of the 57 years. Moreover, it is proven that variabilities and slope are not caused by the same processes.
3. It gets more and more clear that matching the slopes is completely spurious and only matches because the begin and endpoints are in the same direction…
“…only that it gives a similar curvatory that human emissions already have without integration.”
No, that is all you’ve got. The dCO2/dt relationship holds both in the long term trend and the variability.
The plot above shows you are wrong. The relationship is firm.
Bart:
No, that is all you’ve got. The dCO2/dt relationship holds both in the long term trend and the variability.
The relationship is true for the variability, it is entirely spurious for the trend. Just matching two straight slopes, that is all. Violating all observations:
– the mass balance.
– 14C drop in the atmosphere before 1940
– 13C/12C drop in the atmosphere.
– the increase in DIC and pCO2 and the decrease in pH of the ocean surface
While “my” solution fits them all…
– 13C/12C drop in the atmosphere
Ferdinand, you still have to show how your solution is consistent with a constant d13C of -13 per mil for the incremental CO2 ever since 1750 …
It’s the usual Bart nonsense which he’s been spouting for years.
The species balance equation is:
dCO2/dt = Sources(T,pCO2) – Sinks(T,pCo2)
The sources can be split into Source(ff) + naturalSource(T,pCO2)
Therefore:
dCO2/dt = Source(ff) + naturalSource(T,pCO2) – Sinks(T,pCo2)
Any Chem Engineer or kineticist applies that on a regular basis, if natural sources and sinks are dominated by ocean temperature (i.e. Henry’s Law) then the pCO2 will be modulated by the temperature but the annual growth in SST is not sufficient to account for the steady growth in pCO2.
Note that the WfT graphs always have an offset to disguise the part of the growth that is not accounted for by T.
“… the annual growth in SST is not sufficient to account for the steady growth in pCO2.”
Yes, it is. It is an integral relationship, due to long term equilibration of the oceans to depth.
“Note that the WfT graphs always have an offset to disguise the part of the growth that is not accounted for by T.”
The baseline for T is arbitrary. The dynamic response is with respect to a particular T anomaly.
The relationship is not in doubt. Watch and see what happens when cooler temperatures arrive.
Bart,
Again, at nauseum, there is no integral relationship between T and dCO2/dt. That is pure theoretical and only based on an arbitrarely match of two slopes.
The releationship is between T and CO2 or between dT/dt and dCO2/dt, not between T and dCO2/dt.
The integral of T is a non-existing non-physical entity.
“Again, at nauseum, there is no integral relationship between T and dCO2/dt.”
There very obviously is.
“The integral of T is a non-existing non-physical entity.”
Incorrect. It is physically the temperature dependent accumulation of CO2 in the surface system due to differential transport of CO2 within the ocean currents.
Ferdinand, you are never going to change Bart’s mind. He clings to his “dynamic systems theory” much like a true religious believer will never relinquish their beliefs. I would love to see Bart apply his “dynamic systems theory” when he has to balance his checking account. What would d$/dt look like?
Bartemis is a genius
He knows maths and how it really should be applied in practice. I have found few people on earth who have this ability….
Dynamics systems theory is what gives you planes, trains, and automobiles. It is hardly religion. It is veritably the antithesis of religion.
What you are engaged in, is faith. That is what religion is all about.
Bart, what do you use for d$/dt when you balance your checkbook?
henryp, you must never have met a “Quant” from Wall Street. Bart’s nothing special. You may think he’s good at math, and he might be in your mind, but he’s not good at logic as Ferdinand has shown.
If Ferdinand really understood the triviality of his gh theory on CO 2 he really would have stopped talking a long time ago…
“Dynamics systems theory is what gives you planes, trains, and automobiles.” ….oh, yeah, right, The Wright brothers and Henry Ford used dynamics systems theory. Too funny. I will admit, I don’t know if Richard Trevithick knew any kind of theory.
This foregoing betrays a stunning ignorance of proven analytic relationships in dynamic systems. Since T and dCO2/dt are strongly correlated, the integral of T will likewise show this correlation with CO2-level anomalies (i.e., with integrated differentials of CO2). There’s just as much physical basis here as there is in accumulated “degree days” used in agriculture to determine plant growth. Slope matching has nothing to do with this!
You feel my pain, 1sky1. Yet, the naysayers assert such silly things with absolute assurance.
1sky1,
My math is completely rusty and never had to apply dynamic theories, as half my former job was in implementing new inventions (chemical processes) of brilliant people like Bart in the real world. With all the problems involved. My strength is in problem solving: if something doesn’t work in the real world, then the theory is wrong, or some influence was not known or underestimated.
In Bart’s case, the theory is wrong on every observation. Not one but every single observation…
As I remember well from already many (about 50!) years ago, a correlation may be used in an integration, if there is a lag between cause and result. That is the case for temperature and planth growth. That is NOT the case for temperature and CO2 growth: there is no lag between them. Why?
The same correlation, with a lag, can be found between the variability of T and CO2 and between dT/dt and dCO2/dt again with the same lag. By comparing T with dCO2/dt, the variability still is the same, but shifted back in time for dCO2/dt, thus both are fully synchronized.
The real correlation is between the variability in T and the variability in CO2 around the trend of CO2: +/- 1.5 ppmv around a trend of 90 ppmv. Or between dT/dt and dCO2/dt: zero trend in dT/dt, only a slight offset from zero.
The influence of the slope of T on CO2 levels is maximum 10 ppmv, per Henry’s law for the solubility of CO2 in seawater. Confirmed by over 3 million seawater samples all over the oceans.
The real cause and effect in this case is between human emissions and the increase in the atmosphere: both show a slightly quadratic increase and little variability, with human emissions about twice the increase in the atmosphere.
See further: http://www.ferdinand-engelbeen.be/klimaat/co2_variability.html#The_real_world
In this case integrating temperature has no physical meaning:
Any one-step warming of the ocean surface indeed starts with an increase in net CO2 flux out of the oceans into the atmosphere. If you integrate the temperature, as Bart does, then the initial CO2 flux goes on forever, increasing the CO2 levels in the atmosphere without any limit, as long as the temperature step is maintained.
What Bart constantly ignores is the feedback from the increasing CO2 levels in the atmosphere: when the pCO2 pressure in the atmosphere increases with 16 ppmv/K, the original pressure differences are restored, thus the original in/out fluxes are restored, no matter if that is for a single seawater sample or for the full dynamics of the oceans.
That reduces the original (extra) influx from the temperature step to zero. Thus the integral of temperature ultimately gives 16 ppmv/K extra CO2 for any temperature increase…
“…when the pCO2 pressure in the atmosphere increases with 16 ppmv/K, the original pressure differences are restored…”
It doesn’t. It is a process more or less as this documentary excerpt shows:
Bart,
Except that the CO2 transport band, the THC, doesn’t show any speed increase, neither a change in CO2 content at the upwelling side…
We don’t actually have much information on what is upwelling, except in your world of circular logic. But, in any case, a reduction in downwelling transport has an equal impact to an identical increase in upwelling transport. And, downwelling transport is temperature dependent.
Bart:
a reduction in downwelling transport has an equal impact to an identical increase in upwelling transport. And, downwelling transport is temperature dependent.
It hardly matters if the THC as total cycle increased or decreased, indeed as long as inputs and outputs are equal.
If you mean with “transport” the water flow, that can’t have a disequilibrium for longer periods, as water doesn’t pile up that easy.
If you mean total CO2/derivatives in the water phase, that is just transported from sources to sinks as there is no forward or backward propagation, thus no “piling up” of CO2 in the water phase before it sinks.
If you include the atmosphere, CO2 is piling up in the atmosphere if the waters get warmer, in ratio to the average pCO2 difference between ocean surface and atmosphere. With warmer oceans, more is released into the atmosphere and less is sinking in the oceans.
With increasing CO2 pressure in the atmosphere, the net influx is reduced and completely stops at 16 ppmv/K. At that moment as much CO2 is sinking again into the deep oceans as before the temperature increase.
If some source delivers extra CO2 into the atmosphere, higher than the increase in temperature delivers (at 16 ppmv/K), then extra CO2 is pushed into the ocean surface and more CO2 sinks with these waters into the deep oceans.
“If you mean total CO2/derivatives in the water phase, that is just transported from sources to sinks as there is no forward or backward propagation, thus no “piling up” of CO2 in the water phase before it sinks.”
That betrays a total lack of familiarity with transport phenomena.
Bartemis April 13, 2017 at 10:31 am
We don’t actually have much information on what is upwelling, except in your world of circular logic. But, in any case, a reduction in downwelling transport has an equal impact to an identical increase in upwelling transport. And, downwelling transport is temperature dependent.
Since you can’t have a reduction in downwelling without a corresponding reduction in upwelling this statement doesn’t make much sense. Also downwelling is temperature and salinity dependent.
“Since you can’t have a reduction in downwelling without a corresponding reduction in upwelling this statement doesn’t make much sense.”
Water, yes (more or less). But, transport of CO2 with the flows, no.
Bart,
The diffusion of CO2 in water is extremely slow (diffusion coefficient 0.0016 mm2/s). many orders of magnitude slower than the speed of the Gulf Stream/THC (~1.8 m/s).
Would need some very fast CO2 molecules swimming upstream just before the waters sink into the deep to give any piling up of CO2…
BTW, once in the atmosphere, CO2’s diffusion coefficient is 16 mm2/s, further aided by wind and convection to spread all over the earth.
“BTW, once in the atmosphere, CO2’s diffusion coefficient is 16 mm2/s, further aided by wind and convection to spread all over the earth.”
It does not matter. This is merely a diversion of the flow. It does not add energy with which to overcome the thermal barrier of the warmer water. It therefore cannot force downwelling. Just like in my lavatory analogy up above.
Bart,
The energy is in the pressure difference: any pressure difference converts the change in pressure (= difference in potential energy) into kinetic energy that moves CO2 molecules in net from the higher pressure to the lower pressure. That is exactly in ratio to the pCO2 difference, even if that was only 0.00001 bar difference.
Interestingly, that is also what happens in the vertical column of the atmosphere where pressure decreases with height and is part of the process of convective adjustment which negates the radiative imbalances that would otherwise be introduced by the presence of GHGs in the atmosphere.
Convection always works to negate the potential thermal effect of radiative imbalances so as to maintain hydrostatic equilibrium which involves the entire mass of an atmosphere, not just the radiative component.
But, the atmospheric dynamic is relatively fast. Oceanic turnover is very slow.
The atmospheric diversion adds nothing to the discussion, Ferdinand. The upwelling CO2 must accumulate, and it will accumulate until there is a balance with the downwelling. The time to equilibration is on the order of the time for THC circulation.
Bart,
The accumulation of CO2 is in the atmosphere, not in the ocean waters, because that is physically impossible. For further discussion, see the end of the long discussion…
– 13C/12C drop in the atmosphere
Ferdinand, you still have to show how your solution is consistent with a constant d13C of -13 per mil for the incremental CO2 ever since 1750 …
Sorry, this should have been further up thread in response to your statement “While “my” solution fits them all…”
Jim,
No problem, will drop it here:
Several lines of evidence:
– Coralline sponges growing in the ocean surface show a natural variability of +/- 0.2 per mil δ13C over hundreds of years and since ~1850 a drop of 1.6 per mil δ13C in exact ratio with human emissions. As the ocean surface – atmosphere exchanges are very fast (less than one year exchange rate), the ratio simply follows the atmospheric conmposition (with a shift in isotopic composition).
– Ice cores show a change of ~0.2 per mil δ13C during a deglaciation, which points to mainly the (deep) ocean CO2 following temperature.
– Ice cores show a variability of +/- 0.2 per mil during the whole Holocene and again start to drop since ~1850, a drop that extents in firn and direct measurements. Again in direct ratio to human emissions.
– Direct measurements in the atmosphere show that the source of low-13C is in the NH where 90% of all human emissions are.
Here the graph for coralline sponges (ocean surface) and atmosphere:
http://www.ferdinand-engelbeen.be/klimaat/klim_img/sponges.jpg
There are only two main sources of low-13C: recent organics and fossil organics. The biosphere is a proven sink for CO2, thus not the cause of the drop of δ13C, just the opposite.
All other CO2 sources or cycles (oceans, volcanoes, rock weathering,…) would increase the δ13C level in the atmosphere. Thus Bart’s solution (the extra CO2 comes from the oceans) violates the observed δ13C trend.
Ferdinand,
I am not sure you fully understood my point. You refer twice to the drop in d13C being in “exact [or direct] ratio with human emissions”. But this is wrong. The incremental atmospheric CO2 has a d13C of -13 per mil against human emissions of circa -26 per mil. You have argued in the past that this difference is due to “ocean thinning”. Perhaps it is. But my point is this: the d13C content of the incremental CO2 has stayed more or less constant since 1750. You can see this simply by looking at the two scales on the plot you show here. It is linear in d13C and it is linear in the reciprocal of CO2, which will only be aligned if the incremental d13C content is constant. In this case it can be calculated from the axes to be -12.8 per mil and recent measurements show that is now a little below -13 per mil, i.e. hardly changed. I find this to be a rather important relationship and I do not see how your response explains this constancy of content.
I would also question your comment that “– Direct measurements in the atmosphere show that the source of low-13C is in the NH where 90% of all human emissions are.” I do not see any evidence that the offset is linked to a time lag. On the contrary, the changes in trends are essentially time synchronous and indicate differences of less than one year. You can see this on your plot up-thread of annual d13C data for multiple sites. Here is just Mauna Loa and South Pole:
http://i64.tinypic.com/fw0tvt.jpg
JIm,
That is the same problem as with the “constant” airborne fraction of human CO2 in the atmosphere. Indeed that is rather constant over the past 60 years, but that is just by coincidence:
Human emissions increased a fourfold over the past 60 years. So did the increase in the atmosphere and the net sink rate. That gives a rather constant ratio of 50-55% between increase in the atmosphere and human emissions.
That is in fact the result of the near linear increase of yearly CO2 emissions. That gives a slightly quadratic increase of CO2 in the atmosphere and as the net sink rate is in direct proportion to the extra CO2 in the atmosphere (not the emissions of one year), the ratio between emissions and increase remains more or less constant.
If the emissions would get constant today, the increase in the atmosphere would asymptote to zero as the emissions still are higher than the sinks, but as the sinks grow, at a certain moment the sinks are equal to the emissions and CO2 levels remain constant with a airborne fraction of zero.
That is true for the 13C/12C level too, as that simply follows human emissions. Thus also the 13C/12C rate of change remains more or less constant…
Point two need some better detailed look: indeed it is a matter of time lag, not from parallel change, as there is a small difference in slopes between Mauna Loa and South Pole, which points to an increasing source in the NH.
That is more pronounced in the CO2 changes for the same stations (which have longer trends):
http://www.ferdinand-engelbeen.be/klimaat/klim_img/acc_co2_1960_cur.jpg
Hmm … a lot of coincidences there.
On point 2, the d13C data give us a CO2 fingerprint that we can use to check this hypothesis that the offset is due to a time lag.
The CO2 data:
http://i64.tinypic.com/w0s4l2.jpg
This shows the offset to be roughly 2 years. It also shows the slightly faster growth at Mauna Loa than at the South Pole, which you mention. However, despite the highest values being at Point Barrow, this shows slower growth than Mauna Loa, thus somewhat negating your argument that the NH source of anthropogenic CO2 is seen first at Point Barrow and later at Mauna Loa. Now, look at the d13C, where I have added Point Barrow to the plot I showed previously:
http://i66.tinypic.com/2h365b6.jpg
If we take -8 per mil as an example reference point, Point Barrow crosses this in mid-1988. Mauna Loa first reaches this value in early 1998, almost 10 years later! In contrast, this point is reached only 1 year later at the South Pole.
Perhaps the most obvious point, though, is the parallel nature of the trends, as particulalry highlighted by the period between 1987-88 and 1993-94. If anything, Point Barrow lags both Mauna Loa and South Pole.
I think the time lag hypothesis has a slight problem.
Oops, sorry about the size of the plots.
Jim,
As it takes time to distribute any change in the atmosphere from the source to the rest of the atmosphere, where the change is visible first is a matter of where the source is and how fast it is distributed over the altitudes and latitudes…
The lags are the first indications: the SH is lagging the NH with years (CO2) to many years (δ13C). There may be some reason for a permanent offset between some latitudes and others, but in the case of CO2, one would expect the reverse of what is observed: permanent higher levels near the upwelling places and lower near the poles. In the case of δ13C the same point: vegetation is a net, growing sink in extra-tropical forests, thus increasing the δ13C level near ground in the higher latitudes in the NH, while we see the firm drop there first.
The difference in slopes is secondary, that is clear between the NH and SH, less clear for CO2 and δ13C within one hemisphere, where the industrial shift between Europe and North America towards S.E. Asia may have played a role…
Jim Ross;
Upthread you asked Stephen Wilde and me to comment on this discussion you are having with Ferdinand.
I see no need to add anything to the discussion but I make the following observation on it.
Your arguments and evidence have defeated the assertions of Ferdinand; e.g. when you say
Ferdinand has replied to that with waffle, as is his usual practice when one of his assertions is refuted.
So, my observation is that it is time for you to walk away while smiling smugly because your arguments have ‘won the day’ and you don’t need to ‘rub his nose in it’.
Richard
Richard,
Thank you very much for taking the time to comment. It was just me and Ferdinand, so another view point is much appreciated.
Jim
Of course, I do not plan to try to rub Ferdinand’s nose in anything, because I respect the work that he has done, but I would like to see some recognition that the time lag hypothesis is contradicted by the data.
One more example. Ferdinand’s plot of the offsets upthread shows (on an annualized basis) an apparent time lag of almost one year between American Samoa and the South Pole. Or it shows a small CO2 offset with no time lag, or it shows something in between.
The d13C data show no time lag at all:
http://i67.tinypic.com/rt2ccm.jpg
Jim Ross.
If, as I suggest, the primary sources of the currently increasing CO2 are the sunlit oceans beneath the subtropical high pressure bands in each hemisphere then there will be some oscillation between the production rates in each hemisphere as the seasons change.
In the NH summer the production rate from the NH oceans may well match or even exceed the production rate from the SH oceans during their winter.
I would say that both regions combined would tip the net global production rate to positive during global warming periods but allow the net global production rate to become negative during global cooling periods.
So, whilst we see upward temperature stepping from one Pacific Multidecadal Oscillation to the next being associated with rising CO2 we would see downward temperature stepping from one PMO to the next being associated with falling CO2.
The upward and downward stepping across multiple PMO cycles being ultimately solar induced as explained by me elsewhere.
If the human emissions are all absorbed by more energised sinks locally and regionally then the conclusion that Ferdinand draws from the mass balance argument is inapplicable.
The ice cores plainly do not adequately retain an accurate record of such short term variability in atmospheric CO2 despite Ferdinand’s insistence that they do.
That only leaves the isotope conundrum and there must be another reason for that phenomenon despite Ferdinands assumption that the isotope ratio is conclusive evidence in support of his hypothesis.I doubt that we know all that there is to know about the isotope variations in the natural carbon cycle despite Ferdinand’s assumption that we do.
So, I would say that all three assumptions that Ferdinand bases his entire position on are fundamentally flawed.
Stephen,
Thanks for your input as well. I am mainly focussed on just the data at this stage of my scepticism, rather than trying to explain it with models. First, I want to try to understand what the data are telling us, unconstrained (as much as possible) by models.
So, with respect to the d13C data, what the data say is that, on average, the incremental CO2 has a value of -13 per mil. For example:
http://i64.tinypic.com/2qlwg42.jpg
This is called the Keeling plot and is only a straight line where the incremental CO2 has a constant d13C content – the value of which is the intercept. In this case it is -13.02 per mil and the other sites give very similar values. As you will know, this is roughly half way between a biosphere/anthropogenic source and an oceanic source.
This is clearly not conclusive evidence of an anthropogenic source, since it would be -26 per mil, or thereabouts. Ferdinand’s model (and the IPCC, I think) is that the atmospheric d13C is also being diluted by oceanic “turnover” of CO2. Is this possible, yes. Do we know it is the case, no. What we do see, however, is that the gradient of both the d13C trend over time and the Keeling plot (and hence the intercept) show a relationship with ENSO.
http://i65.tinypic.com/15i5c0p.jpg
We see the increase in CO2 growth rate in association with the El Niño, but we also see an increase in the rate of drop of d13C which can be calculated to show the content of the incremental CO2 is changing to a lower value, i.e. tending towards a predominantly biosphere (or anthropogenic) source. In contrast, during La Niña, the d13C is flat or even increases, the latter of which could only occur if the CO2 content of the incremental CO2 was higher than current atmospheric levels, i.e. tending towards a predominantly oceanic source. I will leave it there for now.
Jim Ross,
It is getting completely messy here…
Interesting plot anyway for the difference between Samoa and the South Pole. Indeed it seems that the trend at Samoa is slightly less steep down than of the South Pole, thus slightly lagging the change at the South Pole now.
– There may be two explanations: the emissions of the oceans near the equator substantialy increased.
– The biosphere increased its uptake.
The latter is observed, the former not, as that would have given an increase in the decay rate of the 14C spike from the atomic bomb tests and an increase in the “thinning” of the human fingerprint.
Indeed the latter:
http://www.ferdinand-engelbeen.be/klimaat/klim_img/deep_ocean_air_zero.jpg
The current thinning, excluding the biosphere, is around 40 GtC/year deep ocean – atmosphere circulation.
That is independently confirmed by the fast decay rate of the 14C spike, which is also calculated as ~40 GtC/year thinning by the deep ocean waters which are from long before the bomb tests.
In theory, deep oceans could be (partly) additional, but that is difficult to reconcile with the fact that the increase in the atmosphere is only half human emissions.
The average δ13C of the oceans after the isotopic shifts at the surface (both directions) is -6.4 +/- 0.2 per mil as measured in ice cores over the whole Holocene, assuming little average change in vegetation.
The discrepancy in the early years may come from the biosphere: party from human land use changes, partly natural: vegetation was probably a small source before 1990 and a small, but growing sink after 1990, begin 2000’s a net sink of around 1 GtC/year, that is effectively increasing the δ13C level with 1 GtC at +24 per mil by its uptake of preferably 12CO2 (that includes human land use changes since 1990).
At least since 1980 we can say that the δ13C levels follow human emissions at a rather constant ratio (about 1/3).
As any huge ocean emissions or even increase in cycle would increase the δ13C levels in the atmosphere, they can’t be the cause of the CO2 increase in the atmosphere.
Neither is the biosphere, as that is a proven sink for CO2, thus leaving relative more 13CO2 in the atmosphere…
BTW, the hugest changes in δ13C and CO2 are due to El Niño/ENSO and Pinatubo, but that are tempeorary changes which don’t last more than a few years and in average have near zero long-term effect…
Jim Ross,
The average δ13C of the oceans after the isotopic shifts at the surface (both directions) is -6.4 +/- 0.2 per mil
Can be misinterpreted: the istopic δ13C in the ocean waters is between zero (deep oceans) and +1 to +5 per mil (ocean surface).
The isotopic shift is -10 per mil ocean-atmosphere and -2 per mil atmosphere-ocean (thus +2 per mil in the atmosphere) average -8 per mil in the atmosphere vs. oceans for any back and forth cycle.
The -6.4 +/- 0.2 per mil is for the atmosphere over most of the Holocene…
“If you mean total CO2/derivatives in the water phase, that is just transported from sources to sinks as there is no forward or backward propagation, thus no “piling up” of CO2 in the water phase before it sinks.”
That betrays a total lack of familiarity with transport phenomena.
Bart,
The diffusion of CO2 in water is extremely slow (diffusion coefficient 0.0016 mm2/s). Much, much, much slower than the speed of the THC (~1.8 m/s).
Would need some very fast CO2 molecules swimming upstream just before the waters sink into the deep to give any piling up of CO2…
BTW, once in the atmosphere, CO2’s diffusion coefficient is 16 mm/s, further aided by wind and convection to spread all over the earth.
Has no relevance. See identical comment response above (accidentally hit wrong reply button).
Thank you all for your spirited comments on this thread.
People are talking openly about “the elephant in the room” and that is good.
For decades, climate scientists have been arguing about the magnitude of climate sensitivity to increasing atmospheric CO2 ( aka ECS or similar), when the only clear signal in the data is that CO2 LAGS temperature at all measured time scales.
Yes, there are probably several possible interpretations based on what we know today, but the conclusion one cannot make, given this Temperature-Leads/CO2-Lags observation is that increasing CO2 is a major driver of global temperature. This cannot be true.
Why? Because the future cannot cause the past. I’m reasonably confident about that.
Regards, Allan
The Original Mike M on April 10, 2017 at 7:24 pm
Increasingly more and more of it is gladly being sucked up by plants and recycled like the rest. It’s like fertilizing your lawn.
Interesting! This means that however many are the CO2 amounts we produce, they are so tiny compared with the natural sources (about 1% of them if I well do remember) that our CO2 emissions easily can be neutralised by natural sinks. Sounds understandible.
But, as I have very few knowledge about the atmospheric carbon cycle, I would be glad if The Original Mike M (or, alternatively, Bartemis or Afonzarelli) could explain me why, though additional, anthropogenic CO2 “more and more [] is gladly being sucked up by plants”, the atmospheric CO2 concentration nevertheless continually increases since 1850.
Why did the plants not neutralise these tiny anthropogenic sources as soon as they came up?
Does that mean that CO2 is able to rest in the atmosphere for inbetween over 150 years, and that the natural sinks didn’t need it yet, for example because they “preferred” for example the CO2 outgassed by the oceans?
Feel free to produce a rather formal, scientific answer! To be a layman does not necessarily mean that you don’t understand even crude equations. I managed to crunch a lot of them until now 🙂
Mike
I am with you all the way!!
Problem is how we can change the perception of many people & media in the world who have been brainwashed into believing that a change of 90 ppm of CO2 [0.009%] extra in the atmosphere is responsible for global warming and any ‘climate change’ in general….
henryp on April 11, 2017 at 10:24 am
…into believing that a change of 90 ppm of CO2 [0.009%] extra in the atmosphere is responsible for global warming and any ‘climate change’ in general.
This, henryp, is by far more interesting to read than any trial to tell me about Berlin’s temperature… in New Hampshire’s pampa.
Let me reply with some remarks.
1. Firstly, what you wrote is no answer to my central question to The Original Mike M:
Why did the plants not neutralise these tiny anthropogenic sources as soon as they came up?
2. Secondly, I would never agree at 100 % to what I emphasised out of your comment: a vast majority of people (including e.g. Roy Spencer) means warming is due half to natural, half to human sources, and so do I too.
3. Thirdly, the matter we discuss is not a matter of believing: it is a matter of knowledge.
I had a scientific and engineering education and decades of subsequent work based on them, but all that has been far far away from the math and physics needed to understand even basics of atmospheric rules wrt radiation phenomena.
So it took me some longer time to go for example into the work done 40 years ago by Joseph W. Chamberlain:
Elementary, Analytic Models of Climate: The Mean Global Heat Balance
hdl.handle.net/2060/19790010343
where he performed interesting calculations of two matters:
– the atmosphere’s opacity induced by trace gasses in general;
– the effect of even tiny trace gas concentrations due to their ability to increasingly close the atmospheric window (8 to 12 µ).
See especially section 4: Radiative Effects of Minor Constituents.
A far more elaborated paper concerning all this stuff was written by Chamberlain as well; he made later a 2nd edition together with Donald M. Hunten:
Theory of Planetary Atmospheres
http://tinyurl.com/m2ad2r3
A very important and useful book (a nice hint by blogger ‘Okulær’) to understand ‘peu à peu’ what happens above us was written by Michael F. Modest:
Radiative Heat Transfer
Third Ed. 2013
http://tinyurl.com/kqfdgj2
When you try to obtain at least a superficial essence of all that, you begin to understand the real role CO2 luckily plays: if there was only water vapor in the atmosphere, it would precipitate, and our magic planet would soon look like a giant snowball.
But you understand also that too much of this divine elixir called ‘trace gasses’ (CO2 isn’t the only one) can have unexpected consequences we should try to anticipate in due time.
It isn’t plants dictating the long term response. It is the oceans. The atmosphere is a flea on the ocean elephant’s back.
I hope it is apparent to people how much Ferdinand and the other choir boys rely on assertion to promote their case. They sometimes have a germ of truth, some laboratory result that they illegitimately extrapolate to this immense system. But, more often than not, they simply state something is so with little to no theoretical or empirical backing at all. Sometimes, they state with absolute assurance some trivial tautology that they have imbued with far greater import than it even marginally deserves.
It is cartoon science, and Just So stories all the way down. This is not genuine science. This is pre-Enlightenment hokum. I advise everyone to study how they do it. It provides a stunning window into pseudo-science, and how it gets propagated.
I hope that it is apparent to people that Bart’s hypothesis is based on one graph where he compares the variability and slope of temperature with the derivative of the CO2 trend. Thus effectively comparing apples with oranges: comparing a trivial trend in temperature with the CO2 derivative where almost all of the trend is removed,
His conclusion is that the trivial variability in temperature causes the [note: trivial (+/- 1.5 ppmv)] variability of CO2 around the trend of 90 ppmv. Which is right.
His conclusion is also that the trivial slope in temperature (0.7°C) causes the huge 90 ppmv CO2 increase, which violates Henry’s law and every other observation. That is only based on the artificial match of two slopes without any shred of other evidence.
It clear to me that Bart is a very brilliant person in his own profession, but he clearly lacks experience in simple process dynamics and only masks that by insulting others and refusing to acknowledge any observation that contradicts his theory…
Ferdinand, does seem like climate science isn’t looking at the dynamic nature of the system, but rely of averages of averages, with a large helping of thumb on the side.

You know there are clear sky nights, were well before morning, cooling rates slow to if not nearly stopped, stopped. Before the Sun comes up. And year just a few hours earlier it’s dropping 3-5F/hour.
The temperature that it stabilizes to, has nothing to do with co2. That’s why climate science is forever wrong, and why after 30 years, you’re still just chasing snipes. It’s great theater, but junk science.
Micro6500,
You are addressing that to the wrong person…
I do think that the effect of the extra CO2 is small and mainly beneficial for biolife and humanity.
The discussion here is about the cause of the rise: human or natural.
It is quite tempting to hypothesize that humans are not to blame, because if that is true, it doesn’t matter to look any further and any consequences simply simply not our fault.
Problem is that all observations point in one direction: human emissions. That the rise is from our emissions is as solid as scientifically can be proven.
Thus insisting on a non-human cause without very solid evidence is shooting in your own foot, as it undermines any valid arguments one has for the next step: the lack of dire consequences from that increase, as that is solely seen in failing computer models, not in the real world…
Sorry about the confusion.
But I do have solid evidence.
micro6500,
But I do have solid evidence.
Do you really have evidence that the increase in the atmosphere is not caused by human emissions – without violating one observation?
Bartemis
I understand most of your reasoning
Bindidon
your case is hopeless in the face of my own results
whether from Berlin or from the other 54 stations’ data that I analyzed
Guys
I looked at dt/dT for minimum temperatures to find [from the Rsquare] there is no man made global warming.
You are just wasting your time going into circles about the odd 90 ppms of CO2 that were added to the atmosphere in the past 50-60 years or so….
There is no man made global warming.
When the underlying water vapor goes away, temps drop like a rock. Conversely, min temps follow dew point temps. There is a big energy wall from water vapor that slows the drop in temperature.
Ferdinand
there is no way that you can prove globally that the pH of the oceans is going down.
but even if it were, it is the same as with the extra Co2 in the air: it acts like dung.
Battling against the bugs in the cooling towers, I found the paradox that decreasing pH actually caused more growths of the buggers….
There are giga tons of carbonates in the ocean and obviously more warming causes more CO2 in the atmosphere. This is logical.
HCO3- + heat => CO2 + OH-
50 years of reasonably accurate measurements is still not enough to make the deductions that you want to make. Bartemis is right. You are wrong.
{the Gleissberg solar weather cycle is 87 years}
henryp,
I don’t think the late Dr. Henry would agree…
0.7°C is all temperature increase we have had in decades (as far as reliable…). That is good for ~10 ppmv. That is all. Higher CO2 pressure in the atmosphere pushes more CO2 back into the oceans, despite the increased temperature. That is what is observed, no matter if Bart likes it or not…
That is not what is observed, whether Ferdinand likes it or not.

I think that’s about it. We’ve covered everything over and over again. It is very clear that human inputs have little impact on atmospheric CO2. It’s not even remotely a close call. Time will tell…
Bart,
That graph is pure fantasy, not based on any observation in the real world. The integral of T doesn’t cause CO2 to rise until eternity: it stops at 16 ppmv/K per Henry’s law.
You can’t bend physical laws because you have invented a nice theory. The real correlation is here:
http://www.ferdinand-engelbeen.be/klimaat/klim_img/acc_co2_1900_cur.jpg
http://www.drroyspencer.com/wp-content/uploads/simple-co2-model-fig01.jpg
There’s ferdinand’s dopey cumulative emissions graph again… The above has the accumulation rates during the MLO era (courtesy of dr spencer 2009). You can see where ferdi gets his 53% on average. The average of the airborn fraction goes from 60% down to 45% three times during this period. The two jumps back up to 60% (from 45%) are coincident with the well known step rises in temps circa 1980 & 2000. The parameters of ferdinand’s graph are such that they don’t pick this up, so the correlation looks tighter than it actually is. But there is Dr Spencer’s graph showing the correlation in all its great detail. (and not a very impressive correlation at that)…
Fonzie,
You are comparing noise with trends:
Temperature has a lot of noise and little trend while human emissions have little noise and a slightly quadratic huge trend. Combine these two and you have:
– A huge, slightly quadratic trend (90 ppmv) mostly caused by human emissions, with a small noise around the trend (+/- 1.5 ppmv), mostly caused by temperature variability.
– Still a slope in dCO2/dt, for both emissions and increase in the atmosphere, due to the quadratic increase of both originals.
– a lot of noise in the derivative.
Of course, you can compare variabilities which show that T variability is the cause of dCO2/dt variability, but you can’t say anything about the slope of T compared to the slope of dCO2/dt, as that is comparing one variable with the derivative of another variable, thus largely detrended for the second one.
Moreover, the slope of human emissions is about twice the average slope of the growth in the atmosphere.
There is no reason to assume that humans are not responsible for the increase in the atmosphere, as that fits all observations. There are lots of reasons to doubt that temperature is the main cause, as that violates every single observation, including Henry’s law for the solubility of CO2 in seawater.
That the increase in the atmosphere is about 50% in the past 60 years is pure coincidence and caused by the linear increase of human emissions: that causes a linear increase in the atmosphere and thus a linear net sink rate. Net effect: 50% average increase, modulated by temperature variability.
If human emissions halved, the average increase in the atmosphere would be zero, zero “airborne fraction”, because the sinks would equal human emissions. Still modulated by temperature variability. That is at 400 +/- 1.5 ppmv in the atmosphere plus any trend in temperature, which is good for maximum 16 ppmv/K…
Many thanks to Ferdinand Engelbeen for his experience, the accuracy of his thoughts, and… his incredible patience with people who manifestly feel better in insulting than in a sound and polite scientific debate.
SIT ON IT, BINDI(!)
(☺)
Jessah Fonzi!
Many thanks to Father Orazio Grassi for his experience, the accuracy of his thoughts, and… his incredible patience with people who manifestly feel better in insulting than in a sound and polite scientific debate.
– The Vatican
PS: for those who are unaware. “Sit on it” was the stock jibe used in the 1970’s era TV Series to which the screen name “afonzarelli” refers.
Thanks Bindidon…
I have been discussing with green groups a long time ago about a different item (chlorine, the element of the devil…), the insults here are very modest, compared to what I have met there… So, I learned that people like Bart will never even consider that they may be wrong and I learned that staying calm and giving all arguments will never convince them, but may convince people who like to listen to arguments of both sides and make up their own mind…
Seriously, Ferdinand. Have you given thought to the fact that you may be, indeed are, wrong?
Seriously, Bart, Have you given thought to the fact that you may be, indeed are, wrong?
Seriously, Bart, Have you given thought to the fact that Ferdinand may be, indeed is, right?
About as much as I give to the possibility that I might be wrong when I say 2 + 2 = 4.
It’s really not a close call.
It’s a crying shame Bart, you actually might have been able to make a positive contribution to science, if your oversized ego didn’t get in the way.
I’ve done quite enough of that already. But, thanks for your concern.
Oooops….I forgot, in your mind you think posting on blogs is “contributing to science.”
Oops… I forgot you were pathologically egocentric, and did not know people have lives apart from what you personally observe. Yes, Mikey. We are all just props in the drama of your very special and unique life experience. Carry on.
Darby, Bart’s a pretty humble guy… The problem here is Ferdinand, who is a fairly obtuse fellow. That combined with his sheer gravitas pretty much drives away the many competent commentors who would likely engage in a discussion about the carbon data. (bart, i think that the rest have decided long ago that it’s better to just spend their time teaching the dog latin) Bart is the lone “hangers on” and thus gets piled upon by the engelbeen cohort. Now, their discussion is not without its reward for the “people who like to listen to arguments of both sides and make up there own mind” (as ferdi put it). There is a wealth of info and insight that comes from both of these men. We’re very fortunate to be privy to a discussion that is conducted at this high a level. My main concern is that they might not be asking that question (a la feynman) “where am i going wrong?” enough. For it is in assuming that we are wrong that advances our thinking into areas that might not be considered. i’d hate to see them come this far in such a discussion (that has truly been special) only to have the discussion ultimately stunted by not considering the possibility that certain assumptions being made are wrong…
afonzarelli,
There are not many things that surprise me anymore these days on my age. Your words anyway about a “humble Bart” and an “obtuse Ferdinand” floored me completely…
I have not the slightest difficulty to admit that I am wrong, I make mistakes, as all of us do from time to time. The only point is that one has to show where I am wrong with real, verifiable arguments.
I know that I may be too pushing once I am convinced of what is right or wrong and often forget to show all the details why I think why something is right or wrong… But in discussions like this one, all the details come up with question and answer…
Anyway, I had some background correspondence with interesting people we miss these days and I can assure you that it is not because of my behavior that they don’t comment here anymore…
FERDINAND, YOU ARE AS THICK AS A BRICK (!!!)
Just kidding, just kidding… (a little jocularity here to leaven the dough) Firstly, Ferdinand, my words shouldn’t “floor” anyone, because my words aren’t that important. If i were to rephrase what i said, i would add the word “willfully” to “obtuse”. Whether or not that is the reality of how you come across, it sure is the perception. And when people see that, they either respond in kind or they don’t bother showing up. So one never knows what the comments page would look like in your absence (or rather, if you employed a more “feynman” like approach)…
As for the rest of my comment, let me give you a “for instance”… Suppose we do see a cooling spell over the next decade. If the temp/carbon growth correlation falls apart then of course the discussion would be over, and ferdinand would emerge as the victor, vindicated. But, suppose it doesn’t fall apart? The discussion would then shift to whether or not the rise is still anthropogenic. i say, wouldn’t it make sense to have that conversation now (rather than waiting five years)?! Why not assume the correlation is true so as to keep the learning process alive. And on the other side, why not assume, say, that ice cores are valid so that there could be a discussion as to why co2 levels are anomolously high (even if the temp/carbon growth correlation is deemed true)? It’s pretty much just you and bart who are having this discussion, at least at this blog. And it would be a shame if y’all didn’t get that far in your discussing. Every possible “contingency” should be discussed, that making for a proper discourse…
For the record, Ferdinand is a very nice fellow, and I do appreciate his dialogue. I have nothing against him. I just know he is wrong. But, I do not believe it is maliciously so.
Fonzie,
Thanks for the clarification…
Indeed I may be pushing, but that is only after studying the object in depth in all aspects.
As said before, my job was introducing (theoretical/laboratory) inventions in the real world of chemical processes. When things did go wrong (which was quite frequent), the fastest way to know what did go wrong was to eliminate the impossible causes. What was left were one or a few possible causes.
That is what I applied here too… Bart’s theory seems theoretically possible, but it violates about every observation in the real world…
In first instance I didn’t know why there was such a nice correlation, but after years of discussion and increasing knowledge, I have an alternative explanation which shows exactly the same behavior as Bart’s solution: human emissions cause almost all increase and temperature almost all variability around the increase.
So. we have two competing hypothesis, both fitting the increase and variability in the atmosphere, where one fits all other observations and the other one none. For me it is clear which is right and which is wrong…
I did consider all evidence, without excluding temperature as main cause, but temperature as cause of the bulk of the increase is simply impossible, as that violates Henry’s law for the solubility of CO2 in seawater as main point (and all other observations)…
“I have an alternative explanation which shows exactly the same behavior as Bart’s solution.”
Just as you can draw enough epicycles to approximate the position of the planets over a given timeline. But, your model is not based on physics, merely curve fitting.
“I did consider all evidence…”
You selected evidence carefully, and imbued it with an interpretation congenial to your desired outcome, ignoring fundamental physical considerations. Any evidence that goes against your desired outcome, you summarily dismiss, e.g., alternative CO2 records to the ice cores, the amazing consistency between the trend in the rate of change and the temperature anomaly, etc…
“…as that violates Henry’s law for the solubility of CO2 in seawater as main point…”
It doesn’t. But, you have arbitrarily decided that equilibrium occurs virtually instantaneously over the entire 1.4 yottagrams of the oceans. It is absurd, and it violates causality.
Ferdinand:
You wrote
That is a keeper! You are often wrong and you NEVER admit it.
For example, this example from about an hour ago.
Richard
Fonzie –
“And on the other side, why not assume, say, that ice cores are valid so that there could be a discussion as to why co2 levels are anomolously high (even if the temp/carbon growth correlation is deemed true)?”
If the ice core proxy measurements are valid, then the CO2 regulatory system is high bandwidth, and insensitive to human inputs. This is necessary to achieve such remarkable stability over such a long timeline. Any significant change thereby still had to come from nature.
The temperature dependency we see today would somehow have had to be suppressed. The only way I can think of that happening off the top of my head is if the other strong parameter governing the THC, salinity, were somehow sync’d with the temperatures, but that relationship somehow dissipated in the prelude to the last 59 years.
But, this is all academic. In the past 59 years, the temperature anomaly to CO2 rate of change relationship has been prominent, and that covers the time period in which atmospheric CO2 rose from about 310 ppmv to its present value, which is by far the lion’s share of the observed rise.
Bart,
Again,
The equilibrium between atmosphere and ocean surface is fast and is what we see (including the response by vegetation) month by month, year by year, in the atmosphere. There is zero indication that the deep oceans react fast in any way. 0.02 ppmv/year increase over a deglaciation is not really fast compared to 2 ppmv/year in recent times…
Thus the equilibrium is between the 1000 GtC in the ocean “mixed layer” and the atmosphere, not with the deep oceans.
For the rest I have responded on about everything in detail with what is observed. The epicycles are entirely on your side…
“There is zero indication that the deep oceans react fast in any way.”
Indeed, they do not. The response takes centuries to equilibrate the change in surface temperature to the depths. And so, the CO2 increases at the surface until the oceans can respond.
That is why you get a rate of change relationship. For example, consider a simple relaxation system described by
dx/dt = -x/tau + u
If x is zero at time zero and u is constant, it eventually settles out to x = u*tau. The time constant tau characterizes the response time. If it is large, then for any time that is short in comparison, you have
dx/dt := u
The derivative of x is approximately the input u. It does not settle out to a constant level until the timeline is on the order of tau.
Richard,
Your “proof” that I am wrong is only your misinterpretation of the satellite data:
The OCO-2 satellite measurements indicate that ALL the CO2 from human activities is sequestered by sinks local to its emission sites.
1. The satellites theoretical resolution is ~0.1 ppmv.
2. The satellite does follow the midday line and takes snapshots of the midday areas.
3. Photosynthesis is at maximum around midday.
4. Human emissions are average ~0.1 ppmv/day.
5. Human emissions are concentrated in specific areas (towns, industrial) with higher emissions.
6. The satellite can focus on specific areas for longer periods, thus enhancing the resolution.
If human emissions are visible in the satellite data at specific areas depends of 1. – 6.
Thus it is possible that all human emissions around midday are all removed by the next available tree (which doesn’t change the mass balance with one gram), thus masking human emissions.
The satellite doesn’t measure at night, when factories still are working and emitting and heating (in winter) is at full speed in cold areas and there is no photosynthesis…
As far as I know they haven’t used the focus possibility of the satellite until now, as they still seem to have troubles to calibrate the data with near ground data.
Thus sorry Richard, absence of good data is not proof of anything.
Bart,
the CO2 increases at the surface until the oceans can respond.
We can start the whole discussion again…
There is no known increase in the upwelling from the deep oceans, some is now upwelling from 800 years ago, but the MWP was at about 290 ppmv, not really high…
There is no increase in the oceans from higher temperatures, as that depletes every point at the surface where the temperature is higher than before.
If there is a CO2 increase in the surface layer with warming waters, the only way that is possible is if the CO2 pressure in the atmosphere increased beyond the pCO2 increase in the ocean surface…
But let us assume that the deep oceans increase their upwelling with u.
dx/dt = -x/tau + u
Between atmosphere and deep oceans tau is observed ~51 years (including the smaller uptake in vegetation). Thus if the upwelling (into the atmosphere, not the total upwelling in the waters) increased from ~40 GtC/year (steady state) to 41 GtC/year, the direct effect would be 1 GtC in the first year extra, pushing the levels in the atmosphere up with ~0.5 ppmv, etc. until the pressure in the atmosphere gets high enough to push as much CO2 back into the deep oceans as extra emitted. That is at 0.5/0.02 = 25 ppmv extra in the atmosphere. Thus the extra u should be at least 4 GtC/year to give 110 ppmv above steady state as observed now. That is a near impossible 10% constant increase in upwelling…
That is for a constant u, but the increase in the atmosphere is not getting assymptotic to 110 ppmv, they are rather quadratic increasing over time. Thus u is not constant but must increase linear over time.
Indeed all mathematically possible, but there are a few problems with the observations:
Such a huge increase in ocean turnover would be measurable in a lot of observations: residence time (shorter), 13C/12C ratio (higher), 14C level (lower),…
Human emissions even are twice the increase in u level. Thus such an increase in deep coean turnover is not “dwarfing” the human emissions…
“…tau is observed ~51 years…”
Not even remotely. For the system at hand, an analogous time constant would be on the order of centuries to millennia. It cannot outpace the THC turnover.