Over the weekend, we reviewed the state of the solar data for March 2017. Now, there’s a two week straight lack of sunspots, the longest stretch since 2010.

Overview
The sun is currently blank with no visible sunspots and this is the 14th straight day with a blank look which is the longest such stretch since April 2010 according to spaceweather.com. Historically weak solar cycle 24 continues to transition away from its solar maximum phase and towards the next solar minimum. In April 2010 – the last time there was a two week stretch with no visible sunspots – the sun was emerging from the last solar minimum which was historically long and deep. There have already been 26 spotless days in 2017 (34% of the entire year) and this follows 32 spotless days last year which occurred primarily during the latter part of the year. The blank look to the sun will increase in frequency over the next couple of years leading up to the next solar minimum – probably to be reached in late 2019 or 2020. By one measure, the current solar cycle is the third weakest since record keeping began in 1755 and it continues a weakening trend since solar cycle 21 peaked in 1980. One of the impacts of low solar activity is the increase of cosmic rays that can penetrate into the Earth’s upper atmosphere and this has some important consequences.

Comparison of all solar cycles since 1755 in terms of accumulated sunspot number anomalies from the mean value at this stage of the solar cycle. Plot courtesy publication cited below, authors Frank Bosse and Fritz Vahrenholt
Third weakest solar cycle since 1755
A recent publication has analyzed the current solar cycle and has found that when sunspot anomalies are compared to the mean for the number of months after cycle start, there have been only two weaker cycles since observations began in 1755. Solar cycle 24 began in 2008 after a historically long and deep solar minimum which puts us more than eight years into the current cycle. The plot (above) shows accumulated sunspot anomalies from the mean value after cycle start (97 months ago) and only solar cycles 5 and 6 had lower levels going all the way back to 1755. The mean value is noted at zero and solar cycle 24 is running 3817 spots less than the mean. The seven cycles preceded by solar cycle 24 had more sunspots than the mean.

Daily observations of the number of sunspots since 1 January 1900 according to Solar Influences Data Analysis Center (SIDC). The thin blue line indicates the daily sunspot number, while the dark blue line indicates the running annual average. Last day shown: 28 February 2017. (Graph courtesy climate4you.com)
Read more at Paul Dorian’s Vencore Weather
Now that mostly everything was said and done, one may be forgiven to think that there is no meaningful link between solar activity and the instrumental temperature records.
That may or may not be so, but the data does show a degree of ‘familiarity’, consequently perhaps it would be wise, at least for the time being, to conclude that ‘we simply don’t know’
http://www.vukcevic.talktalk.net/GTC.gif
vukcevic March 24, 2017 at 12:53 pm
Hi Vuks, could you elaborate on North Atlantic tectonic counts for us.
V0 and above
Check this out Vuks. Woweeee were on our way..
Heat from Earth’s core could be underlying force in plate tectonics
Greg Borzo
January 17, 2017
https://news.uchicago.edu/article/2017/01/17/heat-earths-core-could-be-underlying-force-plate-tectonics
For decades, scientists have theorized that the movement of Earth’s tectonic plates is driven largely by negative buoyancy created as they cool. New research, however, shows plate dynamics are driven significantly by the additional force of heat drawn from the Earth’s core.
The new findings also challenge the theory that underwater mountain ranges known as mid-ocean ridges are passive boundaries between moving plates. The findings show the East Pacific Rise, the Earth’s dominant mid-ocean ridge, is dynamic as heat is transferred.
….The researchers estimate up to approximately 50 percent of plate dynamics are driven by heat from the Earth’s core and as much as 20 terawatts of heat flow between the core and the mantle……
The heat we get from the Sun is 5600 times larger than the heat we get from below. So we can discount the latter as far as the heat budget of the atmosphere goes.
N. Atlantic’s intermediate and deep-water currents (ocean conveyor belt) crisscross the MAR whereby stratification is affected by the narrow vertical band of the concentrated heat originated from below.
http://www.mar-eco.no/learning-zone/__data/page/112/current-map3.jpg
So? there is not enough energy in any of this to have any effect on the climate.
Thanks Dr. S.
But I had to take a lookey see for myself.
The image below is from 2010.
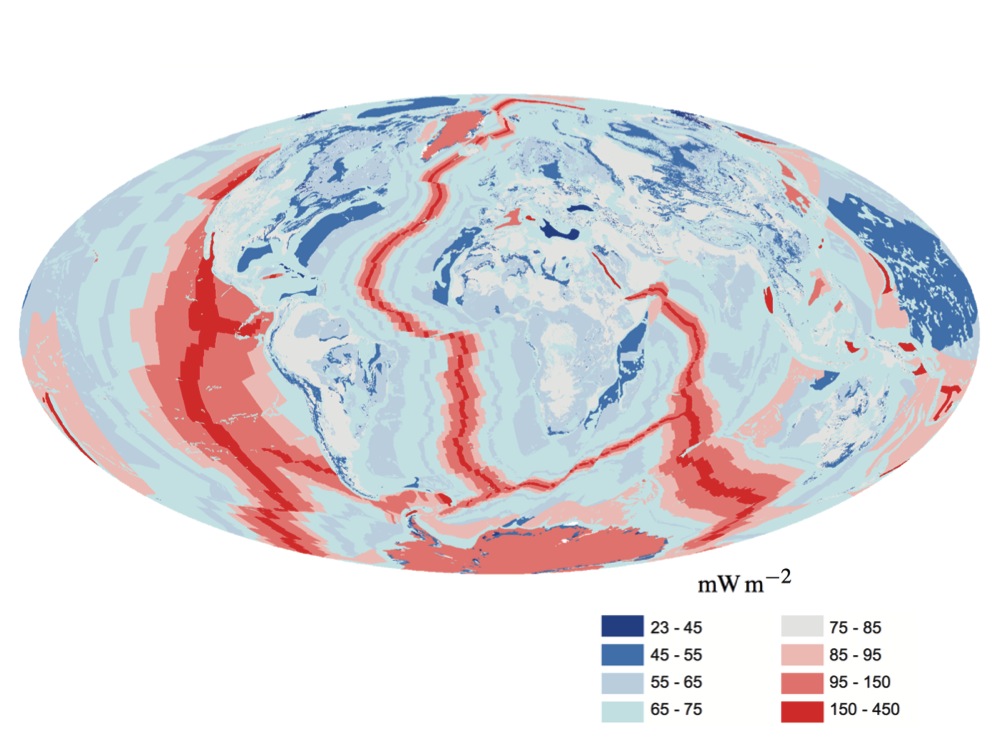
Global map of the flux of heat, in mW/m2, from Earth’s interior to the surface.[1] The largest values of heat flux coincide with mid ocean ridges, and the smallest values of heat flux occur in stable continental interiors.
J. H. Davies and D. R. Davies – Davies, J. H., & Davies, D. R. (2010). Earth’s surface heat flux. Solid Earth, 1(1), 5-24.
The number you see are milliwatt [one thousandth of a Watt]. Note how puny the heat actually is.
Here’s a newer version Dr. S. I’ll look again, might be something even newer….
Global map of solid Earth surface heat flow
Authors
J. Huw Davies
First published: 19 October 2013
http://onlinelibrary.wiley.com/store/10.1002/ggge.20271/asset/image_n/ggge20271-fig-0007.png
Global map of Earth Surface Heat Flow, in mW m−2. It uses the individual components given by Figures 2-4. All component estimates were derived using the mean.
in mW m−2
In milliwatt
Completely negligible
Have to link to the full article, image wont paste here.
Global map of solid Earth surface heat flow
Authors
J. Huw Davies
First published: 19 October 2013
http://onlinelibrary.wiley.com/doi/10.1002/ggge.20271/full
“So? there is not enough energy in any of this to have any effect on the climate”
directly but ‘enough energy’ to slightly increase the temperature of the deep-water current crossing the MAR and consequently affecting efficiency of the deep conveyor pump (deep meridional overturning cell) operating south-west of Iceland.
However, science advances with the mindset changed.
So we went from “20 terawatts of heat flow between the core and the mantle.” To only milli watts by the time it reaches the Ocean floor?
I know you said milli watt negligible Dr. S., but before I have my first drinky pooh for this week, I will wonder what happened to the, 20 terawatts of heat flow between the core and the mantle……

Until next time…
the 25 terawatt is 200 milliwatt per square meter at the core-mantle boundary and 50 milliwatt per square meter at the surface. Can’t people compute anymore? Jeez.
So if Earth’s rotation slows down, when solar wind pressure is high, like over an extended period of time, like a not so grand solar maximum period, the core might heat up.
Then we might expect Earth’s rotation to speed up, over a period of time, like a solar minimum period, when we see extended periods of lower solar wind pressures and Earth’s core cools down.
So if Earth’s rotation slows down, when solar wind pressure is high, like over an extended period of time, like a not so grand solar maximum period, the core might heat up.
No, this is complete nonsense.
Could you please then explain why the Earth’s rotation is sometimes faster and sometimes slower and how that might change eccentricity, pole locations, core heating/cooling, generation of magnetic fields, tectonics and on and on and on….
Prolly not..
The Earth’s rotation varies as the climate [temperature] varies. None of the other things you mention are influence by that.
Bidecadal earth’s rotation variability is concurrent with the solar magnetic cycles oscillations.
https://hal.archives-ouvertes.fr/hal-01071375v2/document
No, there are not. The variations are caused by coupling between the core and the mantle. This is well-established. The Sun has nothing to do with this.
It’s not the burning of fossil fuels, it’s the extraction of fuels from the Earth that puts a sinking feeling in my gut.
No, Carla not sinking, SUBSIDENCE!
Leif Would you care to comment on this new Russian data.?
http://notrickszone.com/wp-content/uploads/2017/03/Cooling-Cosmic-Rays-Stozhkov-2017.jpg
This is Fig 2 at
http://notrickszone.com/2017/03/23/russian-scientists-dismiss-co2-forcing-predict-decades-of-cooling-connect-cosmic-ray-flux-to-climate/#sthash.OI8LqaAV.k21OB7Vx.dpbs. Cf future temp forecasts there in Stozhkof Fig1 with forecast in Page – 2017 Fig 12 in same link.
Their Figure 1 seems to contradict the whole paper:
http://notrickszone.com/wp-content/uploads/2017/03/Cooling-Predicition-Cosmic-Rays-Stozhkov-2017.jpg
Solar activity has gone down since 1960 and cosmic ray intensity therefore has gone up, yet temperatures have also gone up, showing that when the sun cools, the earth warms [at least since 1960]. There is no evidence [other than wishful curvefitting] for the extrapolation shown in Figure 1.
lsvalgaard March 24, 2017 at 3:20 pm
“So? there is not enough energy in any of this to have any effect on the climate”
The MAR hydrothermal plumes initial temperature is in the range of 300-400C with PH of 2, can be many km long and rise to height up to 3km before temperature and PH are equalised with surrounding ocean’s water mass.
‘Enough energy’ to change stratification of the deep-water current crossing the MAR and consequently affecting efficiency of the deep conveyor pump (deep meridional overturning cell) operating south-west of Iceland.
http://www.mar-eco.no/learning-zone/__data/page/112/current-map3.jpg
hydrothermal plumes initial temperature
Overall, we are talking about milliwatt compared to hektowatt. Completely negligible.
Polar jet stream is a powerful atmospheric circulation and yet it gets deflected by static high pressure (with comparatively very little energy) to the southwest of Iceland.
North Icelandic Jet is a deep-reaching ocean current that contributes to a key component of the Atlantic Meridional Overturning Circulation (AMOC), also known as the “great ocean conveyor belt,” which is critically important for regulating the Earth’s climate. The NIJ crosses the MAR both to the north and the southwest of Iceland.
Two Icelandic ‘control knobs’ of the N. Hemisphere’s climate natural variability. bye bye
Perhaps you need a short course in where the Earth’s atmosphere gets it energy from:
http://www.leif.org/research/Where-Does-The-Atmosphere-Get-Its-Energy-From.png
No I’m not going there, it is wise to steer clear of specialist’s obfuscations.
I don’t need to tell you that foot on the break/accelerator doesn’t provide energy for your car. Similarly I don’t need to state that the MAR doesn’t provide the energy either for warming or cooling. The MAR’s heat energy is a ‘foot on/off ‘ the brake on the deep ocean currents (the key component of the Atlantic Meridional Overturning Circulation -AMOC) criss-crossing the ‘boiling hot’ rift valley that runs along the axis of the ridge.
Further more there is some correlation between solar and N. Atlantic tectonic activity (see graph posted at March 24, 2017 at 12:53 pm)
No I’m not going there
Being learning-resistent again?
foot on the break/accelerator doesn’t provide energy for your car.
What brakes the car is not the foot, but the friction in the brake assembly. And there is what the energy is.
Your analogy with MAR and the foot is obviously false, especially since the thermal energy from below does not vary in time scales of interest.
“thermal energy from below does not vary in time scales of interest.”
Both variables the N. Atlantic tectonic count and the 11 year change in the Group Sunspot Number have 6 major peaks since 1650’s, which makes is it 60 year periodicity, btw the same as the well known component as found in the so called ‘global temperatures’.
You may not like it, but there it is in the data.
It is not in the data, but in your head. The ‘change’ in the group number is not a meaningful variable for this.
Study this to learn about spurious correlations http://www.tylervigen.com/spurious-correlations
Thanks, Doc- That link is a hoot!
vukcevic March 25, 2017 at 2:53 am
Bidecadal earth’s rotation variability is concurrent with the solar magnetic cycles oscillations.
https://hal.archives-ouvertes.fr/hal-01071375v2/document
————————————————-
Thanks Vuks,
From your article,
“”Analysis shows that the LOD variability follows
change in the solar magnetic field orientation. The Earth’s
rotation acceleration is concurrent with decay of the even and
continues during rise of the odd cycles. The rotation
deceleration is concurrent with decay of the odd and continues
during rise of the even cycles ; in other words change in the rate
of the Earth’s rotation follows the hemispheric sunspots’
magnetic (Hale) cycle as shown in the Fig.2″”
I do think that there can be external ‘components’ influencing LOD, Earth rotation speed.
Aside from the above. A good whack from a sizable space rock might mess rotation up for a while, as an example.
I have seen some other articles that tried to link LOD to the rise and fall of solar cycle.
Gotta check the spaceweather thread started here at WUWT.
I have seen some other articles that tried to link LOD to the rise and fall of solar cycle
The internet is a good medium for dissemination of misinformation to the gullible.
The LOD component concurrent with solar magnetic field cycles is about 25% of the total, if I remember correctly.
There are no LOD variations caused by your artificially constructed double solar cycle. Decadal [and longer] variations are caused by core-mantle interactions and have nothing to do with solar magnetism that cannot penetrate that deep.
It is nowhere said so. Obviously you didn’t bother to read either ‘Discussion’ or ‘Conclusion’ sections before you made the out of place comment.
The LOD component concurrent with solar magnetic field cycles
So, you retract the above and now claim that there is no physical or causal relationship.
“nowhere said” that there was.
I did read the conclusion:
“However, at this stage of the research, it is not possible to attribute cause directly to the solar activity, while possibility of viable indirect mechanism can not be excluded.”
The first part is correct. The second part [about indirect mechanism] does not follow from the ‘analysis’. You might as well have said: “possibility of the Moon made of green cheese can not be excluded”. Your ‘analysis’ does not show that an indirect cause cannot be excluded. Physics excludes such mechanism.
“viable indirect mechanism can not be excluded.”
such as : “Solar activity – ocean & atmospheric temperatures – oceanic and atmospheric circulation – angular momentum exchange – Earth’s rate of rotation (LOD) – secular change in perceived
geomagnetic field.
“green cheese” is fine, if you like that sort of thing, but not for me thanks, at least not on this occasion.
You do not examine if there is enough energy or physical couplings so you have no basis for saying that those mechanisms cannot be excluded since you have not looked at how they might work. Your statement is void of meaning and looks like a lame attempt of CYA.
One CAN exclude all of your proposed mechanisms on grounds of lacing energy of physical coupling.
Title of the paper is:
“Evidence of length of day (lod) bidecadal variability concurrent with the solar magnetic cycles” and that is what is meant then, now and in the foreseeable future, until refuted.
‘concurrent’ means ‘at the same time’ or ‘simultaneously’, but doesn’t mean that one is caused by the other.
If they were not, there is no need to pretend [or peddle] that they are. That you post on this shows that you believe they are. If you really meant that they were just random occurrences your comment would not make sense.
But, now you are saying that there really is no connection. Fair enough.
Jury is still out on the Solar/LOD connections..Dr. S.
The PPT below covers the period depicting the overall decline of the recent solar cycles.
European Geosciences Union, General Assembly 2016
Vienna | Austria | 17 – 22 April 2016
On searching applicants for mechanism of solar-lithosphere relations
Kairatkyzy D., kairatkyzy.dina@mail.ru, Andreev A. alexey.andreyev@rambler.ru, Saltanat Zhumabayeva, Alibek Seraliyev
“Institute of Ionosphere”, “National Center for Space Research and Technology”, Almaty, Kazakhstan
Conclusion
For the time interval of 42 years (1973 – 2014) the variations in solar activity, the LOD, global seismic activity are analyzed. It is shown that a long-term increase in global seismic activity is accompanied by a long-term decrease in the level of solar activity, and a long-term decrease in the LOD (increase in the Earth’s angular velocity). The subject of our further research will be a study of long-term variations of the amplitudes of tidal LOD harmonics in relation with variations of solar and seismic activities….””””
Jury is still out on the core heat flows and the amount of heat on ocean floors from volcanoes, vent fields and tectonic activity.
Diffuse venting at the ASHES hydrothermal field: Heat flux and tidally modulated flow variability derived from in situ time-series measurements
http://onlinelibrary.wiley.com/doi/10.1002/2015GC006144/full
Eric Mittelstaedt, Daniel J. Fornari, Timothy J. Crone,
James Kinsey, Deborah Kelley, Mitch Elend
27 April 2016
Abstract
…ASHES hydrothermal field located in the caldera of Axial Seamount, Juan de Fuca Ridge…
…Over the ∼12 day deployment, median upwelling rates and mean fluid temperature anomalies ranged from 0.5 to 6 cm/s and 0°C to ∼6.5°C above ambient, yielding a heat flux of 0.29 ± 0.22 MW m−2 and heat output of 3.1± 2.5 kW. Using a photo mosaic to measure fracture dimensions, the total diffuse heat output from cracks across ASHES field is estimated to be 2.05 ± 1.95 MW. Variability in temperatures and velocities are strongest at semidiurnal periods and show significant coherence with tidal height variations. These data indicate that periodic variability near Phoenix vent is modulated both by tidally controlled bottom currents and seafloor pressure, with seafloor pressures being the dominant influence. These results emphasize the importance of local permeability on diffuse hydrothermal venting at mid-ocean ridges and the need to better quantify heat flux associated with young oceanic crust….
The PPT below covers the period depicting the overall decline of the recent solar cycles.
Very clever. No PTT.
Your second quote is not relevant as it is not concerned with climate and is nothing new.
No PPT.
The link to the Power Point Presentation PPT titled, “On Searching Applicants for Mechanism of Solar-Lithoshphere Relations,” below.
European Geosciences Union, General Assembly 2016
Vienna | Austria | 17 – 22 April 2016
On searching applicants for mechanism of solar-lithosphere relations
https://www.google.com/url?sa=t&rct=j&q=&esrc=s&source=web&cd=3&cad=rja&uact=8&ved=0ahUKEwj3mPeiwfLSAhWE7yYKHXYGCvkQFggkMAI&url=http%3A%2F%2Fpresentations.copernicus.org%2FEGU2016-11429_presentation.ppt&usg=AFQjCNG95yTXtETUUFPGWic7woRFpOg0aA
Abstract here:
On searching applicants for mechanism of solar-lithosphere relations
http://adsabs.harvard.edu/abs/2016EGUGA..1811429K
The increase in earthquakes over solar cycle 24 is as striking as the temperature anomaly for the same period.
http://www.leif.org/research/LOD-Variation.png
But nothing about LOD.
If you would care to look for yourself:
http://www.leif.org/research/LOD-Variation.png
you could see how flimsy that and other claims are.
gripegut on March 22, 2017 at 9:02 pm
I really don’t know how long these types of volcanic eruptions affect temperature, nor do I know what level of solar activity was occurring in the 300 years before the Maunder Minimum, but my guess is that the volcanic eruptions caused much of the cooling before the Maunder Minimum.
Let me continue our little discussion…
In 2012 an interesting article was published concerning that point:
‘Abrupt onset of the Little Ice Age triggered by volcanism and sustained by sea-ice/ocean feedbacks’
http://onlinelibrary.wiley.com/doi/10.1029/2011GL050168/pdf
It was tho origin of many contradicting reactions, especially here at WUWT (from Anthony Watts as well as from Willis Eschenbach), together with a more convincing one from 6 scientists:
‘Reply to Miller et al. (2013) Substantial agreement on the timing and magnitude of Late Holocene ice cap expansion between east Greenland and the eastern Canadian Arctic: a commentary on Lowell et al. (2013)’
http://www.geology.um.maine.edu/publications/lowelletalreply2013.pdf
Somewhat later however, the origin of the 1257 eruption was detected by a group of scientists:
‘Source of the great A.D. 1257 mystery eruption unveiled, Samalas volcano, Rinjani Volcanic Complex, Indonesia’
http://www.pnas.org/content/110/42/16742.full
Another very interesting publication in 2015 :
‘Indications for a North Atlantic ocean circulation regime shift at the onset of the Little Ice Age’
It is kept behind paywall
http://link.springer.com/article/10.1007/s00382-015-2561-x
but the submission revision is free
http://www.pik-potsdam.de/~carls/publications/schleussner_divine15_draft.pdf
This recent paper is hard to digest but shows in very impressive manner how scientists managed to detect a rather abrupt, local transition from the MWP to the LIA by using several disjunct proof paths.
lsvalgaard March 25, 2017 at 8:08 am
No, there are not. The variations are caused by coupling between the core and the mantle. This is well-established. The Sun has nothing to do with this.
—————————————————————-
I decided to start a list of possible mechanisms affecting, Earth Rotation LOD.
1. coupling, core and mantle (core rotation speed)
2. Lunar and solar tides and gravity
3. Solar winds, density and magnetic pressure
4. Orbital drag and orbital speed 18.5 miles/sec (30 km/sec)
5. Other stresses, natural and
Coincidentally, the Earth has been speeding up since the suns magnetic field has been on the decline.
http://ars.els-cdn.com/content/image/1-s2.0-S1674984716300283-gr1.jpg
http://www.leif.org/research/Solar-Polar-Fields-1966-now.png
1 and 2 are possible, even plausible.
The rest are not.
Coincidentally, the Earth has been speeding up since the suns magnetic field has been on the decline.
Following, also, coincidentally, the movement of the Dow-Jones Index:
http://www.leif.org/research/DJI-1962-2017.png
Carla
Here is nice picture to help you finalise your list
Note that none of external causes have any influence on the core-mantle interface,
except Carla’s number 2 [Lunar and solar tides] which is not even on your Figure.
Also, note that there is no reference to any solar influence.
yes, it is, the little b/w stick marked ‘tide gauge’.
Indeed, yes, I missed that irrelevant fact that has no long-term variation on time scales we care about.
note that there is no reference to any solar influence.
For better understanding of tidal forces I am tempted to recommend this short article by Charles Chandler despite a somewhat dubious inverted sunspot cycles graph (‘ala’ vukcevic) by P.D. Jose.
Chandler’s ‘knowledge’ about the Sun is completely lacking: “Sun is comprised of charged double-layers” is complete nonsense. As well as his notion that it is an electric field that causes the tides. Complete nonsense. Chandler is an MD and knows very little about all this.
Einstein said it best:
“Most men revere words that they cannot understand and consider a writer whom they can understand to be superficial”
http://physicstoday.scitation.org/doi/pdf/10.1063/1.2811395
“Solar activity – ocean & atmospheric temperatures – oceanic and atmospheric circulation – angular momentum exchange – Earth’s rate of rotation (LOD) – secular change in perceived geomagnetic field.” Vukcevic at al , it’s all in there.
auto spell correction is a wonderful invention, but not this time: Vukcevic et al
Indeed, yes, I missed that irrelevant fact that has no long-term variation on time scales we care about.
note that there is no reference to any solar influence.
My reply went into wrong place, but seriously: who cares about ‘at al’ vs ‘et al’
Beyond Malankovitch: https://www.youtube.com/channel/UCKE0qdPuLg2l0IWnSfgsBSg