Over the weekend, we reviewed the state of the solar data for March 2017. Now, there’s a two week straight lack of sunspots, the longest stretch since 2010.

Overview
The sun is currently blank with no visible sunspots and this is the 14th straight day with a blank look which is the longest such stretch since April 2010 according to spaceweather.com. Historically weak solar cycle 24 continues to transition away from its solar maximum phase and towards the next solar minimum. In April 2010 – the last time there was a two week stretch with no visible sunspots – the sun was emerging from the last solar minimum which was historically long and deep. There have already been 26 spotless days in 2017 (34% of the entire year) and this follows 32 spotless days last year which occurred primarily during the latter part of the year. The blank look to the sun will increase in frequency over the next couple of years leading up to the next solar minimum – probably to be reached in late 2019 or 2020. By one measure, the current solar cycle is the third weakest since record keeping began in 1755 and it continues a weakening trend since solar cycle 21 peaked in 1980. One of the impacts of low solar activity is the increase of cosmic rays that can penetrate into the Earth’s upper atmosphere and this has some important consequences.

Comparison of all solar cycles since 1755 in terms of accumulated sunspot number anomalies from the mean value at this stage of the solar cycle. Plot courtesy publication cited below, authors Frank Bosse and Fritz Vahrenholt
Third weakest solar cycle since 1755
A recent publication has analyzed the current solar cycle and has found that when sunspot anomalies are compared to the mean for the number of months after cycle start, there have been only two weaker cycles since observations began in 1755. Solar cycle 24 began in 2008 after a historically long and deep solar minimum which puts us more than eight years into the current cycle. The plot (above) shows accumulated sunspot anomalies from the mean value after cycle start (97 months ago) and only solar cycles 5 and 6 had lower levels going all the way back to 1755. The mean value is noted at zero and solar cycle 24 is running 3817 spots less than the mean. The seven cycles preceded by solar cycle 24 had more sunspots than the mean.

Daily observations of the number of sunspots since 1 January 1900 according to Solar Influences Data Analysis Center (SIDC). The thin blue line indicates the daily sunspot number, while the dark blue line indicates the running annual average. Last day shown: 28 February 2017. (Graph courtesy climate4you.com)
Read more at Paul Dorian’s Vencore Weather
After mowing down all comers with his customary dispatch and drinking their blood from their skulls, Lief complains of “uncivility”? “Self-awareness” ain’t yo’ long suit, Mr. Isvalgaard. But you fun to watch!
Hey, he does answer questions, and lots of people are rude on both sides.
But the real test will be what happens over time.
This has been the weakest cycle in a very long time.
Either it will get colder over the next twelve years or so, or it will not.
12 years…it should be pretty clear by then, lag or no lag.
I sure hope everyone is still here so we can each eat some public crow or take smirking bows.
I am considering a bet on popcorn futures.
There might not be much popcorn around if it gets cold, better buy some soon.
Panik! The man-made global warming has reached the sun!!!
@ur momisugly L. svalgaard
net flux drop (gray area) …
Opinion !?!?
http://wso.stanford.edu/gifs/all.gif
Zonal magnetic flux transport over 3.5 solar cycles
A weaker solar cycle has less magnetic flux. Since cycle 24 is weak, there is less net flux.
It seems to me that after reading the comments. no one really agrees on what effect, if any, low solar activity may have. Even the classic correlation between sunspots and crop yields does no long seems as robust as once thought.
That correlation has been found to be spurious:
https://geomag.usgs.gov/downloads/publications/grl50846.pdf
Indeed Isvalgaard.
Incidentally, apologies for my terrible grammar, predictive text can be a real nuisance !
The correlation isn’t as strong now as when noted by Sir William Herschel because crops are currently less dependent upon weather, although of course it still matters.
We have now higher-yielding seed varieties, and, thanks to fossil fuels, more irrigation (requiring energy to pump), pesticides, herbicides, chemical fertilizers and agricultural vehicles. A large portion of crop yields today are thanks to petroleum and natural gas.
When my great-grandfather started farming wheat in the Pacific NW in the late 19th century, his yields were about one tenth of what we now achieve on the same ground in the early 20th century. They’re around four times what we got when I was a boy in the 1950s. And it takes far fewer people to work the fields and harvest the crop. And no animals, instead of 20-mule teams.
Figure 2 in the main article highlights the weakening trend in solar cycles since 1980. Observations of the surface and atmosphere show continued warming since 1980, even in the ‘coolest’ of the satellite data sets:
http://www.woodfortrees.org/graph/rss/from:1980/plot/rss/from:1980/trend
What more evidence is required to show that solar activity has not been the major forcing on temperature change over the past 37 years?
Today there is a sunspot:
http://cesar.kso.ac.at/main/cesar_start.php?date=2017-03-21
One (very) tiny spot should not make us wonder in the month no. 100 of the cycle. In the article they didn’t use the last data, voila:
http://kaltesonne.de/wp-content/uploads/2017/03/rio2.png
All of this yada yada yada is mostly BS. One need only look to the Maunder Minimum to see the result of lower Sun activity. Everything else is just so much ‘I’m smarter than you’ BS.
Leif, please forgive my ignorance. If there is no correlation between weak solar cycles and colder temperatures, how do you explain the well documented cooling during the Maunder and Dalton Minimum periods? Is it possible that there is a lag in the system so that it takes two or more successive weak solar cycles together to see colder temperatures? In both the Maunder Minimum and the Dalton Minimum periods there were three or more successive weak solar cycles together and they are both associated with periods of cooling.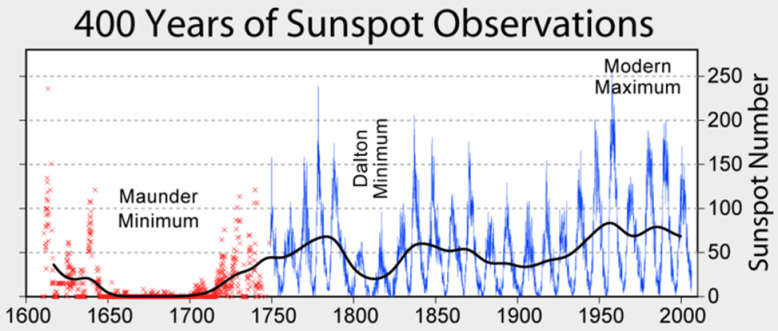
The colder temperatures during the LIA lasted much longer than 2 or 3 cycles:
http://www.leif.org/research/Moberg-Loehle-Temp-Reconstruction.png
Yes, but the Maunder Minimum lasted somewhere between 10 and 13 solar cycles from 1645 -1715 (with some giving an earlier start) and the cooling from the little Ice Age lasted from 1650 to 1850, which matches fairly well if you consider accumulated lags.
Yes, but the Maunder Minimum lasted somewhere between 10 and 13 solar cycles from 1645 -1715
If each cycle last 12 years, the interval 1645-1715 has only room for 6 cycles…
Correction, the Maunder Minimum lasted about 6 solar cycles.
It doesn’t matter how much the LIA lasted. What matters is that prolonged low solar activity during the Wolff, Spörer, and Maunder grand solar minima corresponds to periods of colder temperatures and altered precipitation patterns.
http://i.imgur.com/aXMnuOu.png
Gripegut is correct that it is possible that climate sensitivity to solar activity changes is such that its effect is only significant after a period of decades of below average solar activity. You cannot dismiss the hypothesis on the account of temperature trend not following solar activity trend for the past 4 cycles. For that you must assume that the effect is linear, without lag, and mediated by TSI. And you must assume that solar activity is the main factor affecting temperatures, with all others playing a lesser role. Those two assumptions are likely to be incorrect.
And the problem multiplies because the Wolff/Spörer/Maunder cluster is just one of several clusters of grand solar minima that are more or less evenly spaced through the Holocene, and each and every one of them took place during a period that displayed worsening climatic changes similar to those of the Little Ice Age.
https://judithcurry.com/2016/09/20/impact-of-the-2400-yr-solar-cycle-on-climate-and-human-societies/
Leif cannot explain it, so Gripegut won’t get the explanation he is asking for, and Leif will deny the evidence painstakingly collected by scores of paleo researchers during decades. According to him they are mistaken, the record is contaminated, they are fools deceiving themselves, or worse, cyclomaniacs.
Leif reminds me of Georges Cuvier, a great scientist that produced great contributions to Geology and Natural History in the early 19th century. He was very influential but he is remembered mainly for his stern opposition to any idea of evolution and his unrelenting attacks on anybody that dared to express scientific opinions he opposed. At that time evolution was as obvious to any illustrated person as the effect of solar variability on climate is today, yet nobody had any idea on how it could happen or but what mechanisms, and the hypotheses that were being put forward by evolutionists like Lamarck or Geoffroy Saint-Hilaire were wrong and easily shot down by Cuvier.
In the end if you reject the evidence you always end up being wrong. That is the problem also with the consensus AGW hypothesis. They are rejecting all the paleo evidence that shows that CO2 cannot be as determinant climate factor as needed by their hypothesis.
Also the Dalton Minimum. The LIA can be explained simply on the basis of the frequency and duration of solar minima during it, although other factors are also probably in play.
IMO, the Wolf Minimum belongs to the Medieval Warm Period, as a fairly brief countertrend cycle, since it was followed by renewed warmth before GASTA fell off a cliff in the 15th century.

Chimp, as you may know I’ve said co2 in the ice cores has followed temperature by 800 years. Going back to 1850, and going back on you chart to 1050, to paraphrase a Nobel prize winner, “what pops out at you” ?
The Dalton isn’t labeled in the image, but is the dip in the early 19th century. The last blast of the LIA.
rishrac March 21, 2017 at 12:28 pm
Going back ~800 years from now to c. AD 1217 is also instructive. Medieval WP CO2 isn’t all that different from now. There is IMO clearly a man-made component during the Modern WP, but CO2 in the pre-industrial Middle Ages was higher than the 280 ppm of the LIA, usually considered the “pre-industrial” norm.
The Modern WP still hasn’t equaled Medieval WP peak warmth, which lasted about 150 years and was hotter than now.
gripegut on March 21, 2017 at 5:57 am & ff
gripegut: what do you think about the following two facts:
– Leif Svalgaard’s temperature reconstruction shows a strong decline starting at least 300 years before the Maunder Minimum;
– during that 300 year period there was a tremendous sequence of volcano eruptions with explosivity index of 6 (Rinjani had even 7).
Rinjani 1257, 7
Quilotoa 1280, 6
Kuwae 1452, 6
Bárðarbunga 1477, 6
Billy Mitchell 1580, 6
Huaynaputina 1600, 6
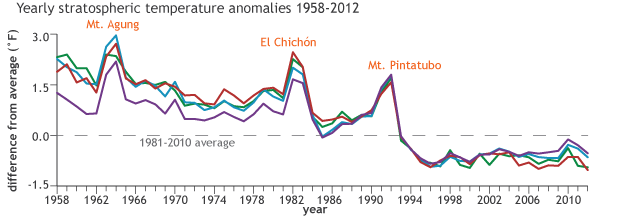
Think of the well accepted effects shown by Mt St Helens (1980, VEI 5) and El Chichon (1982, 5) as well as by Pinatubo (1991, 6).
Some scientists mean that the optical depth of stratospheric aerosols induced by all these huge eruptions became so high at that time that the oceans experienced a strong cooling it took centuries for the planet to get rid of.
If the LIA had been created by the Maunder Minimum and other solar cycles, that would be clearly visible on the temperature reconstructions: the cooling period then would have been initiated after Maunder, and not centuries before it appeared.
I really don’t know how long these types of volcanic eruptions affect temperature, nor do I know what level of solar activity was occurring in the 300 years before the Maunder Minimum, but my guess is that the volcanic eruptions caused much of the cooling before the Maunder Minimum.
gripegut on March 22, 2017 at 9:02 pm
If you are interested:
– The potential impact of super-volcanic eruptions on the Earth’s atmosphere
http://onlinelibrary.wiley.com/doi/10.1002/wea.263/pdf
– Reconstruction of solar activity for the last millennium using 10Be data
http://tinyurl.com/kyuq76l
Bindidon, that is fascinating and very useful. Thank you, this really helps me to understand the historical SN vs temperature. There seems to be a strong correlation between low SN and low temperatures and high SN and higher temperatures when multiple (low/high) similar strength solar cycles are combined.
Bindidon,
The climatic effect of volcanoes is quite well known. It is short-lived, and its effect on the paleo temperature record is clear (blue bars). It is always followed by a recovery (red bars).
http://i.imgur.com/dLwwN4e.png
Volcanic activity cannot explain the Little Ice Age, but it can explain why some decades within the LIA were extremely cold.
The “LIA due to volcanoes” hypothesis denotes lack of scientific rigor. We know perfectly well that volcanic activity was much higher during the Holocene Climatic Optimum, the warmest period in the Holocene. The relationship is the opposite to the one needed. You can only defend it by ignoring available evidence.
http://i.imgur.com/6Mjup0V.png
Dalton minimum is not really a grand solar minimum. Similar periods in the 14C record abound and are not usually considered GSM. Temporal analysis shows it is part of the centennial cycle: 1810, 1912, 2019. As we get farther from the Maunder Minimum, the centennial minima become less pronounced.
http://i.imgur.com/j2hbCiv.png
Dalton Minimum was extraordinarily cold due to extraordinary volcanic activity at the time, not due to extraordinarily low solar activity.
Well, there surely was some serious eruptive activity then, and not just Tambora in 1815.
Laki predates the usual start date for the Dalton, but must have contributed:
http://volcano.oregonstate.edu/laki-iceland-1783
Thanks Javier for that explanation , clear to understand.
Javier, again thank you for your help. I have a lot to learn and this helps tremendously. It seems clear that there is a relationship between temperature and solar activity when several low/high cycles combine suggesting a lag and a compounding effect.
Climate change is governed not by human activity, nor even raw solar output (exclusively). Truth be told there are a million factors, from the orbital positions of the gas giants (AND their satelites) relative to our orbital position, the orbital positions of venus, mars, and mercury, the raw photonic solar output, and the never discussed electromagnetic connection between the earth and sun (especially) as well as the electromagnetic connection with every other body in the solar syatem, and even the electromagnetic connection with neighboring star systems and probably even the center of the galaxy.
We have neither the scientific and technological capacity to measure, nor the computational power needed to extrapolate any meaningful predictions from the immense amount of data, most of which we aren’t even able to measure yet (most of which aren’t even accepted parameters of influence, such as the electromagnetic output of jupiter, even though we know jovian electromagnetic sphere of influemce reaches us).
Simply put…we’ve got a long way to go.
hehe, My theory is that at solar minimum, when the Sun’s polar field is near zero, it is the magnetic field of all of those, that imprints on the Sun, And Leif as stated before that it is at that point the next solar cycle is “defined” (my word not Leif’s).
I posted a solar system modeler up thread I think, go look at the 1907 solar cycle, and the sun spot counts, and then look at the orbit of mercury. Which by the way is a great big magnetic iron core (not magnetized), and we know there is magnetic fields connecting between the Sun and the Earth.
Hey that might be something to go look at, go find the dates NASA says the fields were connected, and see if the temps changed. Oh, FYI after summer solstice, it generally takes only a week or two before the daily change in temp starts to respond, the noticeable effect are longer than that, but had started a few weeks earlier.
Magnetic fields that span the whole galaxy are a fascinating subject.
Years ago, in testimony to Congress on ICBM technology diversion, my brother was explaining some aspects of missile science and one of the congressmen interrupted and wanted to know why about some technical detail. My brother told him it was the laws of physics, the congressman simply replied that’s OK, we’ll change that law!
LOL. Thanks but par for the course.
I find it interesting to say “Svensmark’s hypothesis has failed” as there hasn’t really been enough time to tell if it will have an impact on climate. Svensmark basically says when we get an increase in cosmic rays, we get an increase in cloud cover and that’s basically all he says. To what extent that has on climate is the unknown part. There does seem to be about a 10 year lag between a weak cycle and climate influence so we probably would not expect to see any climate response until sometime between now and 2020. Also the impact of additional clouds will vary according to where they are. More clouds in the tropics will result in cooler temperatures there, more clouds in polar winter will result in warmer temperatures there. Overall we are probably talking about a small change in cloud cover that takes time to be felt.
Svensmark basically says when we get an increase in cosmic rays, we get an increase in cloud cover and that’s basically all he says
However, that is not borne out by the observations:
http://www.leif.org/research/clouds.png
I wasn’t meaning to imply that I thought GCR rates are the *primary* driver of cloud cover, only that they have an impact. Yes, some other things such as evaporation rates will have a greater impact. So yes, if evaporation rates decline while GCR rates increase, overall clouds would decline. They might not decline as much as without the increased GCRs though. The question is if the delta from changes in GCR rates is enough to make a difference and it would seem it takes 10 years or more for that difference to be noticed.
I wasn’t meaning to imply that I thought GCR rates are the *primary* driver of cloud cover, only that they have an impact
‘Impact’ is a strong word Dictionary says it means to “have a strong effect on someone or something”.
A better word would be ‘influence’. There are lots of things that have an influence on the climate, such as radiation from Sirius, or reflected light from the Moon, etc, but all of those are small and in the noise. We only need to consider the ‘primary’ drivers [as you put it]. And there is no evidence that compels us [or me at least] to believe that GCR is such a driver. One can fight about the details forever, but act only on the clear and strong effects on which there is no doubt. And GCRs ain’t it.
and it would seem it takes 10 years or more for that difference to be noticed
It is now 20+ years since the data that formed the basis for Svensmark’s hypothesis were taken, and there is still no evidence of any effect. By the very nature of the hypothesis there should be no lag.
Isvalgaard @ur momisugly 9:20 am : “A better word would be ‘influence’. There are lots of things that have an influence on the climate, such as radiation from Sirius, or reflected light from the Moon, etc,”
But you keep insisting that solar radiation doesn’t or did I misunderstand your reply?
Steven Mosher wrote: “In 1896 and again in 1938 the hypothesis was laid out that if C02 increased the temperature would in general go up. It has.
This evidence CONFIRMS the hypothesis. Now, you could argue that it MIGHT be something else, like unicorns causing the rise in temperature, but the evidence supports the hypothesis it does not contradict the hypothesis.”
On the other hand, the hypothesis is NOT CONFIRMED when warming such as that of 1910-1940 occurs without sufficient CO2 to be the cause, nor when the highest levels of CO2 of recent years fails to continue to produce a high rate of warming. There is simply not reliable evidence of any effect of CO2 on temperatures.
nor when the highest levels of CO2 of recent years fails to continue to produce a high rate of warming
Similarly: nor when falling solar activity the last half century fails to produce the cooling so fervently awaited.
There are other possible explanations for cooling, which might have just coincided with low sunspot activity. Warming periods, I’m still thinking about that if it’s not solar activity. Since I thought that the solar activity was the primary driver of climate changes, it’s hard to let it go entirely. So I’m watching what this cycle does of course. However, as you indicated it may not be as deep of a minimum as thought. There is other information, whether it is correct or not, seems to support that. Results may not be as conclusive one way or the other as I’d like. I’m not in any hurry to see a cool down of any kind.
I had a reason about asking about the TSI.
falling solar activity, yet higher than average solar activity over the last half century (save SC24)…
But not higher than at similar half-centuries in the past when temperatures were much lower.
Moreover the trend is important: sun down, temps up.
“Moreover the trend is important: sun down, temps up.”
One talking point deserves another: Ever turn the flame down on a kettle of water? (did it continue to warm?)…
Turn the flame [the sun] down. Watch the kettle [the Earth] continue to warm. Such is the real world. Conclusion: perhaps the kettle is warming for other reasons than the flame…
Perhaps not. With higher than average solar activity even after the flame is turned down, we might expect to see some warming. (and with SC24, we got our pause) Conclusion: perhaps the kettle is warming for no other reason than the flame…
We have had higher than average solar activity in parts of every century the past 400 years. So would expect similar behavior in every century. If you watch your kettle after turning the heat down, I don’t think it will continue to warm. Perhaps you just picked a bad analogy.
http://m.imgur.com/yvrMXFy?r
(graph courtesy of Javier)
“Perhaps you just picked a bad analogy.”
Perhaps not…
Contrary to popular belief there is a possibility that volcanic stratospheric SO2 injections have a long term net warming effect. Physics demand that an energy imbalance be compensated for when making general accusations about temperature trends and during the 80’s and 90’s significant amounts of ozone were depleted which has allowed more UV to enter the troposphere. A direct correlation of surface temperatures with solar activity cannot be made with out compensating for the current troposphere / stratosphere boundary energy imbalance that has been caused by the last two major SO2 events.
“On the other hand, the hypothesis is NOT CONFIRMED when warming such as that of 1910-1940 occurs without sufficient CO2 to be the cause,
wrong. About 1/3 of the warming in that period is due to C02 and other GGH
about 1/3 is natural and about 1/3 is internal variability.
nor when the highest levels of CO2 of recent years fails to continue to produce a high rate of warming.
Wrong again. You have to look at the sum of all forcing son
[Mr. Mosher might benefit from learning some tact in dealing with people. Just reading the condescending way he writes this makes me bristle, and it likely has the same effect on others. If you want to change minds and opinions, your method of communications certainly doesn’t help -Anthony]
Steven,
Wrong again.
http://co2coalition.org/2016/08/04/non-existent-relationship-co2-temperature-correlation-only-15-of-last-165-years/
1. 1850 – 1910: -0.1°C Cooling with +15 ppm CO2
2. 1910 – 1940: +0.45°C Warming with +11 ppm CO2 (with flat human emissions)
3. 1940 – 1977: -0.1°C Cooling with +23 ppm CO2
4. 1977 – 2001: +0.35°C Warming with +37 ppm CO2 (1st & only positive correlation since 1850)
5. 2001 – 2014: -0.04°C Cooling with +27 ppm CO2
Anthony, i don’t think mosher would be mosher if he didn’t make people bristle… (☺)
Thanks for that breakdown, Chimp. It puts things in perspective, and shows there is nothing unusual going on with the Earth’s temperature.
The temperature goes up for a while, then it goes down for a while, then it goes up again, at the same rate of warming as in the past, and those ups and downs don’t correlate with CO2 concentrations.
The temperature profile is *not* going up at a 45 degree angle as CAGW promoters would have us believe. Instead, the temperature profile is moving in a “seesaw” fashion within a normal range, at least from the 1930’s. And 2016 was not as hot as the 1930’s, so we are not in record territory by any means.
You’re welcome.
The inconvenient truth for the real climate change d@niers is that earth’s response to rising human GHG emissions for 32 years was to cool dramatically. Then for about 20 years, rising emissions and temperature accidentally coincided, the correlation not showing causation. For another about 20 years and counting, emissions rising even faster have coincided with slight cooling to flatness.
Conversely, without rapidly rising emissions, earth warmed up about as much during the ’20s and ’30s as it did during the ’80s and ’90s.
Thus was CACA born falsified.
Chimp March 21, 2017 at 1:22 pm
2. 1910 – 1940: +0.45°C Warming with +11 ppm CO2 (with flat human emissions)
3. 1940 – 1977: -0.1°C Cooling with +23 ppm CO2
From 1945 – 1963 atmospheric nuclear testing took place, over 500 explosions yielding over 500Mt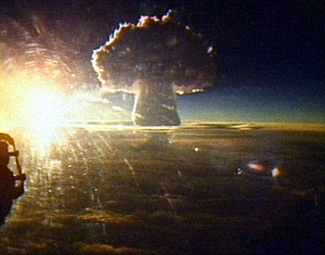
The plume was 56 km high at the time of the photo.
Need only one big volcanic eruption and the sun at minimum to re-experience the Dark Ages.
Huh… that kind of tracks with the non-gridded non-normalized non-extrapolated temperature record. We should probably be adjusting the sunspot numbers to fit the model du jour.
does anyone know if there are records of uv output and if so over how many solar cycles ?
There is a record [of EUV] going back centuries here:
2160 Reconstruction-of-Solar-EUV-Flux-1740-2015.pdf (Accepted Solar Phys. Topical Issue, 2016)
on my website: http://www.leif.org/research/
EUV is were the variability is.
thank you very much for taking the time to provide that link dr.svalgaard . do i take it although the euv component varies significantly it bottoms out at the same level every cycle and the maximum range in the last 40 years does not indicate any significant change from the rest of the reconstructed record ?
Yes, you are quite right about that.
As usual, the commentary here is divided into two camps. The first being people who are interested in true science, looking for the answers to solve the mysteries of nature. They are not totally fixated on the outcome but open-minded enough to ask questions. The second, being the usual crowd that has bought hook, line and sinker, the contrived AGW scam. But that second group will think they are the first, seeking “truth,” believing themselves to be defenders of the planet. The second group will never learn until they realized they’re the victims of a massive con-job.
Climate “Science” on Trial; Did Cosmic Rays End the CA Drought?
https://co2islife.wordpress.com/2017/03/22/climate-science-on-trial-did-cosmic-rays-end-the-ca-drought/
Changes in offshore ocean temps look like the culprit to me, along with the lower ssn count. I made a successful prediction in 2014 for the return to normal rainfall over the last 3 winters with a specific prediction for this current winter to be a very heavy rain season. A large part of the prediction was based on the recurring flood pattern in the PNW in relation to solar low points. That was my edge in making the predictions both for rain pattern changes on the PNW as well as for concluding that solar conditions were going to fall earlier than anticipated by everyone else. Observations can be useful at times.
It was interesting to also watch the ssta changes in recent years as it allowed me to learn more about how the changing ssta conditions worked to enable the rains to return. Several months ago I informed my relatives in Washington that they should expect the rains to continue on into April of this year, and perhaps into May as well. So far that has proven correct. Part of my reasoning for concluding that had to do with my summer vacation in 1965, the year after the Great Flood of 1964/65. I spent 3 months in Seattle with my cousins that summer. There was around 10 days of sun for that entire summer, and half of the time was a light to moderate rain. I think that is what can be expected up there this year with parts of Oregon also having s similar cool/wet spring/summer. The rains here in Northern California are still coming in as well. Two nights ago there was a massive 4+ hour downpour, and off and on rains since then. No question that this winter has been exceptional for rain here and further north.
Thanks for the comment. It appears the evidence that CO2 isn’t needed just keeps growing.
And for sudden changes in mountain areas it is now snowing here this morning after rain all night long. This is at 2000′ elevation. Good thing that I did not take my greenhouses down. I noticed that the NH cooled down over the last several days after what looked like the beginning of an early warm trend. This strikes me as exactly the type of weather changes that might be expected as a climate falls into a cooling trend. Farmers may have a hard time in the years ahead anticipating their plantings as a result. That is where things could get interesting for the world at large, if abnormal weather patterns take hold that disrupt plantings and/or harvests.
One last point to add to my first comment. What allowed me to get this far in gaining understanding of weather/climate besides years of reading was finding my Rosetta Stone which consisted of two parts. The first part was Dr Svalgaards great high resolution ssn graph which he posted around 4 years ago, and the second part was the JG/U 2K high resolution tree ring study from the sub arctic region. Then I also have to thank the superior a-holes at The Conversation for sparking a fire in me back at the beginning of 2014 which led to a period of inspiration 3 years ago this month. I haven’t been back to that site since.
I always find it amusing when the so called experts here attempt to dismiss the solar/climate connection by directly comparing solar metrics with temperature. There is most certainly a correlation but it has a two to three year lag and one most compare the change in temperature with the change in solar activity. Not just overlay sunspots with temperature.
http://www.woodfortrees.org/plot/hadsst3gl/from:1980/normalise/derivative/mean:130/plot/sidc-ssn/from:1978/normalise/derivative/mean:130
+LT – Not only that, but 200 years of high solar activity is not going to be erased in 1 or 2 low solar cycles. All that energy is stored somewhere: the oceans.
Joe:
Yes, it is stored in interstellar space,
Question to dr. L. Svalgaard,
1. Looking at the graph in http://jsoc.stanford.edu/data/hmi/polarfield/ , in December 2016, you stated that the South pole reached stability in 2016.0 and that the North pole would reach stability in 2017 at a level a bit higher than where it is now. May I conclude that meanwhile that stabiity is yet reached, due to the flat end of the graph of the North pole we now see?
2. In the same webpage, it is written “As of Nov 2015, the south has exceeded the 2010 level, suggesting that Cycle 25 would be no weaker than 24.” The current data show that the value of the South polar fields is much larger than the North polar fields. Let me use the WSO data. The maximum value in 2004 was 73 (in Jan 2004, smoothed value). Now (Dec 2015), we have a maximum of – 82. The maximum of the current solar cycle is 116.4 (SILSO data, new version). May I deduce that the solar maximum of the next solar cycle could be 116.4 x 82/73 = approximately 130?
Now (Dec 2015),
‘Now’ is not Dec 2015, but March 2017.
It is a bit too early to make a prediction. We need the polar fields to stabilize first. Extrapolating [which is always dangerous] I would guess that SC25 will be a bit [i.e. not much] stronger than SC24.
To complicate matters, WSO has been broken since Dec 2016. See http://www.leif.org/research/WSO-Problem.pdf
We will try to fix the instrument tomorrow [if we can – the electronics is old]. Basically, the measured field has been cut in half of what I think it should be. Keep an eye on my website, where I’ll report on progress [if any].
You may also check http://jsoc.stanford.edu/data/hmi/polarfield/ where you can see that the North has not flattened out yet.
For the relationship between the cosmic ray flux and solar temperatures see Fig 2 at Stozhkov 2017
http://notrickszone.com/2017/03/23/russian-scientists-dismiss-co2-forcing-predict-decades-of-cooling-connect-cosmic-ray-flux-to-climate/#sthash.OI8LqaAV.k21OB7Vx.dpbs. Cf future temp forecasts there in Fig1 with forecast in Page – 2017 Fig 12 in same link.
Note that these real scientists, unlike “climate (ie phony) scientists” actually make falsifiable predictions.
lsvalgaard March 22, 2017 at 12:27 pm
Joe:
Yes, it is stored in interstellar space,
Could I finish that statement, ?
and is the energy by which the heliosphere inflates.
How could I resist thaaat?
lsvalgaard March 22, 2017 at 3:55 pm
—————————————————
Thanks Dr. S. for that WSO update.
And the below seemed to be obscure with respect to those older observations.
Historical Sunspot Observations: A Review
http://www.leif.org/EOS/0702-0702068.pdf
To William Astley, hope to check on some of those links you left above, thanks.
Jobs chaos. Left, for better one, didn’t work out, hired back to the old one.
“What a long strange trip its been.”
and is the energy by which the heliosphere inflates.
Not at all. The size of the heliosphere is not determined but the total energy output of the Sun.
lsvalgaard March 24, 2017 at 10:23 am
——————————————————
Slow down Dr. Svalgaard.
Would you be so kind as to explain what energy you were referring to? ( wrt to the inflation of the heliosphere)
And if the solar wind is currently from more southern coronal holes and the magnetic field strength is weaker in the North wrt to the South. Wouldn’t the whole heliosphere have an asymmetric anomaly? um like flat topped or something?
The discussion was about the energy heating the Earth [i.e. TSI].
The heliosphere inflation is due to the energy in density and speed of the solar wind [millions of time smaller than what hears the Earth. Different physics.
What determines the shape of the heliosphere is the accumulated effects of several years of solar wind, as it just piles up at the outer boundary [doesn’t go poof and disappears].
lsvalgaard March 24, 2017 at 11:35 am
The discussion was about the energy heating the Earth [i.e. TSI].
The heliosphere inflation is due to the energy in density and speed of the solar wind [millions of time smaller than what hears the Earth. Different physics.
What determines the shape of the heliosphere is the accumulated effects of several years of solar wind, as it just piles up at the outer boundary [doesn’t go poof and disappears].
So..as sunspots and coronal holes begin to disappear, it wont be immediately seen in heliospheric inflation.
There will be a lag time. Lag time. Lag time.
Isn’t the heliosphere already flat topped due to the asymmetry in magnetic field strengths N, S? And this would affect GCR propagation inside of the heliosphere. So that as Earth bobs up down N, S of the solar magnetic equator, during the Earth orbital year, we would see more GCR enhancements while above the solar magnetic equator?
we would see more GCR enhancements while above the solar magnetic equator
No, because we see the integral effect of a year of two.
Any particular reason that you push your wrong suggestions?
Usually, people don’t want to learn, but rather to push their own ideas.
Below should be added to last comment.
GCR continue to rise despite high speed solar wind coming from coronal holes.
It is not that simple. The geometry of the solar wind and of the heliospheric current sheet are more important. All of this is well-understood, and there is nothing unusual going on.
Solar Slump: The Sun has been blank for two weeks straight
Anthony Watts / 4 days ago March 20, 2017
Thanks for the update Anthony.
One of the effects of a declining phase of solar cycle, as most of us know, is an increase in Galactic cosmic rays.
Some of us here, use spaceweather.com to get our daily dose of the solar stats.
They have been featuring a balloon study of GCR called, Earth to Sky Calculus.
… Spaceweather.com and the students of Earth to Sky Calculus fly space weather balloons to the stratosphere over California. These balloons are equipped with radiation sensors that detect cosmic rays, a surprisingly “down to Earth” form of space weather. Cosmic rays can seed clouds, trigger lightning, and penetrate commercial airplanes. Furthermore, there are studies ( #1, #2, #3, #4) linking cosmic rays with cardiac arrhythmias and sudden cardiac death in the general population. Our latest measurements show that cosmic rays are intensifying, with an increase of more than 12% since 2015:
http://www.spaceweather.com/cosmicrays/stratosphere_11sep16.png
Why are cosmic rays intensifying? The main reason is the sun. Solar storm clouds such as coronal mass ejections (CMEs) sweep aside cosmic rays when they pass by Earth. During Solar Maximum, CMEs are abundant and cosmic rays are held at bay. Now, however, the solar cycle is swinging toward Solar Minimum, allowing cosmic rays to return. Another reason could be the weakening of Earth’s magnetic field, which helps protect us from deep-space radiation…..
lsvalgaard March 24, 2017 at 11:35 am
What determines the shape of the heliosphere is the accumulated effects of several years of solar wind, as it just piles up at the outer boundary [doesn’t go poof and disappears].
Does it, the pile up at the heliospheric nose, begin to erode, become weaker and allow for more interstellar junk to slide on in?
The hemispheric pressure asymmetry is real, at the nose of the heliosphere. Solar orbit wrt Interstellar wind pressure ‘direction’.
As is the hemispheric asymmetry in the solar activity a real phenomenom.
The answers are still, “blowin in the wind.”
WRT to Earth’s warming anomaly of recent years, more work on tectonics, volcanoes, core ‘pressure’ release mechanisms need to be understood. We have come along way in locating under sea ridges, hydro thermal vents and volcanoes.
Thanks for the venting…
Does it, the pile up at the heliospheric nose, begin to erode, become weaker and allow for more interstellar junk to slide on in?
No, the solar wind is supersonic and nothing ‘slides in’. Cosmic rays are of much higher energy and can spiral in along magnetic field lines, but play no role in the energetics of the heliosphere, just like a cork thrown into a river does not impede the flow of the water.