February 2017 Global Temperature Report – Contiguous U.S. has warmest February in past 39 Years
Notes on data released March 2, 2017:
The 2015-16 El Niño Pacific Ocean warming event has faded into history, but the globe still saw its fourth warmest February in the satellite global temperature record, including the warmest February in that time for the contiguous 48 U.S. states, according to Dr. John Christy, director of the Earth System Science Center at The University of Alabama in Huntsville. The average temperature over the U.S. was 2.1 Celsius (about 3.78 degrees Fahrenheit) warmer than seasonal norms in February 2017.
February anomalies
U.S. 48 contiguous states
1. 2017 +2.10 C
2. 1991 +1.69 C
3. 2003 +1.58 C
4. 2001 +1.32 C
5. 1998 +1.12 C
6. 1997 +0.80 C
7. 1985 +0.62 C
8. 2007 +0.61 C
9. 1994 +0.52 C
10. 2008 +0.46 C
Compared to seasonal norms, the warmest spot on the globe in February was over Warrensburg, Missouri, with an average temperature that was 4.06 C (about 7.31 degrees Fahrenheit) warmer than seasonal norms.
Compared to seasonal norms, the coolest average temperature on Earth in February was near the town of Penny in central British Columbia, Canada. February temperatures there averaged 2.51 C (about 4.52 degrees F) cooler than seasonal norms.


Global climate trend since Nov. 16, 1978: +0.12 C per decade
February temperatures (preliminary)
Global composite temp.: +0.35 C (about 0.63 degrees Fahrenheit) above 30-year average for February.
Northern Hemisphere: +0.54 C (about 0.97 degrees Fahrenheit) above 30-year average for February.
Southern Hemisphere: +0.15 C (about 0.27 degrees Fahrenheit) above 30-year average for February.
Tropics: +0.05 C (about 0.09 degrees Fahrenheit) above 30-year average for February.
January temperatures (revised):
Global Composite: +0.30 C above 30-year average
Northern Hemisphere: +0.27 C above 30-year average
Southern Hemisphere: +0.33 C above 30-year average
Tropics: +0.07 C above 30-year average
(All temperature anomalies are based on a 30-year average (1981-2010) for the month reported.)
The complete version 6 lower troposphere dataset is available here:
http://www.nsstc.uah.edu/data/msu/v6.0/tlt/uahncdc_lt_6.0.txt
Archived color maps of local temperature anomalies are available on-line at:
As part of an ongoing joint project between UAH, NOAA and NASA, Christy and Dr. Roy Spencer, an ESSC principal scientist, use data gathered by advanced microwave sounding units on NOAA and NASA satellites to get accurate temperature readings for almost all regions of the Earth. This includes remote desert, ocean and rain forest areas where reliable climate data are not otherwise available.
The satellite-based instruments measure the temperature of the atmosphere from the surface up to an altitude of about eight kilometers above sea level. Once the monthly temperature data are collected and processed, they are placed in a “public” computer file for immediate access by atmospheric scientists in the U.S. and abroad.
Neither Christy nor Spencer receives any research support or funding from oil, coal or industrial companies or organizations, or from any private or special interest groups. All of their climate research funding comes from federal and state grants or contracts.
— 30 —
Down 0.48C from last February 2016. That’s called a “Super El Nino” impact.
Bill the heavyweight in ONE! T– K — O!
(call for the stretchers….. trolls and data twisters all over the place….. lolololol)
Except for the now cooled 2015-16 El Nino blip, there has been no warming this century except via Karlization.
“Except for the now cooled 2015-16 El Nino blip”
It hasn’t cooled much. January was in most global surface indices warmer than any month before October 2015 (except for some the isolated blip in Jan 2007). And according to NCEP/NCAR reanalysis, February was up another 0.09°C, which means only the months Dec15->Apr16 were warmer.
And adjustments (ERSST 4 included) make very little difference.
All very interesting, but it is what it is and we have no control over it besides the measurement techniques and accuracy thereof. Otherwise? It’s just weather and weather does whatever weather wants,.10 yr trends, 30yr trends, 100yr,,,1000yr…..10,000yr….million year. We and our actions are meaningless, if not amusing.
.09? Global temperature measured to within 100ths of a degree accurately? Bridge, NY. Sale… Swamp. Florida. Sale. Your number is but a meaningless bit of noise.
and it has not warmed much. Would you agree?
@Forrest Gardener March 2, 2017 at 5:38 pm
“So why … ?”
Accuracy.
@Forrest Gardener March 2, 2017 at 7:09 pm
Certainly you can, Forrest. There have been many examples, both land and sea, of adjustment made and subsequently discussed on this site. A betrayal of science would result If those adjustments were not made. That you cannot agree with the rationale of the most solid, clear-cut examples of this is disappointing.
Since March of 2015 the temperature record has been adjusted at least once, probably twice. The co2 record has definitely been altered. Do I know what they’ve done the temperature record all these years. No I don’t. I do know what they’ve done with co2 record. Whether error or oversight, co2 followed temperature for the last 60 years. Additionally, there are patterns in the co2 record that follow solar and cosmic ray activity.
NOAA has/had no reason at all for adjusting the co2 record.
Even with adjusting the temperature record, which NOAA has done, it is so far below any model that it renders AGW null and void whether it actually was the warmest year on record or not. Which, by the way, I do think that has been warming, but co2 wasn’t the cause.
Which is a very big concern in that we are wasting time talking about climate change as the current regime defines it. What is needed is an understanding of why it gets warmer or colder. Further, current climate research is useless. It is/was unable to predict the periodic rains that drench California and Australia . In fact the hand waving in both countries was permanent drought. The fear mongering about the Arctic warming due to warmer waters or another el nino, what’s missing? The thermal expansion of the oceans. Thermal expansion is significant. We aren’t talking about a few millimeters of SLR.
The current regime that is adjusting temperature or co2 data, doesn’t do anybody any good. There is no way of doing any kind of research that meets scientific standards. It is going to be a problem in the future when more rational minds look at this. Unless, we descend into another Age of Belief.
“rishrac” Age of Belief is right. I’m hoping with trump as President we might give up Faith-based Science and return to observation/measurement-based Science.
“It hasn’t cooled much.”
Thank you for that honesty, Mr. Stokes.
rishrac on March 3, 2017 at 2:04 am
Since March of 2015 the temperature record has been adjusted at least once, probably twice.
Do you know, rishrac, how many times UAH’s record has been adjusted?
Here are two graphs showing the differences between Rev 5.6 and the most recent Rev 6.0 ex beta5:
http://fs5.directupload.net/images/170306/2cnxcuqv.jpg
http://fs5.directupload.net/images/170306/jbnzooff.jpg
They don’t have to change much to disassociate the relationship between co2 and temperature. The don’t have to change much to get your work filed under garbage since it isn’t the latest numbers. The fact is, which really upsets me, the co2 record changed. People have been saying who watch the temperature that it has been adjusted. That wasn’t a surprise. When you are talking about 1/10th of a degree difference in planetary numbers the energy is significant. If you squish together a map, can I tell what’s changed ? I don’t if you are agreeing or not. The two graphs are not symmetrical. I can tell directly by the numbers what’s changed.
Changing the co2 record for 2005 by increasing ppm by 0.5 takes 6BMT that was missing and is now accountable. Increasing co2 ppm by 0.5 also puts it above the 1998 level. That takes away a key comment that co2 levels don’t just follow temperature but solar and cosmic ray cycles as well. It’s not an insignificant issue.
Nick: “It hasn’t cooled much”
Yes its on the way down, so it does not yet have cooled down, but it will in the near future. Take a bet?
Sorry rud. 1. Karl did no adjusting.he used an already vetted st product that reduces warming. 2. Using alternative sSt products we also find warming. 3. Even the curry approved re analysis shows warming. There was an LIA. It is warming. Even plants blooming earlier know this. Have more brains than a morning glory.
This month Trump approved ncdc data will show warming over all measured periods. Trumps nasa will also show the same. May’s cru will show warming. Japan will show it. Koch funded berkeley earth will show it. The new chinese dataset and method will show it.
It’s warming.
Time to move onto policy relevant questions. .. how much future warming and what can or should we do.
Lots of unsettled questions there. .
To which I say….So the ____ what? It’s no in ordinary in any way and I quite like the current trends. This number fiddling is akin to the playground antic, “mine is bigger than yours’. So it’s warming son in some areas an D cooling in others. Yay👏😒
Will they be able to show an as yet unseen ( by me at least) correlation to CO2 and the warming and will they be able to say with any certainty what portion of that is down to anthropogenic influences? I think at that point, once the unknowns are known, we could sit down and have that conversation about how we will adapt to the future ( because we certainly are not able to affect it in any way)
That’s the Earth for you. Sometimes it’s warming, sometimes it’s cooling.
Still got little to do with CO2. The benefits of more of this molecule are astonishing. So is warmer, wetter weather.
No matter whether it is 0.09deg or 0.9deg it is a major factor less than the average of all the models. No one seems to talk about the models any more, I wonder why.
So what? It is warming, perhaps. But what is causing it? Is it part of natural variation. Who knows, but we MUST believe the worst.
No plants blooming early in southern Scotland.
Global attribution based on parochial observation on your part it would seem.
+0.35C in 30 years?
No runaway warming there I think and no Dahlias overwintering in situ here either.
Yeah I know your eyes are hanging out on stalks in fear of warming. Your brain can only think of CO2. Preposterous stuff.
Poor Mosh…
Your used car has no wheels, no engine,
and can only be propelled Flintstone style through rust hole where the drivers seat should be.
Has anybody ever claimed the world has not warmed since the end of the LIA?
The issue is why. You can’t move from an agreed fact to policy without answering conclusively the why. This is the entire crux of the argument, and the endless bickering about tenths of degrees here and there is a sleigh of hand by the Alarmist crowd who try to claim that the only thing in dispute is whether the climate has warmed over the last [choose your time frame].
So you prove it’s warmed and then say “time for policy”.
No. Time to show why.
You’re right, Mosh. There was a LIA. Glad not everyone is still drinking Mann’s KoolAid. And before the LIA there was a MWP and after the LIA there was/is another MWP (as in “modern” this time).
And after that will come another LIA. There is nothing special about this particular WP. If and when it gets to be warmer than the Mediæval or Roman or Minoan warm periods or even the Holocene Optimum (I never worked out why it was called an “optimum” if warm weather is something to be frightened of) then we might start to worry though since none of these things caused the end of the world and certainly the last three coincided with major steps forward for mankind, perhaps not.
Enough already with the scaremongering, Mosh!
So Mosher was Jones lying when he told scientist John Christy in 05 “The scientific community would come down on me in no uncertain terms if I said the world cooled since 1998. Ok it has but it’s only seven years of data and it isn’t statistically significant.” ???
Then lying when he confessed in his Feb 2010 BBC don’t-go-to-jail interview when he told them as far as he could tell the warming stopped not in ’98, but ’95?? LYING THEN when he THOUGHT HE WAS GOING to JAIL for having CLAIMED IT WARMED, FRAUDULENTLY?
And the Met Office – they were lying too when they issued their presser in 2013 named “About The Recent Pause In Warming” – where they wrote ”three papers” showing they knew it hadn’t warmed any since temperatures went flat in ’98, the fifteen years previous – “The pause in global warming” is one of the phrases they used.
Karl’s work is fake, THE DATA INTEGRITY MAN at NOAA RETIRED so he could SNITCH KARL OUT. Or he retired for some reason but in any case NOAA’S DATA INTEGRITY MAN said KARL’s PAUSE BUSTER PAPER is complete pulp fiction.
ALL THESE RECORDS are TRASH put together by the VERY PEOPLE CAUGHT CREATING FAKE WARMING.
Time to move on and figure out how we’re going to remove the FAKE WARMTH from the RECORDS your FAKE WARMING guru friends FALSIFIED.
That’s what we need to ‘move on’ from. Insipid computer programmers who haven’t measured anything in their life trying to claim the entire scientific world can’t check their – your – bullshit.
We can. National agencies are FALSIFYING RECORDS.
@Newminster,
the current time is not the MWP (Modern Warm Period)
it is the MSWP (Modern SLIGHTLY Warm Period)
ps and the only thing Mosh is scaring, is his used car customers away.
Why did BEST hire you as their salesman Mosh? you are a WOEFUL salesman. !!
btw, Mosh, do you think BEST will be getting another half million dollars from “Anonymous” this year ?
Yes it is in fact warming modestly. Along with adjusting global climate models so they line up with this warming, we should also recognize that the weather/climate over the past 4 decades has been the best for life on this greening planet in the last 1,000 years.
Accelerating warming, that is not happening or global climate model warming, which also is not happening are possible, so we should keep an open mind and adjust our discussion based on what is really happening.
Great! I’m glad it’s warming. The planet has ALWAYS done better when it was warming, versus cooling. So why worry? Mankind and the rest of nature will, as always, adapt to the more conducive (to life), warmer climate. Will there be some disruptions for our civilization? Of course, change is always disruptive, but that does not automatically mean all change is bad. So put your big boy pants on and let’s rock the new climate!
A lot of unsettled questions that don’t need to be answered. A lot of money is being wasted on scientists that could have been spent on engineers. Just build the dams, the shelters, the seawalls, because weather happens long before climate happens.
Steven Mosher:
You wrote: “It’s warming”
Yes, it is. But it has nothing to do with CO2.
Google “Climate Change Deciphered” for the real reason.
And, by the way, the occurrences of El Ninos .follow the same exact pattern.
“and what can or should we do”
The answer is in the link.
Oh for God’s sake. There has never been any question that there has been some warming influence attributable to humans. But the answer is simple. It’s not a lot, and we have no control over it, and we have no way of knowing what the specific effects will be – but again, not a lot. Near as I can tell, LESS extremes, which is always the case in higher greenhouse ecosystems, except for an uptick in tropical activity – probably a general benefit. The only rational policy decisions is simply live, and adapt to the Earth no matter what happens, and not try to cripple ourselves in utterly meaningless, but very expensive regulation efforts.
I for one, am tired of a bunch of foreheads, who feel utterly free to spin wild ‘speculations’ on ‘what might happen’, that will never be tested in our lifetimes – people who are never touched by any of the ‘policy decisions’ that they push, all justifying their existence, by telling the rest of us how we’re allowed to live, based on End of the World-scare-stories, and then changing their story every five, ten or twenty years, when the disasters fail to materialize. All when there isn’t even convincing agreement over .48 degrees Celsius – or a 1-2 degree uptick – a 100% discrepancy, by the way, off a prediction a century into the future.
Mr. Mosher, until you start making an honest effort towards debunking the alarmism, and start being straight about the actual effects, the tiny numbers we’re dealing with, the uncertainty about long-term predictions, and ADMIT WHAT YOU DO NOT KNOW, I have to consider you part of the propaganda.
From Mosher’s own book, the CruTape Letters:
The Real Crime in Climategate:
While some are checking the statute books regarding the different treatments of hackers versus whistleblowers, and others are checking conspiracy laws regarding damaging careers through perversion of the peer review process and suborning editors to exclude unpopular opinions, we would like to say what we think the real crime in Climategate.
The criminals are not limited to The Team, the climate scientists and palaeoclimatologist whose emails and files were leaked to the public.
A section of politically active scientists, policy makers, politicians and NGOs in effect put on white coats and told us that our planet was gravely ill, and that we needed to follow their prescriptive advice to save ourselves fro a deadly disease. That’s really how they framed the discussion, and they classified everyone who disagreed as a denier, like a smoker dismissing his cough and waving away the x-rays.
That’s not a crime. But it’s pretty close to it to change the readouts on a patient’s condition to convince him to undergo expensive treatment, label other doctors as quacks is they disagree with the changed diagnosis, and to refuse to show the patient the data underlying the charts.
They may protest that the diagnosis is too technical for the patient to understand and that their actions are for the patient’s good. They may even believe it. But we call it quackery.
And the crime is malpractice. Deliberate and conscious malpractice. And since they arrogated the power unto themselves to diagnose the disease and prescribe a cure, they might also be charged with practicing medicine without a license.
…..
The idiots running the global warming campaign (and make no mistake, a bigger bunch of idiots would be hard to find) didn’t trust people to react to the truth. They thought you wouldn’t understand and if you understood, you wouldn’t care. So they lied to you, repeatedly and with a smile on their smarmy faces. Catastrophe! Dramatic sea level rises! Unbearable heatwaves every X months! Pick your own stupid pet trick.
It seems to me your big questions are already pretty much answered, Steven.
IPCC says warming up to 1.8C is beneficial for the planet. You accept that there was a LIA which must have been due to natural causes and therefore within the bounds of natural variability. Please accept the following statements:
With the LIA within the bounds of natural variability, there is no reason to view the current recovery of temperatures as outside of natural variability
With current temperatures within the bounds of natural variability, there is no reason to believe that CO2 levels meaningfully impact temperatures.
If in fact CO2 levels do raise temperatures, the IPCC “beneficial warming” assessment means it is not a concern for the immediate future.
If in fact, CO2 levels do raise temperatures, the IPCC and it’s “brain trust” of Climateers, need to start performing some substantially less crappy science to provide real information. They will first need to disavow all incompetents and fraudsters such as Mann and Hansen and many, many others.
Unfortunately, this will require the involvement of qualified physicists, statisticians, organic chemists, astronomers, geologists and other real scientists as opposed to the cadre of buddies and good fellas and fellow travelers who have been so gainfully employed the last few years that they don’t even have time to back up their computers or archive their crooked numbers. feel free to defend these indefensibles as I’m sure you wish to
Of course it is warming. It has been warming for 350 years. But:
– It has been warming a lot less than it was predicted 30 years ago by the people that developed the global warming crisis hypothesis.
– Despite increasing emissions, global warming has not accelerated, so whatever its cause, it is not getting worse.
– Most of the predicted negative effects remain hypothetical and the product of computer models.
We collect 30 more years of data to see how it goes. Perhaps then we can get a more constrained climate sensitivity value.
“he used an already vetted st product…”
I love the way you refer to your dodgy Mannipulated-for-political-purposes-and-personal-profit second-hand “temperature databases” as “product” as though they were something that actually possessed some measure of value in the real World, Mosher.
You would never make a decent second-hand car salesman, you’re far too blatant.
Thankfully, there is a new sherriff in town, and he’s going to be coming for you and your climate “scientist” ilk.
What fun that’ll be to watch!
Mosher, you must have convincing evidence that the driver that created the past 800,000 years of temperature swings has either suddenly stopped and we are in a new paradigm, or for some sentient reason that driver has bowed to the anthropogenic only portion of atmospheric CO2 as being the new king of the hill. Even though there is evidence in proxies that CO2 rose as a result of temperature increase, did it suddenly gain some sort of advantage it did not have before? And please do not talk of measured atmospheric CO2 as if the calibration is equal to the proxies used to create the graph. Apples and oranges if you know anything about the vagaries of ice cores.

istvan may be premature, but no more so than mosher. (we still have a ways to go until we see where trends end up)…
If one looks at most any multi-year Annual Average Temperature graph it will show an increase (blips) in the Average Temperatures for the specified time frame, …… but how does one know if said increase is due to an increase in the Average Winter Temperatures or an increase in the Average Summer Temperatures?
THEY DON’T KNOW ,,,,,,,, and that Annual Average Temperature graph won’t tell them.
If the Average Winter Temperatures were steadily getting less cold (warmer) over the past 60 years …. which we know is an observational fact …… and the Average Summer Temperatures remained about the same, ……. then wouldn’t that produce an increase in Average Temperatures over said 60 year time frame? ABSOLUTELY IT WOULD.
Does that prove the earth’s surface is getting hotter?
ABSOLUTELY NOT.
If the Average February 2017 temperatures are the warmest in 39 years …… and the Average Summer 2017 Temperatures remained about the same as they were in 2016, ……. then wouldn’t that produce an increase (spike) in Average Temperatures for year 2017?
ABSOLUTELY IT WOULD
If the Average Summer Temperatures had been increasing at the same rate as the Average Winter Temperatures, which they should have been if the earth was actually experiencing a period of Global Warming, …… then 100+ degree F days would now be commonplace throughout the United States during the Summer months. But they are not commonplace and still only rarely happen except in the desert Southwest where they have always been commonplace.
Now, instead of saying that “the Earth is warming” it is more technically correct to say “the earth has not been cooling off as much during its cold/cool periods or seasons”.
Given the above, anytime the earth’s average calculated temperature fails to decrease to the temperature recorded for the previous year(s), it will cause an INCREASE or spike in the Average Temperature Calculation results for that period ….. which is cause for many people to falsely believe “the earth is getting hotter”.
Relax and take a deep breath Samuel.
tony mcleod – March 3, 2017 at 9:06 pm
Shur nuff, tony mcleod, …….. it is obvious that lots n’ lots of people have taken your wonderful advice to “just relax and don’t be personally concerned” about the status of education in the US of A ……. because the literal proof of your advice giving ……. “is in the pudding”, ….. to wit:
Shur nuff, ……. it is utterly asinine and stupid for anyone to be concerned about science literacy, ………. right?
“January temperatures (revised):”
Revised?
How do you change the past?
any way.
2017 has about a 50/50 chance of beating the record set by 2016.
It really doesn’t matter who does the fiddling. If Best uses pre-fiddled data it is still fiddeled by association.
Obvious been drinking to much Climataide
50/50? Really? Wanna bet? You choose the conditions.
“How do you change the past?”
How do you get rid of the Medieval Warm Period?
However, it is also not the case with UAH that temperatures of 80 years ago are subsequently adjusted. Most readjustments happen 30 days later.
Not true most of their adjustments occurred years afterwards. For example a correction to correct an earlier error in their algorithm (1994) was made in 2005.
2017 has a 50/50 chance of being cooler than 2016.
So you’re happy for a new hot record every two years?
Warming is not a problem, cooling is Tony. Climate science is totally useless right now. The 3 big phrases ‘ might ‘ , ‘ could ‘ , ‘ maybe’ have been used extensively, then by the time it gets down to the argument level by warmist, those phrases are gone, replaced with ” scientist say ” . They don’t know or couldn’t predict the rains in Australia or California. And that was easy. I was telling concerned people in California a couple of years that it would start raining. They can’t explain the MWP or the LIA. and yes I agree there has been warming, the cause is unknown. It isn’t co2. In fact, co2 follows temperature. The chart showing the total co2 against yearly temperature anomolies is misleading. It should show yearly co2 anomolies against yearly temperature anomolies. It is clear and defined that co2 follows the temperature consistently for the last 60 years.
And besides with NOAA being able to adjust those numbers, and a host of other issues, there isn’t any way of knowing whether it was warmer or not. I don’t accept science on faith. I don’t trust them, again a host of issues.
“How do you change the past?”
Why don’t YOU tell US, Mosher?
After all, you and your cronies with your AlGoreithms and Mannipulations homogenisations and
computer gamesclimate models and just plain making stuff up have made a good living doing it for years, haven’t you?You even make up all sorts of tales to justify it, you may have fooled some people, but you have been rumbled, sunshine.
There is a clear upward trend in UAH anomalies, no point in trying to deny it.
So? Who cares? It’s a trend and trends occur ALL-THE-TIME, And there is nothing exceptional about this current trend except for the fact I am liking every minute of it.
Trends don’t occur during pauses.
Trends don’t have to be exceptional to be interesting and worthy of explanation.
Yes a Chicago winter was quite pleasant, no snow well about freezing most of the time
Mosh. Will a trend not appear during a pause if the outliers are not removed?
Don’t you understand the stark truth? If this continues, we will never experience the nirvana of Bill Nye’s little ice age.
Nice.
Considering that Chicago was under a mile high ice sheet 20000 years ago.
Mosher,
a pause is by definition a 0 slope trend, or more precisely a trend which doesn’t falsify, within some precision, the slope being zero. As you can see the uncertainty of the data is essential to define what a pause is.
“Define two things for the readers Simon.
1. clear; and
2. upward trend”
Forrest Gardener . You are either blind or not paying attention. Look at the first UAH graph starting December 1978. It is clearly showing warming, there is no denying it. And let’s not forget UAH is the data set that shows the least warming. Let’s also not forget both the Arctic and Antarctic are at all time lows for sea ice this time of year.
Simon: “There is a clear upward trend in UAH anomalies”
I suspect if the same satellites were in space in the 1930s it would look the same.
NOAA adjusted not only the temperature record, the co2 record as well. In the last 2 years. Why do you suppose they would adjust the co2 record?
There is also a clear and upward trend if you start at 1600, 1650, 1700, 1750, 1800, 1850, 1900, 1950 temperatures have been recovering from the LIA in a fairly steady upward trend for the last 400 years.
The headline and article do not deny it. I deny:
1) claimed catastrophic effects (not yet seen) are about to happen,
2) attributing all bad weather to GHG,
3) attributing most climate change to GHG,
4) ignoring all other factors which may be changing the climate.
mark4asp
“ignoring all other factors which may be changing the climate.”
_________
All know climate forcing factors have been carefully considered and quantified, with error margins, by the IPCC: http://www.ipcc.ch/report/graphics/images/Assessment%20Reports/AR5%20-%20WG1/SPM/FigSPM-05.jpg
so what?
You are considering the possiblility of unknown factors. That is good.
What is that? What are the dimensions of the “forcing”? [M][L][T]-2? [M][L]2[T]-2?
Does the entity “forcing” exist outside the “climate science” realm?
Not so carefully. The IPCC does not even know whether some “forcings” warm or cool. E. g. halocarbons, aerosols, NOx,
Not so quantified either. Some error margins are larger that the values themselves. E. g. Cloud adjustments, solar irradiance, albedo.
In others the percentage of variation is over 50 %. and they are reported as having a high level of confidence.
But the funniest part is that climate models do not use these “forcings”. They do not use the value of 1.68 (units?) for CO2, they use other “constant???” called climate sensitivity to doubling CO2. (ranging from 1.5 to 4.5 depending on models) The percentage of variation is 200%, so not so carefully quantified either.
“What are the dimensions of the “forcing”? [M][L][T]-2? [M][L]2[T]-2?”
Forcing factors in this context are environmental processes that influence Earth’s climate. In the case of radiative forcing for example, natural forcing can arise from changes in solar output, though this is estimated to have had a minuscule net effect in the period since 1750. Radiative forcing is measured in changes in Watts per metre squared, as the above chart indicates.
Whilst, due to uncertainties, some of the natural forcings have wide error margins, even at their widest these would not be sufficient to offset the total anthropogenic forcing. Indeed, the 4 cool forcings since 1750 also have a human contribution, suggesting that but for these anthropogenic warming would be even stronger than already observed.
There remains the possibility that there are other as yet undiscovered climate forcings. The world awaits their discovery.
Only if you use the El Ninos to create your trend. (El Ninos are not related to CO2)
There are actually two NEAR ZERO trends with one El Nino step and what’s looks like it will be just a transient.


Those two near zero trends show that there is NO CO2 signal at all in the satellite data..
The ENSO metre is presently in positive territory.
It may well be the case that we will see back to back El Ninos. Obviously far too early to know what will but if 2017 turns out to be another El Nino year, one can image the screams from climate alarmists. happen
Weather Bell is predicting a mild El Niño later this year.
It sure as hell hasn’t been a warm February in Wyoming!
Here in NC we had our annual winter storm in January this year, and we’ve been enjoying a very pleasant, early Spring. IMO, anyone who sees that as a problem has guzzled way, way too much kool-aid.
From eyeballing this chart it appears to me that another +2 °C (+3.6 °F) of warming would shift U.S. growing zones northward by less than 100 miles: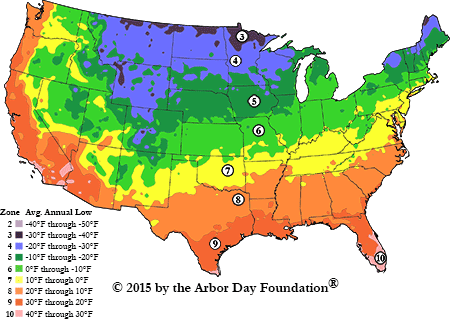
The IPCC defines that as catastrophe. I don’t.
“Polar amplification” is pretty nice, too, IMO. It means that in places with particularly harsh climates, the climates are expected to become a little bit milder. That’s pretty sweet!
It also means that the tropics haven’t warmed very much, and are not expected to. (Some nice negative feedbacks also help.) That’s also nice, because they’re warm enough, already.
Imagine if it were the other way around. Imagine if global warming mainly warmed the tropics, making them even hotter than they already are, and left the bitter cold parts of the globe as bitterly cold as before.
Whooeeee, the hand-wringers would never cease howling about what a disaster that is!
In fact, when poor, confused James Hansen thought that was what would happen, he was issuing dire public warnings about what a disaster it would be. Google search for “SOKBOFLhgqM” and then skip to 7:15 to hear him, on Letterman. He declared that the “increasing temperature gradient [between high and low latitudes] is going to drive stronger storms.”
Fortunately, Hansen was wrong (as usual), “Global” warming is actually mostly at higher latitudes. But I have yet to hear either him or any other climate hawk admit that “polar amplification” is actually pretty nice, nor have I ever heard either him or any other climate hawk speculate that decreasing temperature gradient might make storms weaker.
There’s something pathological about people who always look for a dark lining in ever silver cloud.
And the storms are nit occuring as often, or as intensely. Here in Oz, our children won’t know what cyclones are!
Not out here on the West Coast.
The PG&E bills have been painful.
The latest graphics are showing the west coast slightly cooler than average for February, many other parts of the US at record high levels. It’s an average of the whole lower 48 states, after all.
Because they are using technology (microwave sounding) that has never been available before, let alone 48 or 148 years ago, their numbers are meaningless and only useful for future measurements using the same equipment. Added to this they are measuring areas “…remote desert, ocean and rain forest areas where reliable climate date are otherwise not available”. So they have no idea whether it is warmer or colder and are basing there argument on politics rather than science.
That was actually a spoof post wasn’t it?
Who really thinks that interpolated numbers are better than actual measurements for “…remote desert, ocean and rain forest areas where reliable climate date are otherwise not available”. Oh, of course, Gavin and his mates.
Forrest Gardener
“…you are right to say that this is a very short record (less than 40 years) and that should be taken into account when the figures bounce around as they do.”
Yet not long ago quite a few folks around here were highlighting the significance of a ‘trend’ (or rather a lack thereof) spanning less than 18 years…
Same problem everywhere, some are temps measure via thermometers at times assumed to yield the daily minimum and maximum, some are min/max thermometers sited for meteorological data and others for aviation data, and increasing number are electronic allowing increased accuracy of the reading that are universally sited too close to heat sources because the cords are too short.
If, as you suggest, ~40 years is a very short record over which to assess the significance of a trend in a satellite lower troposphere temperature series, then would you agree that 18 years must be ‘way’ too short?
The winter started with snow, switched to southern flow which started a melt adding rain on top of frozen ground then switched to northern flow freezing a 3″ layer of ice. A few weeks later came the big storm with feet of snow and then 15~20mph winds creating 8′ drifts and all this on top of solid ice meaning snow plows not getting traction even with chains. Then came the southern flow again bringing rain for three days then came the northern flow turning everything into hard ice, graders ride on top of the 3′ pack!
Very unusual winter. Glad California has water, meanwhile I drove a snowmobile to the nearest road and caught a ride into town, bought a car to leave by the highway since I can’t get mine out until spring, when it comes.
The temperature will begin to climb faster as the NH ice melts out. The energy that was once just melting ice volume now has to go somewhere else.
http://psc.apl.uw.edu/wordpress/wp-content/uploads/schweiger/ice_volume/BPIOMASIceVolumeAprSepCurrent.png
Please don’t act surprised, we’ve known this was going to happen for decades. This summer you’ll be able to fly from Svalbard to the pole and back without seeing ice.
So what? It’s happened before and will happen again. And you and me are not controlling this by any means.
Your charts looks pretty flat from 2010 on. Not sure what this is supposed to tell me.
ROFL
The Argo data certainly show a declining Arctic ocean temperature trend from 2004:
http://www.climate4you.com/images/ArgoGlobalSummaryGraph.gif
Smoothing strongly seasonal data with a running 13-month average???
The guy who made that chart can’t be the sharpest knife in the drawer..
(hint, a year has 12 months)
O.R. spare your insults, a 13 month average is a common way to reduce artifacts in such time series. It’s not the best method, though. One better method is to use a triple running mean with periods of 12, 9 and 7. See https://judithcurry.com/2013/11/22/data-corruption-by-running-mean-smoothers/
Espen,
“a 13 month average is a common way to reduce artifacts in such time series”
Well, if you look carefully, the 13 month average introduce artifacts, “counter-seasons”, right between the right seasons. Use 12 months to smooth seasonal data, nothing else, period.
Btw, that chart can not be trusted. The depth averaged temperature 65N-65 S, 0-2000 m, is about 6 degrees C, not 10 C.
Here’s a correct output from Argo marine atlas:
http://postmyimage.com/img2/422_ARGO_0_2000_65N_65S.png
Shame about all that extra ice which formed on Greenland this winter…not to mention the increased amount of multiyear ice now accumulating. Tsk…there goes another beautiful theory murdered by a gang of ugly facts.
Wrong. More precipitation on the surface but less total ice.
The ice mass decline (eyeballing) according to the latest estimates seems to be levelling out: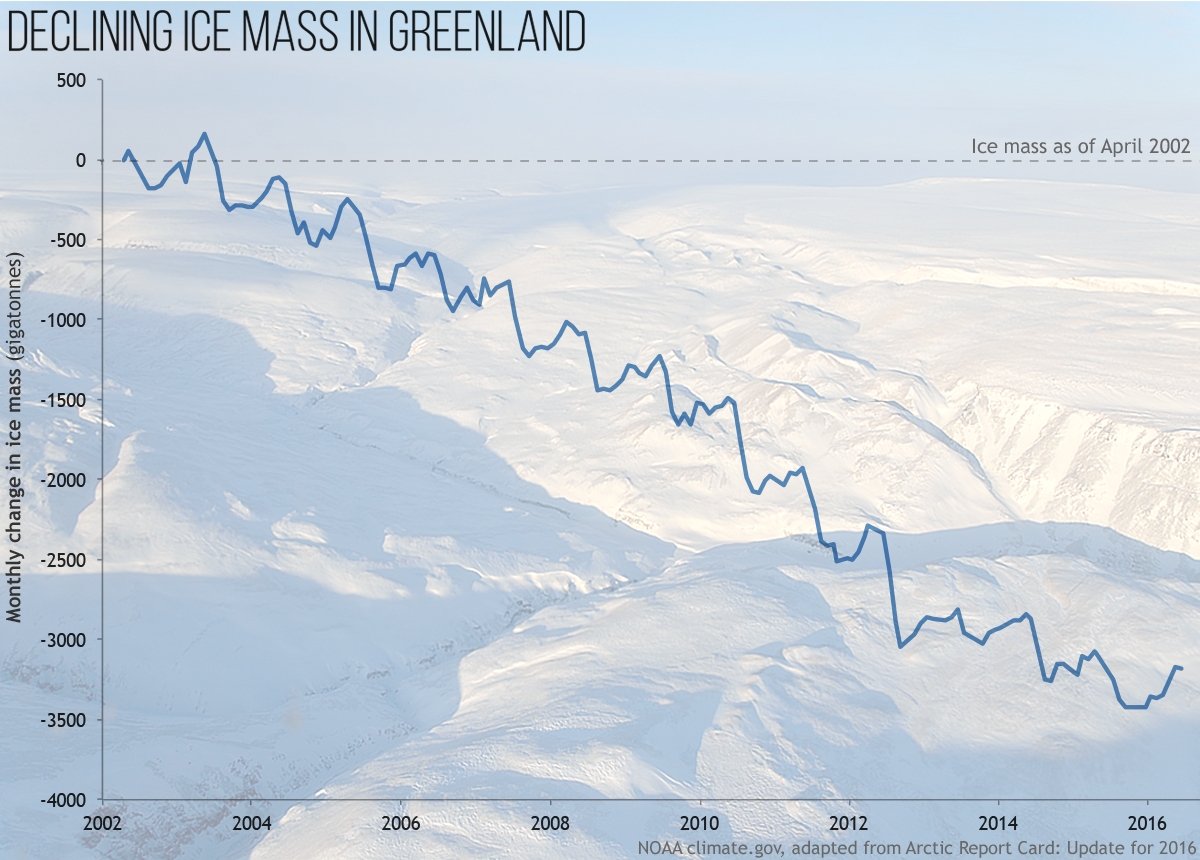
Interesting you managed to pick that out of that graph. Was there anything else that stood out?
Nope, except it would be reasonable to infer that the current Greenland ice mass is similar to that in the late 1930s to early 40s …
http://climate4you.com/images/70-90N%20MonthlyAnomaly%20Since1920.gif
… which incidentally was before human CO2 emissions could possibly been a significant contributing factor and whatever the current situation large scale adoption of wind and/or solar generated electricity would make no measurable difference at enormous loss of global wealth and lives.
Is the heading about the post of Anthony ironically meant? As a foreigner I do not know the internal depths of the US-American language so well. February 2017 was only the 4th warmest on the UAH series. If we had only a brief La-Nina rally, and were otherwise neutral-close conditions, not surprising. Tony Mc Leod and his Greenland-Mass-decline series are foolish. An analysis showed that the source of his graphics in the original only goes to 2010. Everything else he himself added, like Michael Mann. This year, the original graphics of the surface analyzes show a massive increase in the snow cover http://beta.dmi.dk/uploads/tx_dmidatastore/webservice/b/m/s/d/e/accumulatedsmb.png
Already in February! The mass growth is as high as on average in June.
This is very surprising and presumably due to the heat that was transported by the Super-El Nino under the tropopause and in the sea to the far north. The overall mass graphics for 2017 for Greenland will be interesting. Moreover, it is not surprising that the ice of the Arctic always strikes a balance to the earth’s temperatures. If these rise, or pump a Super-El Nino heat into the Arctic or Antarctic, the ice sheets fall and the volume goes back. An opposing influence of the AMOC of the Atlantic against the El Nino of the Pacific is existing not yet.
Although the fluctuation and the noise on short time scales are currently large, Piomas also shows a certain stabilization after the years of the strong decline in mass since 1998. The mass has stabilized slowly for 10 years.
http://psc.apl.uw.edu/wordpress/wp-content/uploads/schweiger/ice_volume/BPIOMASIceVolumeAnomalyCurrentV2.1.png
Hans-Georg
“the source of his graphics in the original only goes to 2010. Everything else he himself added…” What on earth are you talking about?
“The mass has stabilized slowly for 10 years.” I that really what you see? Wow!
Were they able to farm on Greenland at one time?
Hans-Georg March 3, 2017 at 3:59 am
Tony Mc Leod and his Greenland-Mass-decline series are foolish. An analysis showed that the source of his graphics in the original only goes to 2010.
Since you are concerned about the completeness of the data plotted perhaps you should have used the up-to-date version of the PIOMAS plot>
http://psc.apl.uw.edu/wordpress/wp-content/uploads/schweiger/ice_volume/BPIOMASIceVolumeAnomalyCurrentV2.1.png
“tony mcleod March 2, 2017 at 5:28 pm
Please don’t act surprised, we’ve known this was going to happen for decades. This summer you’ll be able to fly from Svalbard to the pole and back without seeing ice.”
Well, we won’t have long to wait…
No surprise…
 ?w=640
Not sure which data you’re referring to. “comparative data from 1980?”
“This summer you’ll be able to fly from Svalbard to the pole and back without seeing ice …”.
==========================================
I think you are confusing sea ice extent with the estimated PIOMAS modelled sea ice volume.
This was the ice extent in September last year, as you can see there was still plenty of visible sea ice between Svalbard and the Pole:
http://nsidc.org/arcticseaicenews/files/2016/09/Figure1.png
I’m making a prediction Chris. Most of the ice in that map was very thin, 1st year ice. This year winter has seen an even weaker refreeze. Unlikely to be totally ice-free for a few years yet given a small area of multi-year ice is still clinging on around northern Canada and Greenland but the rest is highly susceptable to melting out.
How about ice free from Svalbard to Barrow, Alasaka.
Tony. What you’re feeling now?
That’s cognitive dissonance.
Interesting isn’t it?
“tony mcleod March 2, 2017 at 10:14 pm
I’m making a prediction Chris.”
One reliable thing about predictions of a chaotic system, like this rock we live on, is that they are almost always wrong, maybe even 97% wrong. But, Tony, we won’t have long to wait, esp the one about no ice seen while flying from the pole to a city!
Tony
i’ll make a bet with you.
if the geographical North Pole is ice free this year I will never post here on WUWT again. If it isn’t you never post here again.
will you take the bet?
Your on Bob.
Tony
It’s a bet.
Koodos to you for being willing to stand behind your prediction.
Likewise.
“Bob boder March 3, 2017 at 3:45 am”
Bob, Tony is from Queensland, Australia, the state where residents believe day light savings turns cows milk sour. It’s my view that we won’t see the last of Tony after his prediction fails in an alarming way.
Patrick
I’ll take him at his word, trust me when September 8th or what ever rolls around if I win I will make sure to repost the bet, the link is copied and saved. Than its just a question of honor. I will pay off if I lose. I expect Tony to if he loses. We will see.
” Than its just a question of honor.”
Good luck with that!
Don’t forget, you’re dealing with a Warmist.
tony mcleod @ur momisugly March 2, 2017 at 10:14 pm
I“This year winter has seen an even weaker refreeze.”
Actually, multi-year ice is growing:
Tony, have you ever asked yourself what polar sea ice did during the Eemian peak?
If all this ice melted where did the catastrophic sea level rises and floods go? 4 New Papers: Anthropogenic Signal Not Detectable in Sea Level Rise.
Still waiting for the catastrophes promised me 30 years ago.
I’ve just had a Warmist above, Chris Hanley explaining to me how record ice gains in Greenland are part of a rapidly melting scenario. (also the graph he posted was from NOAA and we all know that President Trump has plans for them!)
Additionally, if the oceans are warming, where is the thermal expansion? Thermal expansion is significant. If the waters are that warm, parts of the world should already be underwater.
Really mark4asp? If you’re waiting for a sealevel rise from melting seaice…you’re gong to be waiting a long time.
that is a pretty chart tony. unfortunately meaningless as are all arctic ice volume charts. if it can’t be accurately measured the chart is only representing someones opinion.
I think you are misunderstanding the point I am raising. I am not talking about a specific locaction. I am merely pointing out that whatever warming has already occured in the Arctic, along with reduced albedo, some of the amplification can be attributed to the fact that melting ice uses up a lot of energy. When there is less ice to melt that energy can only go to warming the water (and air) more.
So…I’m expecting an accellerating temperature increase across the Arctic as warming trend bights deeper and the ice diminishes.
What are you expecting?
McClod has never heard of the AMO cycle, have you McClod. !
I can bet you would be wrong
“This summer you’ll be able to fly from Svalbard to the pole and back without seeing ice.”
HeHeHe!
You’re Peter Wadhams and I claim my five bob!
On yer bike, mate!
“This summer you’ll be able to fly from Svalbard to the pole and back without seeing ice.”
I’ve copied that, and I’m going to rub your nose in it this summer.
And it’s WONDERFUL!!! No snow in Southwestern Ontario this winter. Nothing to shovel! Heating bills lower! What’s not to like?
All very interesting, but it is what it is and we have no control over it besides the measurement techniques and accuracy thereof. Otherwise? It’s just weather and weather does whatever weather wants,.
“warmest in 39 years.”
These are cooler times, then.
Penny, I live near Penny in Prince George. Penny is not quite a town, fifty or more years ago, just now maybe 6 full time residents. It is fairly remote and still off grid I believe for all the off grid lovers out there. Look it up on google earth.
An average temperature of a space – a room, house, suburb, region, country and globe is a thermodynamic oxymoron. To claim you can do this to two decimal places is sheer meaningless nonsense, especially when you don’t quote measurement errors.
Dont tell Stokes and Mosher this.
“Dont tell Stokes and Mosher this.”
Oh, Stokes and Mosher are well aware of it.
But it doesn’t fit the Warmist narrative.
Quoting a global average air temperature is basically trying to gauge the amount of energy stored in the air mass. I.e., integrate cp*rho dT over the chosen volume and divide by V/(cp*rho). You could leave the cp*rho out, but I am trying to illustrate the energy calculation.
…divide by V*cp*rho, sorry
Nail on head. Enthalpy (an extensive quantity) is far more meaningful in this context than temperature (an intensive quantity).
Why are there never any error bars on these graphs?
Here in Australia, New South Wales has been hot, Victoria about long-term average, southern part of West Australia has been setting daily records of coldest day evahhh, by BOM land data.
One day soon, people will get bored with picking out hottest this and coldest that. You could hardly say it is exciting, especially as Nature will do what it will.
Next. ………
Geoff
Ha ha, snap! I said that above too.
It’s really unusually quiet here in north queensland, isn’t it?
A couple of days were hot, but nothing unusual with prevailing westerly winds from the red hot centre. And now Flannery’s prediction of no raid for the dams coming true…oh wait!
And a nice Feb it was.
Nothing. Probably would’ve been more interesting to cite that being over 0.3 is very very rare outside of El Nino months
So, let me unpack this slowly, just to make sure I understand this forty year old record.
1. Up until 1990, the weather tended to trend cool, where trend was a variance of “.04” degrees from the mean?
2. Since that time, the weather tended to trend warm, where trend was a variance of “.04” degrees from the mean?
Although, according to the data, events within the warm period of the data-set have also trended towards “cool”, then returned towards the mean?
However, at the end of the day, we are talking about a simple planetary temperature record, with data that spans over a period of forty years, using measurements that we have never had access to in prior human history, that so far, shows and average variance from the mean of “.04” degrees over a decade cycle?
Furthermore, in this dataset, we have a small handful of events that exceed this “.04” variance, then fall back towards the mean.
These events, if anybody cares to look, trend both ways.
During the cool early part of the forty year record, events exceeded the “cool” margin of variance on a few occasions and then trended back to the mean.
This trend repeats at the “warm” part of the later part of the scale.
Although, most noticeable is the “axis” point where global temperatures crossed over to the positive, or warmer part of the cycle.
The time span was essentially within a few years.
So, given these trends, and the length of the data set so far, what happens when the median variance flips back to favour the “cool” cycle?
All I see, is that we have managed to map the variance in planetary temperature over a forty year cycle.
As for being useful to promote the global green cause, unfortunately, it just flatly contradicts it.
Local temperature records show much greater variance and historical temperature records tend towards an overall cooling.
A simple check of the written records that date back to the very late 1890’s through to the 1970’s shows much higher average temperatures.
The hottest month traditionally seems to be January and February, the hottest years in the 1900’s were January 1920 and January 1960, as recorded in the southern hemisphere.
Oddly enough, are we looking at a forty year average here?
However, as that may be, this article in the 189’s is an eye opener;
http://trove.nla.gov.au/newspaper/article/209057216
John Harris
“1. Up until 1990, the weather tended to trend cool, where trend was a variance of “.04” degrees from the mean?”
Not according to UAH v6.5. The trend up until 1990 was warming at 0.06 C/dec: http://www.woodfortrees.org/graph/uah6/to:1990/plot/uah6/to:1990/trend
“2. Since that time, the weather tended to trend warm, where trend was a variance of “.04” degrees from the mean?”
The trend in UAH v6.5 from 1990 onwards shows warming at 0.12 C/dec; twice the rate seen up to 1990: http://www.woodfortrees.org/graph/uah6/from:1990/plot/uah6/from:1990/trend
If, as you suggest, the variance in both periods is 0.04C, then the warming rate in both periods is statistically significant (since the best estimate trend is larger than the uncertainty in both cases).
From what I can tell the hottest temperature recorded is about 70C, the coldest about -90C, a span of 160C out of which we trend anomalies of tenths of a degree C. +/- ??? Whom are we kidding?
Besides somebody has to connect these trivial anomalies and CO2/RGHE otherwise it’s all just meaningless noise, a great big yawning, “SO WHAT!!”
Just finished reading a collection of Feynman talks. Feynman frequently emphasized the large uncertainty inherent in science.
Always worth pointing out that ‘above average’ temperatures in the Arctic in wintertime signify COOLING events. With little or no sunlight available, the only way temperatures can rise is because of incoming, moisture laden air…so when you see that it’s minus 15˚C instead of the usual minus 20˚C…think snowfall and ice deposition. Greenland is breaking all records in ice mass gain this winter…don’t hear much about that from the Warmists!
Exactly, the Arctic is shedding a lot of warmth from air and open water. A warmer atmosphere means a cooling planet and vice versa.
“‘above average’ temperatures in the Arctic in wintertime signify COOLING events”
Hmmm… that doen’t sound right.
“the only way temperatures can rise is because of incoming, moisture laden air”
Not quite right. Less ice mean more open water mean more waves mean more mixing up of warm water from depth etc.
Greenland “ice mass gain”, is an undertandable error, overall ice mass isdeceasing rapidly. See above.
Tony. What you’re feeling now?
That’s cognitive dissonance.
Interesting isn’t it?
all water and air masses that travel to the arctic cool tony. when there is less ice the water cools more rapidly . any “warmer” water brought up from depth due to mixing resulting from wave activity will cool rapidly. less ice sea ice in the arctic during winter results in increased loss of “heat” from the planet.
Hilarious charles. You are sharing your view with a tiny minority, you do realize that don’t you? No I guess you don’t.
Tony,
If the people here on this blog represent such a tiny minority, then why do you spend so much time here posting comments? So are you just stupidly wasting your time (as you imply others are), or throwing around disingenuous propaganda?
“Hans-Georg
“the source of his graphics in the original only goes to 2010. Everything else he himself added…” What on earth are you talking about?”
This:
This is the pictures source. Nov. 2010.
“The mass has stabilized slowly for 10 years.” I that really what you see? Wow!
Yeah, wow. Trends are also seen in sea ice extent:
http://www.wzforum.de/forum2/file.php?6,file=42837
Yeah wow!
I had to deliver the silly source of the Greenland ice mass graph : . What amazing!
Source
That means it was warmer 38 years ago than now.
Sorry, I meant 39 years ago.
The winter months are when the AMO driven reduction in sea ice has the biggest effect on temperature. During a negative AMO you have more ice which prevents the heating of the atmosphere by the warmer oceans. With the Positive AMO the ice melts and the air is exposed to the warmer water.
I’d have more confidence in the UAH data if it matched surface measurements. Taking Australia as an example (as I live there), the UAH anomaly map bears little resemblance to the BoM surface temp anomalies for February. We saw record cool temperatures in the south of Western Australia, where UAH shows average temperatures.
http://www.bom.gov.au/jsp/awap/temp/index.jsp?colour=colour&time=latest&step=0&map=meananom&period=daily&area=nat
Well, start by adjusting for the difference in the base climatology. The BOM uses 1961-1990.
The base period used makes almost no difference to anomalies.
The issue here is that something that is wrong in the detail, cannot be correct in the whole (bar chance and a couple of other oddities). Despite climate modellers claims to contrary.
The ‘Bermuda Triangle’ of the GAT surface record is between ~1940 and the start of the satellite record in !980 where you had the collection and curating of the data in the hands of unsupervised dedicated CAGW activists madly ‘correcting’ the data recorded decades before — and they are still at it:
http://www.climate4you.com/images/HadCRUT3andHadCRUT4%20Global37MonthlyRunningMeanTempSince1850.gif
Diagram showing the global 37 month running average for HadCRUT3 (blue) and HadCRUT4 (red), and the difference between these averages (climate4you)
Obviously it does. You can’t compare anomalies made using different base periods unless you first normalise them all to the same base.
Phahh. Different base temperatures.
“I’d have more confidence in the UAH data if it matched surface measurements.”
It might just be telling you that it is measuring a different place.
Both purport to measure effectively the same thing; the temperature of the air not far above the surface, the climate that matters to humans.
If they diverge (don’t correlate well), there are 2 possible reasons. Either one of the measures is seriously flawed, or there is a genuine divergence between lower troposphere temperatures and surface temperatures. I tend to think this is the case and cloud trends are the obvious reason.
And as noted earlier, I am sceptical to say the least, when global averages are highly correlated, but with large divergences at local to regional level. Dr Spencer is an excellent scientist, but I suspect he is guilty of calibrating UAH against global averages.
And I have to tell you that the trend of the respective series should be your friend and not be measured where and why. And this trend differs only recently from the surface measurements. That’s funny, is not it?
A place that according to climate models and IPCC should show more warming than the surface.