
Guest essay by Eric Worrall
A new study published in SAGE claims that 0.7C / century warming is exceptional, because on average temperature change over the last 9500 years, after smoothing away short term wobbles, was 0.1C -0.01C / century.
The Anthropocene equation
Owen Gaffney, Will Steffen
The dominant external forces influencing the rate of change of the Earth System have been astronomical and geophysical during the planet’s 4.5-billion-year existence. In the last six decades, anthropogenic forcings have driven exceptionally rapid rates of change in the Earth System. This new regime can be represented by an ‘Anthropocene equation’, where other forcings tend to zero, and the rate of change under human influence can be estimated. Reducing the risk of leaving the glacial–interglacial limit cycle of the late Quaternary for an uncertain future will require, in the first instance, the rate of change of the Earth System to become approximately zero.
Read more: http://journals.sagepub.com/doi/full/10.1177/2053019616688022
The money quote;
… From 9500 to 5500 years BP global average temperature plateaued, followed by a very slight cooling trend (Marcott et al., 2013). Over the last 7000 years the rate of change of temperature was approximately −0.01°C/century. Over the last hundred years, the rate of change is about 0.7°C/century (Intergovernmental Panel on Climate Change (IPCC), 2013), 70 times the baseline – and in the opposite direction. Over the past 45 years (i.e. since 1970, when human influence on the climate has been most evident), the rate of the temperature rise is about 1.7°C/century (NOAA, 2016), 170 times the Holocene baseline rate. …
Read more: Same link as above
What is wrong with this picture?
Marcott himself explained in an interview with Real Climate that his data has been heavily smoothed – that any short term warming trends in the past, which were similar to late 20th century warming, could have been eliminated from the climate record by his methodology.
Q: What do paleotemperature reconstructions show about the temperature of the last 100 years?
A: Our global paleotemperature reconstruction includes a so-called “uptick” in temperatures during the 20th-century. However, in the paper we make the point that this particular feature is of shorter duration than the inherent smoothing in our statistical averaging procedure, and that it is based on only a few available paleo-reconstructions of the type we used. Thus, the 20th century portion of our paleotemperature stack is not statistically robust, cannot be considered representative of global temperature changes, and therefore is not the basis of any of our conclusions. Our primary conclusions are based on a comparison of the longer term paleotemperature changes from our reconstruction with the well-documented temperature changes that have occurred over the last century, as documented by the instrumental record. Although not part of our study, high-resolution paleoclimate data from the past ~130 years have been compiled from various geological archives, and confirm the general features of warming trend over this time interval (Anderson, D.M. et al., 2013, Geophysical Research Letters, v. 40, p. 189-193;
Read more: http://www.realclimate.org/index.php/archives/2013/03/response-by-marcott-et-al/
The instrumental record itself provides evidence of short term warming periods comparable to the modern warming – including warming periods which occurred well before anthropogenic CO2 could have had a significant effect.
The following is from an interview with one of the stars of the Climategate Emails, Dr. Phil Jones, former director of the Climatic Research Unit;
…
A – Do you agree that according to the global temperature record used by the IPCC, the rates of global warming from 1860-1880, 1910-1940 and 1975-1998 were identical?
An initial point to make is that in the responses to these questions I’ve assumed that when you talk about the global temperature record, you mean the record that combines the estimates from land regions with those from the marine regions of the world. CRU produces the land component, with the Met Office Hadley Centre producing the marine component.
Temperature data for the period 1860-1880 are more uncertain, because of sparser coverage, than for later periods in the 20th Century. The 1860-1880 period is also only 21 years in length. As for the two periods 1910-40 and 1975-1998 the warming rates are not statistically significantly different (see numbers below).
I have also included the trend over the period 1975 to 2009, which has a very similar trend to the period 1975-1998.
So, in answer to the question, the warming rates for all 4 periods are similar and not statistically significantly different from each other.
…
Read more: http://news.bbc.co.uk/2/hi/8511670.stm
There is no evidence of anything exceptional about the rate of post 1970 warming, compared to pre-1970 warming. The suggestion by the authors that warming is currently occurring at an unusual rate is nonsense.
Update (EW): Corrected the first paragraph, the authors claim an average trend of -0.01C / century over the last 7000 years, not 0.1C / century.
Update 2 (EW): ClimateReason provided a link to an excellent post he provided in 2013, which uses the Central England Temperature record to demonstrate how dramatic an impact smoothing of historic data has on the representation of the temperature data.
Discover more from Watts Up With That?
Subscribe to get the latest posts sent to your email.
since 1979, two essentially flat trends and an El Nino step.


Remains to see if what the finality of the 12015/16 El Nino will be.
…but RSS dropped down below the pre El Nino zero trend, then a slightly back up last month (not shown in this graph).
As always, you missed a couple of graphs…

As someone who may not be as intellectually gifted as you Griff , when I look at those graphs I just see summer and winter .
What am I missing ? Maybe if the Graphs went back in time a million years I so I might get it perhaps !
Here is another missed graph (Greenland icecap snow accumulation):
Is that unprecedented enough for you Griff?
As always, you fail to mention that in Greenland some 75 to 80% of average Glacier retreat that has taken place these past 150 years, took place by 1946. Only about 20% of all Glacier retreat has taken place after CO2 emissions began to rise and after when the IPCC says CO2 is significant. .
Only the other day I referred you to the recent (Fernandez Fernandez et al) 2017 paper that studied Greenland glacier retreat.
If you look at their tables, they record the average retreat of the glaciers to be some 1334 metres, of which retreat some 1062 metres of retreat had taken place by 1946.
Nothing exceptional is happening in the Arctic. The high temperatures recorded in Iceland and Greenland were in the 1940s. The amount of Arctic Sea Ice would appear broadly similar to that in 1973/74 if one looks at the data in FAR.
Overall, globally ice area is up.
This paper clearly states that rather than the rate of Glacier retreat having increased during the last half of the 20th Century, it has slowed down.
If CO2 was doing anything then one would expect to see an increase in the rate of Glacier retreat post 1940 (the time when according to the IPCC CO2 emissions began to become a significant factor).
The fact that the rate of Glacier retreat has slowed down during the second half of the 20th century demonstrates that CO2 is not having a significant impact.
Griff,
As always,you cry over a small area (SEA ICE) of the planets surface,while Andy’s (TEMPERATURE) charts covers most of the planets surface.
14 Wadhams is a lot of ice up there.
“As always…”
Gee, griff, andy sure is lucky to have you around to remind him to add sea ice graphs to his temperature graphs. (don’t know what he’d do without you)…
Funny how weather is not climate, unless it benefits us to claim that weather is climate.
So your record conveniently starts in a cold period and ends in a warmer period, and we’re supposed to be alarmed? Sorry, not impressed. First, it’s another case of “pick your period, pick your trend.” Second, it says ABSOLUTELY NOTHING about the CAUSE of the decreased sea ice extent. News flash – CO2 levels, and/or the minuscule human contribution thereto, have nothing to do with it. Unless, of course, you have some proof otherwise. We’re still waiting on that.
In other news, Antarctic ice is not exhibiting the same “trend,” so no “global” warming, which flies in the face of your Arctic sea ice Chicken Little posts and what they supposedly support.
I see the ice extent curve for 2017 has caught up with the pack as most of us here expected with arctic vortex patterns.
Thanks Griff, Your charts show exactly what you would expect during a Quaternary interglacial period. You would also expect a mean sea level highstand, 4-10m higher than today, which will cccur at peak interglacial sometime in the future.
Cheers
http://www.pc.gc.ca/eng/pn-np/ab/jasper/activ/explore-interets/glacier-athabasca.aspx
Griff – where are all of the DeLoreans that went back in time to cause the climate to warm?
That lower ice extent is due to wind direction, not due to temperature. The area if greatest ice deficit, east of Svalbard, is due to winds blowing out of the south there almost all winter pushing any ice toward the pole. The wind normally blows in the opposite direction for most of the winter, spreads the ice south and increases ice extent. With the winds blowing from the south, it compacts the ice reducing ice extent. People need to realize that arctic ice floats on water and is at the mercy of the wind direction.
Verney, refute this historical evidence of Mer de glace an alpine glacier with a pretty good record extending a bit further back in time, just right before your iceland glaciers plot starts….
the recorded retreat from 1850 till 1870 just DWARFS all your arguments. especially when you start your record from 1868…
and by this why is 90% of the retreat of the Mer de glace in france before what the IPCC labels as anthropogenic global warming?
and more important:
why do all european alpine glaciers and Scandinavian glaciers with pre 1850 data have between 70-90% of their total retreat in just 150 -200 years before the “catastrophic CAGW” retreat?
i wonder what you would say if we lived in that era between 1850 and 1870 where alpine glaciers retreated 50% of their length of the last 200 years….
good try but fail and busted….
I get to use the “unprecedented ” word first .
Only if you add, “Breaking News!” as the next two words.
Here are some precedents from Frank Lansner:
http://www.rockyhigh66.org/stuff/rate_interglacial_temps.png
That looks almost as random as the Warming computer models! Lol!
This is an actual paper? They are actually claiming that a 4,000 year trend rate can be compared with a 100 year trend rate?
Its difficult to believe even Alarmists are this stupid.
And how did it even get past PAL-review.
Some serious favours must be owed. !!
…or they have “inconvenient” pictures of the carefully selected reviewers with farm animals.
Ahh, yes, PAL, …. , where the men are men and the sheep are nervous ……
Not only that, but after such severe filtering that any 100-year artifacts have first been removed. They aren’t that stupid. This is just scientific fraud.
Why didn’t they treat the past 100 years as a “short term wobble” just as they did other similar periods?
This is my wobble. There have been many like her, but this one is mine.
For starters, only in cooked books has earth warned that much since WWI. In reality, it warmed as much in the 1920s and ’30s as in the ’80s and ’90s and then was flat to down until the super El Niño of 2016. During the ’40s to ’70s it cooled despite rising CO2.
Earth also warmed for a century from the Dalton until WWI. It warmed more rapidly, longer and more in the early 18th century, coming out of the depths of the LIA in the Maunder Minimum than during any of the three warming cycles of the Modern Warm Period.
The earth is still in the long term cooling trend in place since the Minoan WP more than 3000 years ago. The latest cycle in the Modern WP is just another normal wobble.
“Its difficult to believe even Alarmists are this stupid”
No, it’s not.
Thank you George. It really isn’t hard when you consider almost all the people saying it’s real, are either
government employees,
or
mass media hacks who couldn’t analyze their way out of a wet paper bag.
When your income depends on the scam never getting resolved,
it gets amazingly hard to even say for sure how to properly calculate the temperature of some air.
The entire scientific world waits for this generation of trough-fed scam fed hogs to seize up, keel over, and make room for some real scientists
to put scientific debate back on track
with reality based discussion,
about reality based physics and mathematics.
I don’t know if stupid is the right term. Ideologically misguided is more accurate. If it weren’t for the political left latching on to the broken science, it would have been fixed decades ago. It’s amazing how political bias (in either direction) can turn someone who is otherwise smart into a blithering idiot.
Stupid is not the operative term here. These are activists pretending to be scientists and wilfully corrupting the science they purport to believe in. The extent and depth of deceit that is so common in climate science and it’s accompanying Eco-Socialist politics completely puts the lie to any idea that this is just misguided hijinks. The cost to humanity of this structure of lies is too immense to cut them any slack. We need a federal investigation of the field’s products and charges and dismissals where warranted, which would cut the whole slimy operation to ribbons.
Not really – not when you realize most are simply uninformed (believing the BS the media feeds them), or WILLFULLY stupid (as in, they refuse to accept any observation that doesn’t support their belief system).
Looks like they are moving the goal posts and getting ready for sustained lack of warming by saying we already exceeded the goal. Since man didn’t cause the warming up to 1950 (per IPCC) and that warming was about 1/2 of total warming, it appears that NOAAs cooling of the past is going to haunt them.
This is like comparing the speed of sealevel rise as the tide comes in rwice a day with the average rise over the last year or more!
Good analogy. I was trying to think of something sea related to demonstrate the absurdity of what they did, but the tide thing didn’t click for some reason…
I majored in Statistics and felt I had a grasp on Correlation Theory and Statistically Significant measures of data. That is why I have adopted my “denial” (of what I am unsure) stance.
I can tell you something – shares in Casinos are looking incredibly safe whenever these guys walk in for a night out and there is no chance they will break the Bank. I can assure you of that.
How do these guys get away with this rubbish? Unfortunately this will be headlines in the mainstream Press.
“Lies lies and damned Statistics”
Especially with this absurd claim:
“…. because on average temperature change over the last 9500 years, after smoothing away short term wobbles, was 0.1C -0.01C / century.”
-0,0`C / century?
This precise?
Ha ha ha…..
-0.01C / century
If I have a thermometer that is accurate to 1C, then I can take a reading to day and another reading 100 years from now. A rise of 1C is within the range of my thermometer, and since the time period between the two readings was 100 years, that works out to a rate of change of 0.01C. Nothing illegitimate about it.
There is nothing that requires rate of change calculations to be limited to the limitations of the device doing the measuring.
I’ve long forgotten all my statistics from the 60s, but I gather Mr. William Briggs, esteemed statistician, declares that smoothing of time series is a vile and horrible thing. And who am I to naysay him?
“Do not smooth times series, you hockey puck!”
http://wmbriggs.com/post/195/
ps. I have no idea if the matter in discussion is a time series. But from a layman’s point of view, it would seem almost all such graphs as the one under discussion are time series. Happy to be disabused of this notion if that is not the case.
Some people love to justify panic.
Some people love to CAUSE panic.
Some people live to EXPLOIT panic.
Usually the same ones causing the panic.
Cause, effect, and motive, all explained at once.
Unfortunately an Aussie alarmist “scientist” is mixed up in this amazing math marvel .
http://www.abc.net.au/news/2017-02-13/humans-accelerating-global-warming-anthropocene-equation/8265326
That is just so embarrassing, that this guy calls himself an Australian. Fortunately I don’t have a PhD, or else I would have to be twice as embarrassed.
Will Stefan does talk with a fairly thick American accent , he is a regular on “their ABC” spouting the evils of Co2 , CAGW and loves renewables and batteries .
But always has a doom and gloom message .
(P)ermanent (h)ead (D)amage syndrome, yet again!
I guess we’ve got an out – he was born in the USA. We can always refer to him as that dopey Democrat Yank chemist, contaminating our wide brown (but greening thanks to anthropogenic CO2) land with his Obama-style climate propaganda.
yeah ABC gave it raveup today
usual bullsh*t we expect from rabidlygreen aunty
as soon as I heard steffen i KNEW it was going to be crap
wasnt disappointed.
he stated that even ALL the serious events like massive volcanics meateors etc had LESS effect that humans in the last 200 yrs
i howled with something between rage and laughter
these people need to be sacked refund their illearnt funding and never allowed near the gullible ever again!
And the formula is copyrighted?
The use of the word “Anthropocene” by (alleged) scientists should result in immediate termination with extreme prejudice. Justifiable homicide, the verdict.
Inappropriate … most skeptics want nothing to do with implied threats of homicide.
Now, now, give ’em credit where credit is due: anthropocene is pretty catchy. If it captured any semblance of the truth, then it could be historically useful. Unfortunately, what it tries to capture is [clear throat] questionable, at least.
I propose what I believe to be the definitive alternative label … climythocene … pronounced with the primary accent on the second syllable … cli-MYTH-o-cene.
There is a more accurate paper to be written by someone who has time to do the research, grant application, formalizing, writing, submission, going through the editorial jury, bickering over details, taking about a year or so to get the final draft approved and published. I just don’t have that kind of time, because I am too busy making light of the opposing camp.
Articles like this one are simply dismal. There is no other term to describe them. Journalists, being mathematically challenged, and scientifically pig ignorant, are fixated on a formula that is nowhere in sight in the article.
From the article:
Well, it is a mathematical formula, and mathematics is an exact science, therefore whatever the formula says must be right….
Robert from oz, I’m afraid Oz is punching away over its weight in this climateering, science busting era. There is a small but hopefully growing development back toward sanity in the science world, but Oz clime folks are not only bucking the trend, they are doubling down. The population of clime folks is disproportionately high for this modest population and clinging to relevance and employment may be the driving factors in the current crescendo of output. Probably more than 50% of climate scientists are from two countries – Oz and UK and there appear to be changes afoot in the UK.
No, not an Aussie,
A wandering warmista who has managed to get his snout into the [unfortunately gullible] academic trough
It’s just sad how hockeystickology is poisoning climate science, again and again.
Espen, you are right. This is Hockey Stick II, or Son of Hockey Stick, or Spawn of Hockey Stick, yea, that’s it: SPAWN OF HOCKEY STICK!
i know where they hockey stick would do the most good..
wrapped round their heads..hard!
OR…;-)
In Canada we have a hockey saying that I think is apporopriate- “Make their head bleed”!
I went to the fights the other night, and a hockey game broke out.
Is this professor and his team mates auditioning for a new Hollywood rendition of Dumb & Dumber?
The AGW crowd have managed to get published some pretty awful papers over the years but this must be the stupidest.
There’s the one where the warmer claimed that since tropospheric temperatures hadn’t been found to be rising properly, he got onto excel and obliviated the need for humanity to ever use thermal sensing again, since they’d be using excel and windspeed alone, to calculate temperatures.
Steven Schneider, now (gratefully) departed from this world of slimy, scurrilous, alarm paddling criminopaths, to await his evil pit-of-snakes friends so they can all help each other,
peer review each others’ ‘work’ and ‘opinions’ in hell.
Dumb, Dumber and Dumbest … in no particular order
Caption for the one on the left:
Insert finger here.
@MarkW: “Caption for the one on the left: Insert finger here.”
That’s Steffen. Perhaps we should add, ” … and remove head from …”
That’s not how you do the Dr. Evil finger, Steffen. Wrong finger, wrong orifice.
A new study published in SAGE claims that 0.7C / century warming is exceptional, because on average temperature change over the last 9500 years, after smoothing away short term wobbles, was 0.01C / century.
The 0.7C/century warming is also a short term wobble.
It must also be smoothed away.
Otherwise we would be comparing apples with oranges, and we wouldn’t want that, would we?
We might then just be repeating Mike’s Nature Trick.
You cant compare instrumental data with ultra-smoothed palaeo data, unless your intention is to mislead.
link Using their logic, the difference between the peak of the Medieval Warming Period (MWP) and the bottom of the Little Ice Age (LIA) would have been less than 0.1 degree. They know nothing about history. They are pulling precisely Mike’s Nature Trick.
Their logic is there was no global medieval warm period, nor little ice age.
Thus, global change of 0.7K / 100 yrs is large. However, local space-like and time-like variation swamps a change of 0.7K at a daily or municipality wide range. It is nothing much to worry about.
Hi eric
I wrote a detailed article some 4 years ago that dealt with the apparent inability of data to portray the very considerable temperature variations that can be observed throughout recorded history
https://wattsupwiththat.com/2013/08/16/historic-variations-in-temperature-number-four-the-hockey-stick/
These two observations seem the most relevant
“Paleoclimate reconstructions (figure 2) capture long term climate variability of 50 years and more quite well, but fail to pick up the much more variable fine grain of annual and decadal variability. Consequently a false picture of apparent climate stability in the past is portrayed.
* As paleoclimate reconstructions are usually only measured against global instrumental temperature records commencing 1880 they do not find any of the ‘hockey stick’ effects that can be seen in the older instrumental temperature records.”
In 2006 Phil Jones wrote an article on the astonishing temperature rise in the 1730’s that was sharply reversed in the winter of 1740 and observed that natural variability was much greater than he had hitherto realised.
The notion that climate was very stable until recent years is demonstrably false.
tonyb
Thanks Tony, added a link to the bottom of the post.
Temperatures actually HAVE been pretty stable over the last couple of centuries. That’s part of the reason the number of humans has multiplied so greatly over that period.
I am in my 60s and my average rate of growth through my lifetime is much less than that of my 19 year old nephew. Should I see a doctor about this problem?
Someone must have reminded Professor Steffen to publish, otherwise he might perish (and be forgotten). Unfortunately what he has produced is not a scientific paper. Please, someone tell me what this paper is good for apart from impressing MSM.
You can always hang it on a nail in the out-house
I was thinking “for lighting fires with”.
Some papers are good for lining the bottom of bird cages.
The anthropo-tards who wrote this drivel (Owen Gaffney and Will Steffen) have illustrated their knowledge of the hockeystickocene period (h/t to JoelObryan).
Pass me the bucket.
‘because on average temperature change over the last 9500 years, after smoothing away short term wobbles, was -0.01C / century.’
The idea that you offer temperature values to two decimal places any degree of accuracy AT ALL over this time period is hilarious, the reality is for most of it you have nothing but highly problematic proxies , such has magic tress , and that is all. I
f they where practicing good science good rather than poor politics , they would acknowledge the reality that uncertainties means the best they can do is guess with significant margins of error . Although that would not be good for headlines nor grant fishing , so you can see why they don’t .
The only methodology which has any scientific integrity is to compare one period within a time series to another period WITHIN THE SAME TIME SERIES (or in very exceptional instances, if the frequency response can be guaranteed to be the same, to a very similar time series).
When I did that, in both land surface and the much longer CET, I found nothing exceptional:
Proof: recent temperature trends are not abnormal
A thinly disguised attempt to revive the hockey stick.
“Over the last hundred years, the rate of change is about 0.7°C/century (Intergovernmental Panel on Climate Change (IPCC), 2013)”
Why don’t they just cite Wikipedia as the source.
Yes they could the quote the AGW new misremember past at Wikipedia ( https://en.wikipedia.org/wiki/Runaway_climate_change ) — more than one AGW advocate recently told me that no real climate scientist or UN-IPCC authority ever said that runaway global warming was the possible future.
I always agree with them Hansen was never a real scientist and Pachauri was only the gravy train’s engineer.
If we (oil & gas industry) flouted signal processing principles in the handling of geological and geophysical data like academic and government “scientists” routinely do with climate data, we’d be fired, probably sued and possibly prosecuted.
Regarding Marcott…
Guest Post by David Middleton
The Gorebots are all atwitter about this new paper…
Marcott et al., 2012 is behind a paywall; however the supplementary materials include a link to their proxy data.
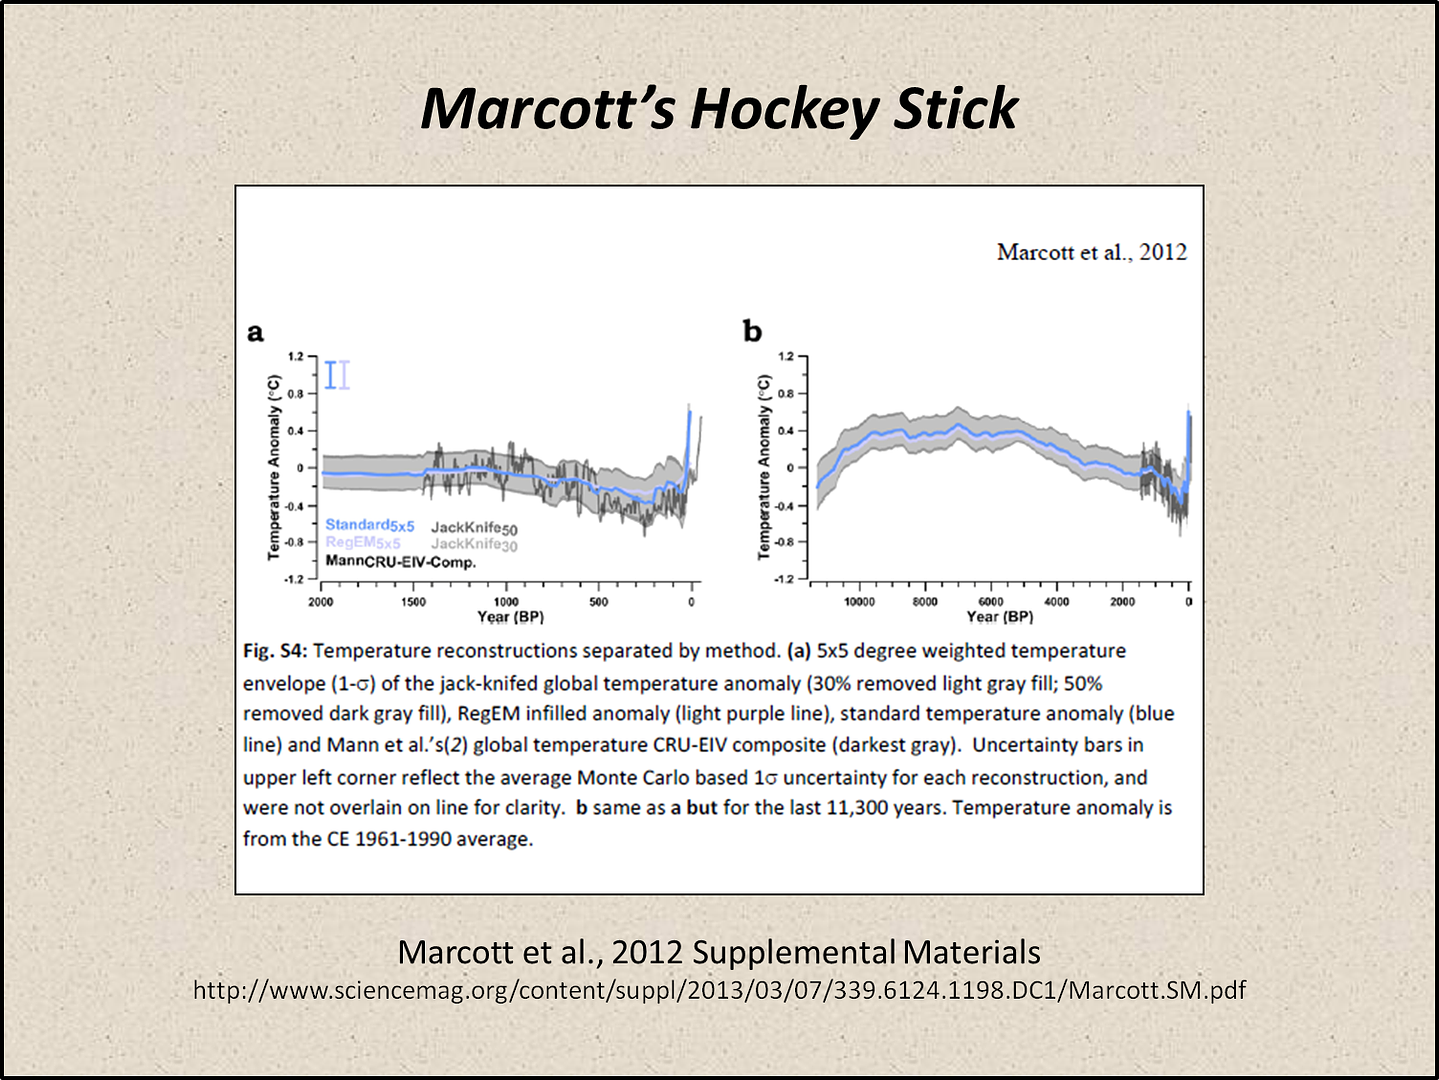

This paper appears to be a text book example of creating a Hockey Stick by using a low resolution time series for the handle and a high resolution time series for the blade…
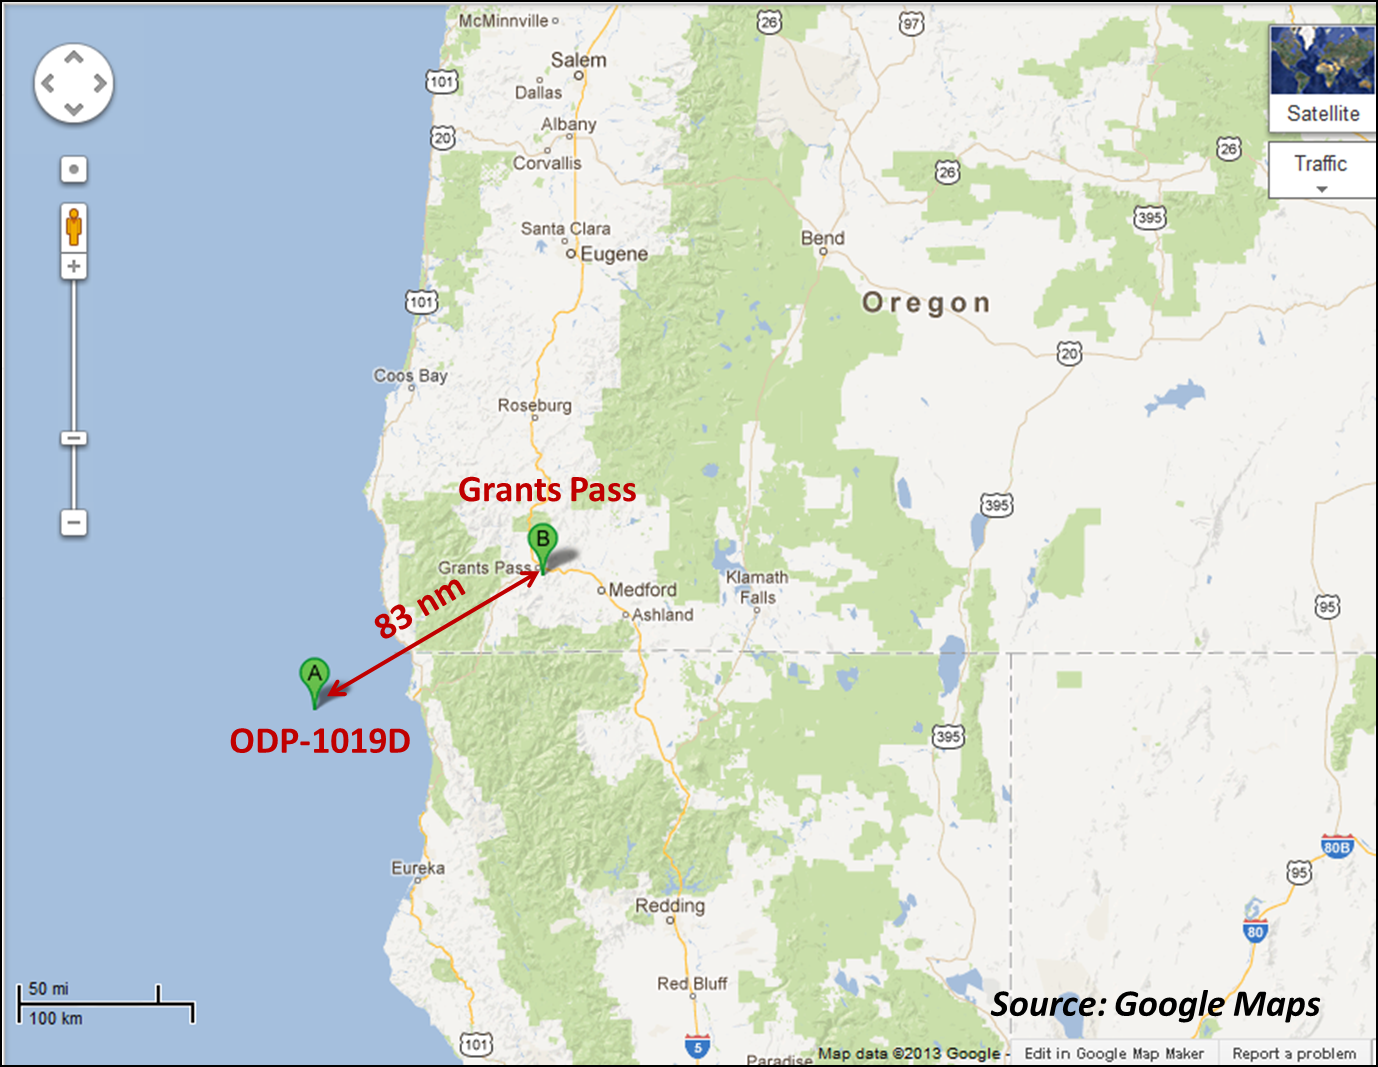
Let’s test one of the 73 proxies.
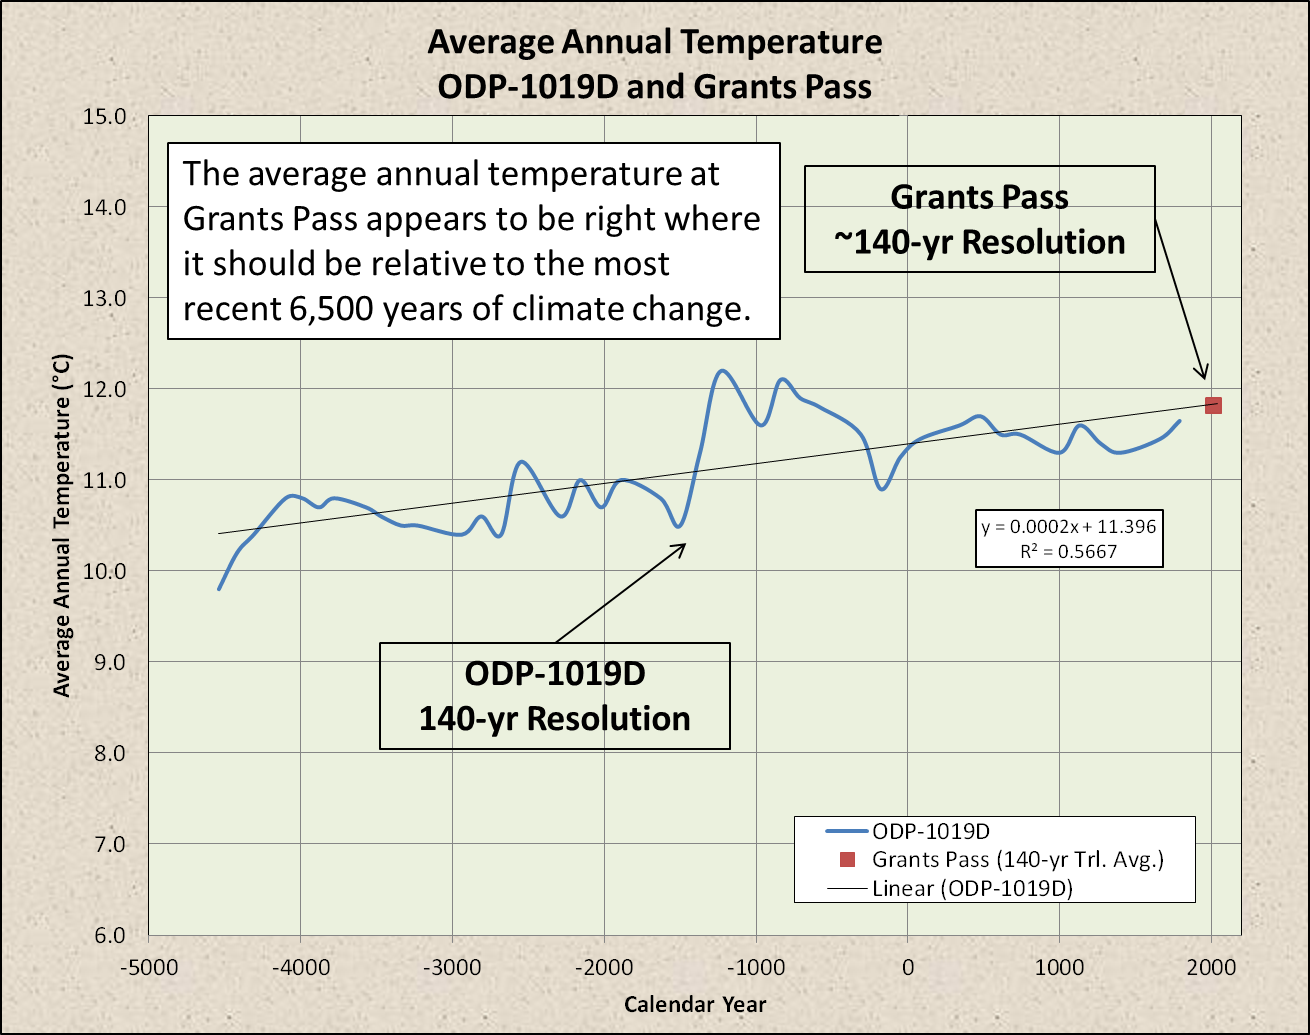
I picked ODP-1019D, a marine sediment core from just offshore of the California-Oregon border because it has a long time series, is a an annual reconstruction and has a nearby long time series instrumental record (Grants Pass OR).
ODP-1019D has a resolution of 140 years. Grants Pass is annually resolved…
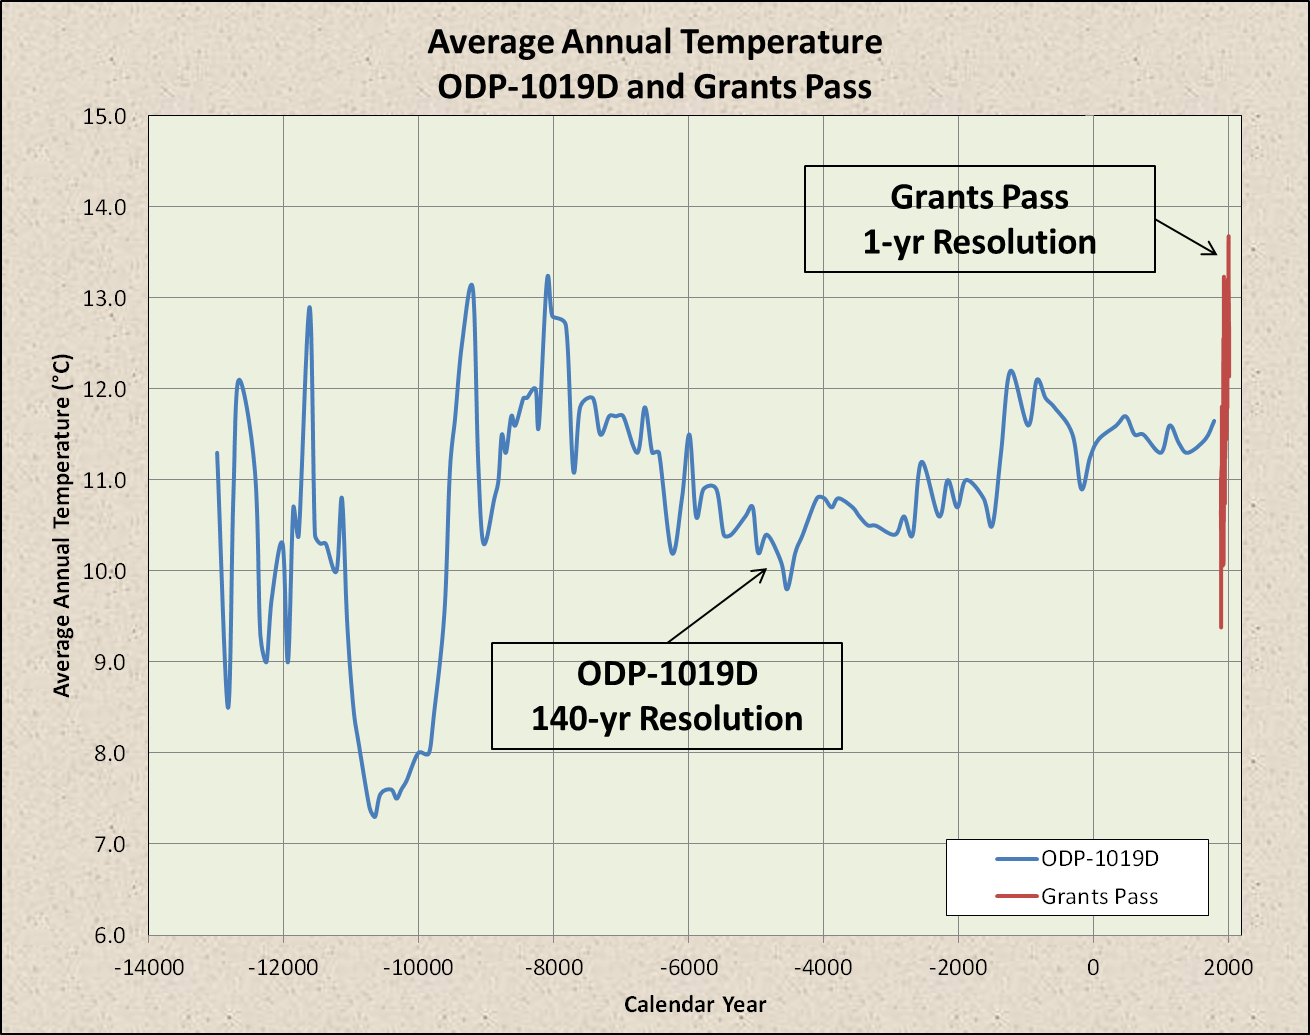
Let’s filter Grants Pass down to the resolution of the Marcott et al. reconstruction…
Grants Pass sure looks very anomalous relative to the rest of the Holocene… Right?
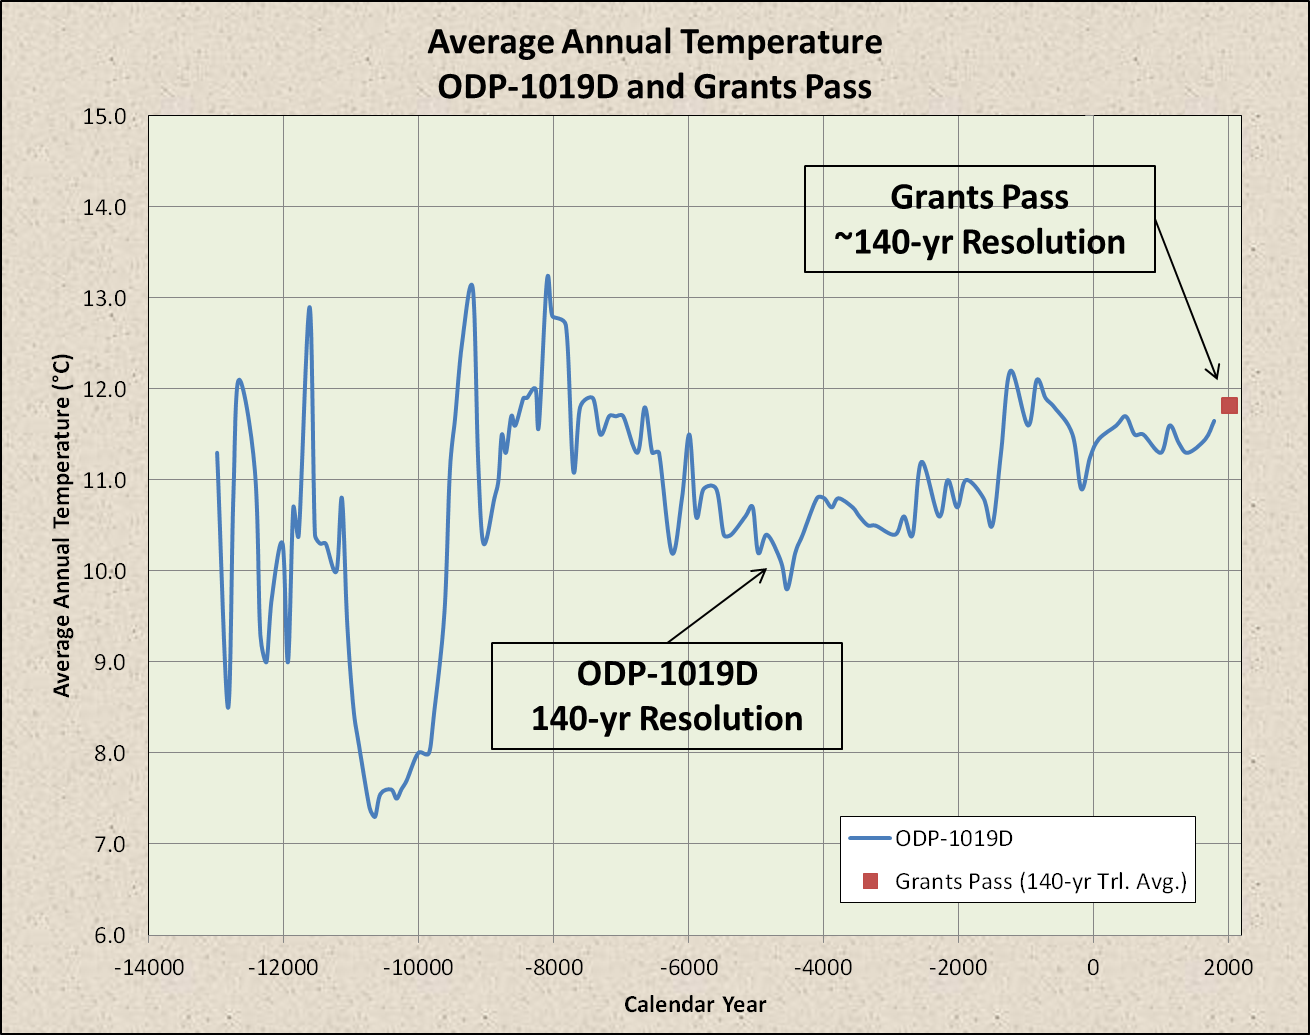
Well, not so fast. ODP1019D only has a 140-yr resolution. The record length at Grants Pass is less than 140 years. So, the entire Grants Pass record would be a single data point in the ODP-1019D record…
While, the most recent ~140 years might be warmer than most of the rest of the Holocene in this particular area, does anyone else notice what I did?
The Grants Pass/ODP-1019D area has been warming at a fairly steady rate for 6,500 years…
I don’t know how many of these proxies I will have time to analyze… Probably not very many. Maybe this could become a WUWT crowd-sourcing project.
https://wattsupwiththat.com/2013/03/11/a-simple-test-of-marcott-et-al-2013/
Perfect illustration of the misuse of different data to achieve the Eco-Fascist claims of “unprecedented” warming. The only thing “unprecedented” is the colossal misuse of supposed “science” to achieve political ends.
Marcott comprised provable academic misconduct. See the second of my two guest posts on the paper at the time at Climate Etc. for the forensic analysis.
I believe this is why Steve McIntyre started Climate Audit (although his experience is in mining).
I’m out of my depth numbers-wise when it comes to these discussions, but I did spend three years in a government office fulfilling FOI requests. If I knew of anyone admitting to deleting emails, and worse, counselling others to do so, I would recommend that they be terminated with cause.
0.7 deg C/century is not exceptional in the Adjustocene.
Good one! That beats out the list of epochs, Paleocene, Eocene, Oligocene, Miocene, Pliocene, Pleistocene, and the current “Obscene”.
-.01 per century for 70 centuries is -0.7C drop. Last 100 years 0.7C increase. Net zero.
The global temp hasn’t changed in 7000 years.
0.7c / century warming is a complete irrelevance and probably designed to enhance the ‘catastrophe’ media impact of any claimed recent warming. Alarmist hype, then.
The cooling La Nina however is set to cause them a LOT of real problems. Chuck in new anti-AGW policies from the Trump administration and alarmists are facing the biggest challenge to their theory yet. Interesting times beckon.
Seriously, these bozos imagine that comparing 45 years with a smoothed rate for 7000 or 9500 years is statistically meaningful? During the Holocene, it has not been unusual for global temperature to vary but whole degrees over a century, not just at a rate of fractions thereof.
Consider the hundred years from the mid-17th to mid-18th centuries, during recovery from the coldest part of the Little Ice Age. Or in reverse the crash from the height of Medieval warmth to the start of the LIA. That was at least a two degree drop in two or three centuries, so at a minimum 0.7 degrees C per century, but sustained for a lot longer than these charlatans’ supposed 45 years.
They also fail to not that CO2 was rising rapidly from at least 1945 to 1970 as well as during their cherry-picked interval of 1971-2016, yet earth cooled dramatically in the postwar decades, indeed until the PDO flip of 1977.
Atmospheric CO2 actually stopped rising and possibly fell during the 40’s and early 50’s, despite rising emissions.
David,
According to the original Antarctic results, CO2 stopped falling and started rising c. 1945. Some later, suspicious analysis suggests that it might have fallen again in the early ’50s, too.
For those who might like a refresher on how to read this …
The derivative of rate of change of Earth system (E) with respect to time (t) is a function of hysteria (H), caused by understating the importance and complexity of astronomical (A), geophysical (G), and ESPECIALLY internal (I) forcings.
… represented more truthfully … “at the highest level of abstraction”
CORRECTION:
. . . at the highest level of abstraction . . .
Robert Kernodle,
With respect, that’s a good start but not the highest level of abstraction. You need to filter it through an Andy Warhol or Peter Max filter. Then it would be totally unintelligible.
Throw in a little kesey and yer almost there…
Okay, seriously, I went back and skimmed the paper a bit more thoroughly, only to arrive at these observations:
* The baseline assumption is that recent warming trends are definitely caused by humans.
* The timeline of study is conveniently set to ignore reconstructed temperature trends BEFORE 10,000 years ago.
If you trust reconstructions to 10,000 years ago, why not trust reconstructions to 100,000 or more years ago? Oh, I see, if you did that, then you might see cyclic temperature behavior that existed WITHOUT humans, at temperatures JUST AS HIGH or HIGHER. That would mess up your spiffy label for a new epoch and a spiffy equation name to describe the assumed-dominant cause of recent trends that your choice of cut-off-time-in-the-past magnify to alarming proportions.
“highest level of abstraction”? … for sure … abstracting from reality. Now let’s see a drip painting version of that.
“The baseline assumption is that recent warming trends are definitely caused by humans.”
YES – and yet, this is exactly the type of twaddle that is trotted out as “scientific evidence” that “proves” the existence of AGW.”
Here’s what I posted in response to Troll Tony McL (who posted the same “Anthropocene” junk (with a lunatic’s diagram) yesterday on the “…” thread):
Sorry, TM. Your diagram is just a mess.
This drawing has more observation-based information in it than that diagram has.
http://images.clipartof.com/small/1063557-Talented-Yo-Yo-Boy-Boy-Poster-Art-Print.jpg