
Guest essay by Eric Worrall
Climate scientists finally seem to be learning from the acute embarrassment of colleagues who rashly trumpet the predictions of their climate models, as if they mean something.
Northeast warming more rapidly than most of US
New England is likely to experience significantly greater warming over the next decade, and beyond, than the rest of the planet, according to new findings by climate scientists at the University of Massachusetts Amherst.
The region’s temperatures are projected to rise by an average of 3.6 degrees Fahrenheit above pre-industrial levels by 2025, according to the study, published this week in PLOS One, a journal published by the Public Library of Science.
The scientists found that the Northeast is warming more rapidly than any other part of the country except Alaska — and that the 3.6 degree Fahrenheit rise in the region is likely to come two decades before the rest of the world gets to that point.
“I tell my students that they’re going to be able to tell their children, ‘I remember when it used to snow in Boston,’” said Ray Bradley, an author of the study and director of the Climate System Research Center at the University of Massachusetts. “We’ll have occasional snow, but we won’t have weeks and weeks of snow on the ground.”
…
The press release may seem assertive, but delve into the referenced study, and you find a little more caution about the claimed reliability of the predictions. That abstract starts reasonably confidently;
Consequences of Global Warming of 1.5 °C and 2 °C for Regional Temperature and Precipitation Changes in the Contiguous United States
Ambarish V. Karmalkar, Raymond S. Bradley
Published: January 11, 2017
The differential warming of land and ocean leads to many continental regions in the Northern Hemisphere warming at rates higher than the global mean temperature. Adaptation and conservation efforts will, therefore, benefit from understanding regional consequences of limiting the global mean temperature increase to well below 2°C above pre-industrial levels, a limit agreed upon at the United Nations Climate Summit in Paris in December 2015. Here, we analyze climate model simulations from the Coupled Model Intercomparison Project Phase 5 (CMIP5) to determine the timing and magnitude of regional temperature and precipitation changes across the contiguous United States (US) for global warming of 1.5 and 2°C and highlight consensus and uncertainties in model projections and their implications for making decisions. The regional warming rates differ considerably across the contiguous US, but all regions are projected to reach 2°C about 10-20 years before the global mean temperature. Although there is uncertainty in the timing of exactly when the 1.5 and 2°C thresholds will be crossed regionally, over 80% of the models project at least 2°C warming by 2050 for all regions for the high emissions scenario. This threshold-based approach also highlights regional variations in the rate of warming across the US. The fastest warming region in the contiguous US is the Northeast, which is projected to warm by 3°C when global warming reaches 2°C. The signal-to-noise ratio calculations indicate that the regional warming estimates remain outside the envelope of uncertainty throughout the twenty-first century, making them potentially useful to planners. The regional precipitation projections for global warming of 1.5°C and 2°C are uncertain, but the eastern US is projected to experience wetter winters and the Great Plains and the Northwest US are projected to experience drier summers in the future. The impact of different scenarios on regional precipitation projections is negligible throughout the twenty-first century compared to uncertainties associated with internal variability and model diversity.
Read more: http://journals.plos.org/plosone/article?id=10.1371/journal.pone.0168697
The content of the full study seems much less certain, with lots of qualification of the confident sounding assertions in the abstract and the press release.
… Under RCP8.5, all models indicate 1.5°C warming over CONUS before 2040 and 2°C warming before 2060, but the TCTs for RCP4.5 are distributed throughout the century. Notably, the ensemble mean temperature projections over CONUS reach 2°C warming by early to mid 2030s and 1.5°C warming by early 2020s despite large differences in TCTs for individual models. The observed warming over CONUS by 2014 relative to the baseline was roughly 1.0°C but a number of models suggest it to be over 1.5°C. Such disagreements could result from the mismatch in observed and simulated variability on decadal timescales
…
The lower bounds of temperature projections in Fig 3 typically represent how low climate sensitivity models respond to RCP4.5 whereas the higher bounds are determined by the responses of high climate sensitivity models to RCP8.5. Since the low sensitivity models indicate very little warming globally as well as regionally throughout the century, the lower bounds of projections are comparable across regions.
…
The Northeast is projected to cross the 2°C threshold about 15 years earlier than the South and about two decades before GMAT. For instance, about 80% of the projections indicate 2°C global warming by 2060 whereas the same percentage of projections cross the 2°C threshold in the Northeast by 2040.
…
All regions in the contiguous United States are projected to cross the 2°C warming threshold about 10-20 years earlier than the global mean annual temperature. While there is a large spread in TCTs across all regions, 75% to 90% of the models reach 2°C warming by 2050 for every region in the US. We believe that our estimates of TCTs based on 5-year means of annual mean temperatures may be conservative since we require that all the subsequent 5-year means beyond the identified threshold crossing time exceed the selected temperature threshold. The unpredictable nature of internal climate variability could advance or delay TCTs by a few years to a couple of decades regionally as demonstrated using the initials conditions ensemble. But this uncertainty in regional TCTs is smaller than the spread arising from using different models and two different scenarios. The consequence of large climate variability at regional scales, however, suggests that it may prove difficult to distinguish between the consequences of global warming of 1.5°C and 2°C for regional changes.
…
A cooling trend in the southeast US, the so called “warming hole”, in the second half of the twentieth century was not captured by CMIP5 models.
…
On the other hand, the eastern US is projected to reach the 2°C target in the 2020s regardless of the scenarios.
…
The CMIP5 multi-model ensemble used in this study samples the structural diversity in model formulation, but was not designed for systematic exploration of uncertainties, and therefore may not span the full range of outcomes in climate projections [39]. Additionally, the use of one realization for every model is inadequate to capture the effect of internal variability that plays a significant role in driving regional changes from years to decades.
…
If future generations of models reduce contributions from internal variability and model uncertainty substantially, studying precipitation response to different scenarios may become important. This, however, is unlikely given that the internal climate variations over CONUS remain large and highly unpredictable over the next 20-50 years.
Read more: Same link as above
Climate science – where any observation is acceptable, any uncertainty can be accommodated, and no theory is falsifiable.
Discover more from Watts Up With That?
Subscribe to get the latest posts sent to your email.
Comparing warming over land to global warming. The goal of limiting warming to 1.5 K or 2.0 K (as stupid as that goal is), was based on the expectation that surface temperature over the land would be rising faster than over the globe as a whole. A 1.5 K or 2.0 K “regional threshold” exists only in the imagination of the authors. In a few months, neither threshold is likely to remain part of US policy.
Wait, can’t these guys let the existing predictions expire before they repeat them?
Check this one out (again):
SHUMLIN: Any reasonable scientist will tell you that we’re going to rise anywhere between another two and three degrees in the next 30 years. That means that New Jersey’s climate is moving to Vermont in the next decade. That has tremendous implications in our economy’s ski, maple-sugar making, leaf-peeping and the list goes on and on. So we are — I at least am — looking at this with a major sense of panic.
Check out the date on that one:
http://www.marketplace.org/2007/04/18/sustainability/when-theres-less-white-green-mountain-state
Only three months to go!
…where any observation is acceptable, any uncertainty can be accommodated, and no theory is falsifiable.
Well, hopefully the bartender is a good listener.
Of course you can’t falsify theories. That would be worse than a micro-aggression. I need to go to my safe place now.
Here is the January snow totals for Boston, MA from 1920 to 1916. I don’t see anything indicating a reduction in recent years. Wish I had a graph:
http://weather-warehouse.com/WeatherHistory/PastWeatherData_BostonLoganIntLArpt_Boston_MA_January.html
Was looking for snow totals for the entire winter for Boston…
Your 1916 should be 2016, right?
Oops yes, 2016…thanks
Looks like the record year for snow in January in Boston was 2005 with 43.30 inches. That’s a lot more recent than 1920 to 2004.
I’m going to go out on a limb here, but my research shows that it’s likely that by 2025 Ray Bradley and his predictions will elicit a “What? Who?” from anyone. Let me know when we get there. I’m sure of my analysis.
Slow learners, this climate fear mongering, idol-worshiping crowd.
Meanwhile, back on the actual Earth…Northern Hemisphere total snowfall totals smashing all records.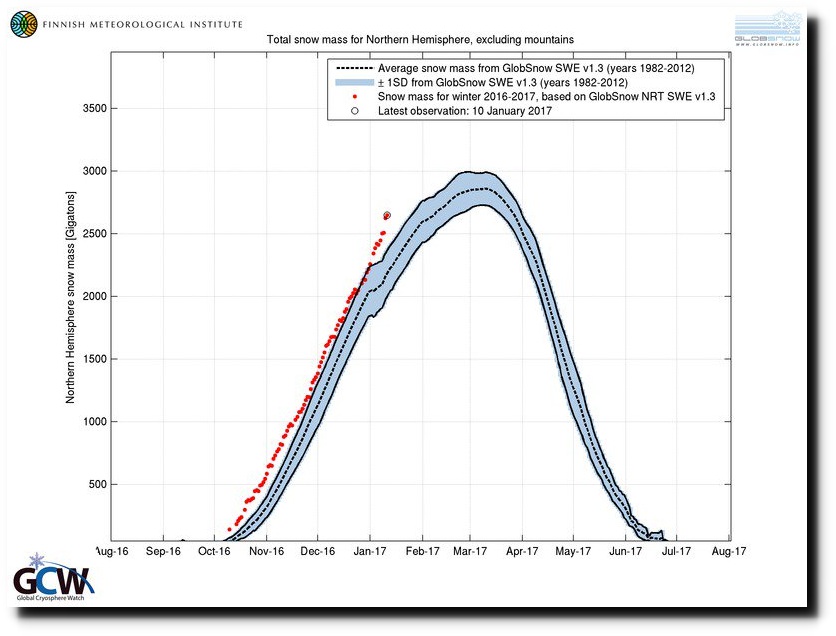
Men old soul,
I am not quite sure about ‘smashing all records’.
Now, certainly above the one SD line, so clearly in the top sextile.
Do you – we – have access to the 2 SD limits?
Do we not need to be fairly careful with our claims on here?
We can be a little short with some watermelons – Karmalkar and Bradley most recently . . . .
Auto
My first thought was it looks like 2 SDs, not too exciting yet.
interesting…..
I see the Boston Globe are also parrotting 7 feet sea level rise by the end of the century-
https://www.bostonglobe.com/metro/2017/01/13/rising-seas-threaten-jewel-trump-real-estate-empire/bsleB73TesDoLcVxJBK9LP/story.html?p1=Article_Recommended_ReadMore_Pos4
Well that’s an inch a year so we should be able to check that 4 inches at the end of Donald’s first term.
My parent remember the 1960s, when snow used to drift so high that you left home via second story windows sometimes.
Yeah, I drove through the White Mountains in ME/NH in a late 60’s winter.
One town had 13 Ft overnight. The lucky ones lived in 2 story homes…
“Climate science – where any observation is acceptable, any uncertainty can be accommodated, and no theory is falsifiable.” – Love the ending! Absolutely. Hallelujah and pass the grant money.
TRM
“Hallelujah and pass the grant money.”
Brilliant. And spot on.
Maybe the new POTUS, next week, will cut the budget deficit by the climastrophe billions.
I’m not holding my breath – but certainly hoping.
Auto, to the right of the Pond [with North up], and so near the French bits, where they do excellent wine.
“Climate science – where any observation is acceptable, any uncertainty can be accommodated, and no theory is falsifiable.”
Not sure what this means. Their figure 1, for example, clearly shows the full model range of projections. If observations fall outside that range then clearly the models will be falsified. If they fall outside the upper or lower 5% of the range for more than 10% of the projected period then they will also be falsified, etc.
As of 2016, the thick black line in figure 1 (CRU CONUS observations) will probably be at or above the CONUS RCP8.5 mean. That is, annual observations will likely be warmer than the multi-model average for the highest emissions scenario, some 11 years into the projected period. The models are nowhere near being falsified. In fact, if anything, they are currently supported by observations.
Another Al Gore moment in time….
Fake News or Fake Science…. They both have the same credibility..
Who you going to believe, your lying Data or the Model?
“The observed warming over CONUS by 2014 relative to the baseline was roughly 1.0°C but a number of models suggest it to be over 1.5°C”
Mods, I have a comment that seems to have gone to moderation.
Can you check for it please?
Global Warming will make climate predictions extinct? It’s worse than we thought!
We’re doomed.
Your final paragraph is a classic:
“Climate science – where any observation is acceptable, any uncertainty can be accommodated, and no theory is falsifiable.”
Ambarish V. Karmalkar, Raymond S. Bradley:
Their lips are moving and all I can hear is blah blah blah…
You can see it clearly on this graph of annual accumulated snowfall at the Revelstoke, BC ski hill. Heck, I’ll have to get my rock skis out in JUNE if this keeps up:
http://www.revelstokemountainresort.com/conditions/historical-snowfall
And then of course there is Mamoth, currently digging out – no snow you say? Really?
http://mammothsnowman.com/mammoth-mountain-snowfall-history/
Not to mention Central Oregon! We’ve had snow on the ground here in Bend for going on seven weeks now. Total amounts are challenging records.
They are not embarrassed themselves, of course. Only their colleagues are embarrassed.
Anything to avoid admitting they were wrong…..
For anybody concerned about reduced precipitation (which this year has fallen primarily as snow), they only have to look this far:
http://www.wrcc.dri.edu/cgi-bin/sno_narr3_pl
Snowpack is accumulating in the Western US to the point that if it continues, there will be flooding in the spring.
So – it mentioned Alaska: “the Northeast is warming more rapidly than any other part of the country except Alaska ..”
Well Alaska is certainly hotting up, isn’t it?
http://www.ktuu.com/content/news/2016–409402135.html
“In 2016, at least 14 communities around the state recorded their highest average temperatures ever. That includes Anchorage, where the average temperature was 4.5 degrees above normal. And in some places like Utqiaġvik, on the North Slope, the average temperature increased more than 7 degrees.”
“In 2014, the state of Alaska recorded its warmest year on record – records that in some cases have been kept since the 1920’s. 2015 was another warm year, before 2016 temperatures shattered the record. “Three years in a row now, the three warmest temperatures on record,” ”
shouldn’t this site be posting articles on the extraordinary situation in Alaska?
Oh, and the sea ice is still at a record low and expected to drop in this week’s continuing storms:
“…shouldn’t this site be posting …”
Griff,
You just did so. Thanks.
Griff, You can see your same account of arctic ice on Weatherbell.com’s weekend video, along with why it was predicted and why it is not a tragedy. Give it a try, bloke.
Yawn, there are about 13 Wadhams of ice floating in the place,Griff.
During most of last Glaciation period,there were less snow and Ice in most of Alaska than now. Meanwhile you continue to ignore the massive areas of cold and snow in Europe,Asia,Canada,America, Saudi Arabia,Greece and more.
Examples:
Black Sea Freezes For First Time in 62 Years – Video
Colorado ski resort closes – Too much snow
Snowfall tops 200 inches in CA, OR, NV and WA
Greek islands buried under 2 meters of snow – Before and after videos
Perth, Australia – Coldest winter in more than 20 years
Record snowfall on Prince Edward Island
Coldest Orthodox Christmas in Russia in 120 years
Record snowfall in Istanbul – More than ½ meter (19 inches)
Idaho – Most snow on the ground, any day of the year, any year
Snowing in New Zealand – In high summer
Record snowfall in Newfoundland – And no snowplows at night
Billings breaks snowfall record for entire month of December
Baker City, Oregon, closes in on snowfall record
Heavy snowfall on Island of Crete
Rare snowfall in Athens
Biting cold in Pakistan
Strongest blizzard in 80 years to hit Palestine
and more…….
https://www.iceagenow.info/
You bore me with your stupid Arctic is dying drivel.
Sunsettommy:
Then why does NH data from UAH v6beta5 TLT not indicate that “cold”
Nov 0.41
Dec 0.19
And North Pole …
Nov 0.96
Dec 0.00
Re a baseline of 1981-2010:
(Used due denizens preference and data availability)
http://www.nsstc.uah.edu/data/msu/v6.0/tlt/uahncdc_lt_6.0.txt
Snow is not a measure of cold.
In fact the closer to 0C then the more will fall.
It is more a measure of atmospheric water content.
Which is greater at warmer temps.
Shouldn’t you be apologising to Dr. Crockford for attempting to impugn her professional credentials, you nasty little liar?
http://www.bbc.co.uk/news/world-europe-38623669
“Ski World Cup: Lauberhorn race cancelled because of too much snow”
ruined the piste apparently.
Hmm… avalanche conditions?
Also, from that article:
Here in Colorado, years ago, climate “scientists” were getting ski operators worried about the forecasted lack of snow in the area — saying that ski areas would no longer be able to stay open. Lately, they’ve been having the opposite problem — too much snow. A few ski areas were closed either because of the avalanche danger created by the high snow amounts, or problems accessing the sites, due to impassable roads. BTW, I’d like someone to explain to me why CA is having so much precipitation, when dry weather was predicted, due to La Nina.
No snow on the ground in Boston. Gee, that would be great. Denver’s average high in mid-winter is about 10 degrees F higher than here outside Boston. There are many years when there is snow on the ground for weeks in Denver – and many years when there is very little snow on the ground. I don’t think a 2 degree C difference would get rid of snow on the ground. It’s much more a function of how much it snows.
Unless the author expects his students to live many hundreds of years, he can’t possibly be telling the truth to his students.