Global Temperature Report: December 2016

Global climate trend since Nov. 16, 1978: +0.12 C per decade
December temperatures (preliminary)
Global composite temp.: +0.24 C (about 0.43 degrees Fahrenheit) above 30-year average for December.
Northern Hemisphere: +0.19 C (about 0.34 degrees Fahrenheit) above 30-year average for December.
Southern Hemisphere: +0.30 C (about 0.54 degrees Fahrenheit) above 30-year average for December.
Tropics: +0.21 C (about 0.38 degrees Fahrenheit) above 30-year average for December.

November temperatures (revised):
Global Composite: +0.45 C above 30-year average
Northern Hemisphere: +0.49 C above 30-year average
Southern Hemisphere: +0.50 C above 30-year average
Tropics: +0.37 C above 30-year average
(All temperature anomalies are based on a 30-year average (1981-2010) for the month reported.)
Notes on data released Jan. 3, 2017:
Globally, 2016 edged out 1998 by +0.02 C to become the warmest year in the 38-year satellite temperature record, according to Dr. John Christy, director of the Earth System Science Center at The University of Alabama in Huntsville. Because the margin of error is about 0.10 C, this would technically be a statistical tie, with a higher probability that 2016 was warmer than 1998. The main difference was the extra warmth in the Northern Hemisphere in 2016 compared to 1998.
Year GL NH SH TROP
2016 +0.505 +0.61 +0.40 +0.61 C
1998 +0.484 +0.51 +0.46 +0.68 C
“The question is, does 2016’s record warmth mean anything scientifically?” Christy said. “I suppose the answer is, not really.”
Both 1998 and 2016 are anomalies, outliers, and in both cases we have an easily identifiable cause for that anomaly: A powerful El Niño Pacific Ocean warming event.

While El Niños are natural climatic events, they also are transient. In the study of climate, we are more concerned with accurately identifying long-term temperature trends than we are with short-term spikes and dips, especially when those spikes and dips have easily identified natural causes.
“Some records catch our attention because we usually struggle to cope with rare events. For example, the Sept.-Nov. record heat and dryness in the southeastern U.S. (now a thing of the past) will be remembered more than the probability that 2016 edged 1998 in global temperatures. So, from the long-term perspective, 2016’s record may be less noteworthy than where the month-to-month temperature settles out between warming and cooling events.”
Compared to seasonal norms, the warmest average temperature anomaly on Earth in December was in south central China, near the town of Qamdo. December temperatures there averaged 3.91 C (about 7.04 degrees F) warmer than seasonal norms. Compared to seasonal norms, the coolest average temperature on Earth in December was near the town of Buffalo Narrows in west central Saskatchewan. December temperatures there averaged 4.13 C (about 7.43 degrees F) cooler than seasonal norms.
The December 2016 GTR includes the global temperature anomaly map for the month and the month-by-month graph of global temperature anomalies for the duration of the satellite temperature dataset. It also includes a global map of the 2016 temperature anomalies, and a global map of the regional climate trends from December 1978 through December 2016.

A paper with the scientific explanations of changes made in creating version 6.0 of the satellite troposphere dataset has been accepted for publication in the Asia-Pacific Journal of Atmospheric Science. The complete version 6 lower troposphere dataset is available here:
http://www.nsstc.uah.edu/data/msu/v6.0/tlt/uahncdc_lt_6.0.txt
Archived color maps of local temperature anomalies are available on-line at:
As part of an ongoing joint project between UAHuntsville, NOAA and NASA, Christy and Dr. Roy Spencer, an ESSC principal scientist, use data gathered by advanced microwave sounding units on NOAA and NASA satellites to get accurate temperature readings for almost all regions of the Earth. This includes remote desert, ocean and rain forest areas where reliable climate data are not otherwise available.
The satellite-based instruments measure the temperature of the atmosphere from the surface up to an altitude of about eight kilometers above sea level. Once the monthly temperature data are collected and processed, they are placed in a “public” computer file for immediate access by atmospheric scientists in the U.S. and abroad.
Neither Christy nor Spencer receives any research support or funding from oil, coal or industrial companies or organizations, or from any private or special interest groups. All of their climate research funding comes from federal and state grants or contracts.
— 30 —
Roy Spencer has more comments at http://www.drroyspencer.com/2017/01/global-satellites-2016-not-statistically-warmer-than-1998/
http://www.drroyspencer.com/wp-content/uploads/UAH_LT_1979_thru_December_2016_v6.jpg
Well if Roy/John get their funds from; or some of them from the Federal gummint; who do you suppose is the primary beneficiary (monetarily) of the oil and gas industry.
Well that would be our favorite Uncle.
I don’t mind if Roy/John get some of MY money back from the endless spenders.
G
18 years and we’re up .02C, then in 1800 years we should be up 2C compared to 1998. That’s my model and I’m sticking to it.
What’s your basis for assuming that the next reading will be up rather than down ??
G
Well yes, as this “super El Nino” was larger then 98, ( per alarmits reports) and the blob was still there. ( long gone now) so perhaps we are cooling.
But Jimg1has an excellent basis for assuming trends. PHD researchers get paid to do this.
Because Present temperatures always get adjusted up and Historical temperatures always get adjusted down.
Outstanding argument Jim G1!
That the increase was only .02°C makes it easy to make the point that climate sensitivity to CO2 must be EXTREMELY low. So in 100 years it’s going to be 0.1°C warmer! I’m scared!
Probably sensitivity is in fact essentially zero, as nature reacts to the tiny bit of extra heating from the increased CO2 perturbation by increased low cloud formation, which is going to cool us just as much as the CO2 warms us, so it evens out to .. near zero. So CO2 has absolutely no negatives as far as climate, but huge positives as agricultural productivity has already gone up by 20%, and we’re seeing forests grow and deserts recede across the planet.
“Then you show the RSS adjustments for v4.0 in an attempt to compare them to the changes occurring with 6.0 but don’t even grasp that the two graphs are measure two different things.”
No, he showed RSS v3 TMT (not TLT) vs RSS v4 TMT.
spot on….
http://realclimatescience.com/wp-content/uploads/2017/01/Screen-Shot-2017-01-02-at-6.12.27-PM.gif
Nah, if you want to see something that has really been “adjusted” look no further than to UAH…..
http://postmyimage.com/img2/995_Tropospheretrends.png
Trend v5.6 TLT 0.126 C/Dec
Trend v6.0 TLT 0.030 C/Dec
And to RSS…..
RSS v3 TMT 0.078 C/Dec
RSS v4 TMT 0.125 C/Dec
Notice that they are going in opposite directions to boot.
YAWN..
UAH and RSS adjusted for KNOWN satellite issues.
GISS etc.. AGW scam warming, for invented non-scientific reasons.
Understand the difference…. no , you probably don’t.
Latitude on January 3, 2017 at 6:40 pm
Spot on? Oh yes!
http://fs5.directupload.net/images/170104/42f5oioo.jpg
Source: https://moyhu.blogspot.de/2015/12/big-uah-adjustments.html
Such modifications will always exist.
They are explained here:http://data.giss.nasa.gov/gistemp/
You just need to read (especially about how they handle UHI) and follow the links, but probably you prefer to attack them I guess.
The difference between us is that I trust in Spencer’s integrity (and that’s not evident at all, believe me).
you prefer to attack them I guess….
Paranoid much?
It takes an added (inverse) hockey stick to make temperatures appear as a hockey stick.
Toneb — New to climate science? Do you not understand the difference in merit/value between the interpretation of AMSU satellite data and their adjustments vs the interpolation of widely spaced temperature data points and their adjustments?
Your graphs suggest you can’t recognize good science and are susceptible to falling for pseudoscience. First, you choose to show a cherry-picked time period to compare UAH 5.6 to 6.0, when instead the complete dataset actually shows a difference of 0.026 degrees/decade difference, not the 0.096 difference your pseudoscience graph portrays.
Then you show the RSS adjustments for v4.0 in an attempt to compare them to the changes occurring with 6.0 but don’t even grasp that the two graphs are measure two different things. RSS 4.0 has only been released for the mid-troposphere. RSS seems to be dragging their feet on the 4.0 LT interpretation, probably because they need to account for the differences in NOAA-14-MSU and NOAA-15-AMSU.
http://www.drroyspencer.com/2016/03/comments-on-new-rss-v4-pause-busting-global-temperature-dataset/
“Then you show the RSS adjustments for v4.0 in an attempt to compare them to the changes occurring with 6.0 but don’t even grasp that the two graphs are measure two different things.”
No, he showed RSS v3 TMT (not TLT) vs RSS v4 TMT.
That’s exactly my point Nick. He’s showing the RSS adjustments to TMT and says “they are going in opposite direction”, in reference to the UAH TLT 6.0 adjustments.
“Toneb — New to climate science? Do you not understand the difference in merit/value between the interpretation of AMSU satellite data and their adjustments vs the interpolation of widely spaced temperature data points and their adjustments?”
No.
32 years working for the UKMO.
20 as an on-the-bench forecaster.
And you?
And the difference is that sat temp data rely on ONE instrument.
Whereas the surface record relies on thousands of thermometers.
That do?
I only understand to denizens, that if the sat record were warmer you wouldn’t be so possessive of them.
And also, tell me where you rank RSS v4 currently?
And could you tell me the merits of fixing an ave temp for a thickness of the atmosphere and doing so via adjustments made for the Sat’s diurnal drift?
Such that a “fudge factor” taken from an NWP model is sometimes needed to determine when the time of max/min would have been in order to “measure” them correctly.
Wot would you say if the observer at a weather station wondered in 4 hours late and guessed what/when it was by reference to the forecast passage of a front say?
Or maybe read the max temp in the early evening?
I understand the meaning of the “h” word when I see it my friend.
And I see it very often on here.
Oh, if you would like to understand why UAH and RSS -using the same SINGLE instrument have such differing trends, then you may care to view my other post below.
And the difference is that sat temp data rely on ONE instrument.
Whereas the surface record relies on thousands of thermometers.
That do?
Toneb, did they fire you for that?
thousands of thermometers of which 89% are not in WMO standards to measure the temperature correctly…
as we in belgium are again at what we call the “winterfront” (the edge between warm and cold air) we got the famous whacky winter (cold – mild – cold swaps)
ideal for fairytale landscapes but also ideal for observing the urban-rural difference, as this means temperatures in the 28-34°F range with mysty nights and sunny days.
i go to my work by bike to a small town, and then to a medium city (250.000 people), i do live in a small village (1200 people).
at 10 AM i did ride through a white frostfeather covered landscape, on the train just the same till the outskirts of Ghent were reached…. everything’s gone. where i live all puddles and small ponds were ice covered (thin ice as the freezing is mild) but in ghent? nothing.
i would say, come off your bench toneb and observe outside. with the weather conditions we have had here over the last week the UHI-effect was just visible in plain sight!
even the E 40 a very busy highway does show it’s warm footprint in such conditions: it showed snow on one side and no snow on the leeward side for miles, then the snow was back.
it’s not that i do not give any value to your thousands of thermometers, it’s that with them it is also important, and even very important to ask first where and how they are sited
as surfacestations.org shows: 89% of the readings should be discarded as the sites do not meet the standards for a correct temperature measure.
Hi Jim, You presume that the temperature will rise for 1800 years the same way as the last 18 Years. That’s not probable. I expect changing trends, up and down, and some major El Ninos and volcanic eruptions in the next 1800 years. Climate is not linear. .(But generally youre right!)
Marty,
Like I said, it’s my model and I’m sticking to it. It’s just as verifiable as most the models that go into the distant future, not near as many factors to be adjusted, simple time line, probably more accurate than most of the other models, I’m doing it for free, no grants required and we’ll all be dead before the 1800 years is up so no one to carp about it one way or the other. Plus I did NOT say what may happen in the intervening years. Must be worth a couple hundred thousand $ grant.
Here’s something that shows 10 times that;

Thanks Bob.
Combine with:
Hmmm, no statistical tie there.
Typo: The 0.49 is 0.41.
That’s about one millikelvin per year. I doubt that has any meaning.
At least the satellite measurements do scan most of the globe.
Much better than a handful of surface measurements that go higgledepiggeldy all over the planet.
You need a certain number of INDEPENDENT measurements, based on the highest frequency of both spatial and temporal change, or your whole data set is just rubbish.
G
george e. smith on January 3, 2017 at 2:49 pm
Much better than a handful of surface measurements that go higgledepiggeldy all over the planet.
The best way to contradict such a superficial meaning is a sharper look at the data.
Once you managed to collect
– GHCN station data to build a global mean of it, and
– UAH 2.5° grid data to buid another global mean of it,
you may compare these means.
Of course, there is no doubt that a GHCN global mean will show a far higher trend than does a similar global mean using UAH data; it is even higher than GISS land-only.
Surface isn’t (lower? mid!) troposphere.
But you can also merge these results by
– collecting, within the 9,504 UAH grid cells, all those encompassing GHCN stations having contributed to a global surface mean during the satellite era, i.e. 1979-2016,
– build a mean over these about 2,100 grid cells, and
– compare the result with UAH’s original Globe land record.
Here is a chart showing that comparison:
http://fs5.directupload.net/images/170104/e74esgs9.jpg
Do you really think that the perfect fit you see here is random?
Why did you choose a graph starting in 1978? Do you always cherry pick?
BIF, that’s when the satellite data starts…
Bindi, nice graph work. You’ve demonstated that you don’t need to cover the whole globe to ascertain global temps. (a healthy random sampling will do)…
You do know a linear regression will always be linear, right?
Notice how your graph flattens in 1998. Either use two separate regressions in acknowledgment, or use a 2nd degree polynomial fit. To do otherwise would be a blatant deceit.
This message was brought to you free of charge by your community statistician.
Forrest Gardener on January 3, 2017 at 7:39 pm
… GHCN does not use data.
Gardener’s usual garbage!
Neither would you be ever able to give us a valuable proof of what you pretend, nor did you understand a tenth of what I wrote and why I did.
Please be kind and stop your egocentric nonsense around my comments, I get tired of reading it.
Are you telling us in regions with no thermometers the surface warming trend is much lower, even lower than UAH lower troposphere global? Interesting.
Berényi Péter on January 4, 2017 at 5:07 am
Are you telling us in regions with no thermometers the surface warming trend is much lower, even lower than UAH lower troposphere global? Interesting.
I am afraid you might have misunderstood my comment, especially wrt this:
Of course, there is no doubt that a GHCN global mean will show a far higher trend than does a similar global mean using UAH data; it is even higher than GISS land-only.
Surface isn’t (lower? mid!) troposphere.
What I compared was not GHCN global with UAH global. Nor did I write anything about “regions with no thermometers”.
I compared
– UAH’s global land record, i.e. column 4 in
http://www.nsstc.uah.edu/data/msu/v6.0/tlt/uahncdc_lt_6.0.txt
with
– a mean of those grid cells in UAH’s 2.5° grid data in
http://www.nsstc.uah.edu/data/msu/v6.0/tlt/{tltmonamg.1978_6.0:tltmonamg.2016_6.0}
which encompass GHCN workstations: it’s easy to find the grid cells on the base of the stations’ coordinates, available e.g. in the stations’ metadata file within
https://www1.ncdc.noaa.gov/pub/data/ghcn/v3/ghcnm.tavg.latest.qcu.tar.gz
The idea was to show that, due to the correlation between surface and troposphere, a very good fit of UAH’s global land record with that grid average might be a hint on the representativity of the GHCN stations for a global surface average temperature on land areas.
The next step would be a comparison of sea surface grid averaging with UAH’s global ocean record; but this is a more complex task.
Bartleby on January 4, 2017 at 1:58 am
Either use two separate regressions in acknowledgment…
What in the world are you writing here, Bartleby? Below you see the graph with exactly the same two time series, with a 3rd degree polynomial fit (the 2nd is here nearly as flat as the OLS variant):
http://fs5.directupload.net/images/170104/qrxh4klw.jpg
Maybe you try to express possibly correct thoughts in a somewhat more intelligible form?
afonzarelli on January 4, 2017 at 12:30 am
… a healthy random sampling will do.
Yes I agree, fonzi! A somewhat humoristic remark, but there is somewhat basically true in it.
BTW: could there be any better tool against cherry picking? I guess no 🙂
Well, if 2016 is going to be spun by the Media as THE HOTTEST YEAR EVER, I can spin it as Proof of the Pause:
HEADLINE: THE EARTH’S AVERAGE TEMPERATURE HAS REMAINED BASICALLY THE SAME FOR 18 YEARS!
Sub-Headline: 2016 ONLY 0.02 degrees C WARMER THAN 1998!
+1
Yea, 0.02 degrees.
Nice, I thought it felt warmer !
;-}
Yes, this is a huge win for the climate deniers!
What are we denying now? That the climate got 0.02°C warmer in 20 years? Lol.
It’s time to put the politicized climate scam out of its misery.
I bought an air conditioner for my garage with the “savings” I made buying government subsidized solar panels for my roof!
Suckers! I play this game to win.
Yes, it is always best to use the warmunists own scare tactics against them.
Either 0.02 is Very, Very Important (i.e, ITS GETTING HOT!!!!)…or it isn’t (the Pause).
Won’t hold my breath, though, that they’ll get math anytime soon. Don’t need math to take a Sharpie to some cardboard when you’re on the March to Take Down Trump.
Yes but it’s two hundredths of a degree Celsius! That’s almost twice as much as two hundredths of a Fahrenheit or a Rankin degree!
Unless you chose 1997 or 1999, but that wouldn’t be as convenient.
lets not forget the average of 4 balloon data sets also validate the satellite data
Mark – Helsinki on January 3, 2017 at 2:51 pm
Please show us the average of 4 balloon data sets validating the satellite data.
But NOT by using this tricky, deprecated chart:
http://fs5.directupload.net/images/170104/26s5uk29.jpg
RSS and Hadsst3 are also in the same boat and will have statistically insignificant records of a few hundredths of a degree.
GISS will have a statistically significant anomaly of over 0.1 above 2015.
However Hadcrut4.5 is the one to watch! After 11 months, its average is 0.79 which is only 0.03 above the 0.76 average of 2015. It only needs to drop by 0.086 from 0.524 in November to 0.438 in December to tie 2015.
1998 and 2016 are not outliers or anomalies. It’s normal for El Niño to be about .2c warmer.
And I’ve enjoyed our nice run of above average months here in the northland. I want warmth. More and more warmth. “Mother earth…please provide warmer weather where I live for the rest of my years, thank you”. .
Here it is:
***
(Source: http://www.john-daly.com/usatemps.006, quoted by David L. Hagen, here: https://wattsupwiththat.com/2012/11/20/myths-and-facts-about-global-warming/#comment-1153113 )
Janice- There is some data here which purports to be raw. It’s believable since there is zero trend in it.
ftp://ftp.ncdc.noaa.gov/pub/data/ushcn/v2.5
And this is what the Northern Hemisphere used to look like before the concerted adjustments made to the temperature data during the last 30 or so years:
http://realclimatescience.com/wp-content/uploads/2016/01/0B8C71B1-21CB-709A-4E7E-A7FCDFF8CDCD.jpg
It was published in Science News Volume 107.
richard verney on January 4, 2017 at 1:23 am
And this is what the Northern Hemisphere used to look like before the concerted adjustments made to the temperature data during the last 30 or so years…
I understand your point. But I think that considering the discrepancy between the chart you show and those made today be solely due to whichever adjustment is a deep mistake.
Simply because the station sets used to produce temperature records are by no means fixed entities.
One of the youngest examples showing that is the transition from CRUTEM3 to CRUTEM4 which led to that from HadCRUT3 to HadCRUT4. In CRUTEM4, old stations located in the northern areas of the Russian Federation were added to the dataset, what resulted in the Arctic regions suddenly showing much more warmth in CRUTEM4 than in CRUTEM3.
Here is the difference shown by WFT for NH between 1880 and 1970:
http://fs5.directupload.net/images/170104/t6fsmhtz.jpg
This means that before supposing any adjustment, you first must eliminate, out of the actual dataset, all records produced by stations existing (decades or even a century) before your chart was produced but which were not present in the dataset at that time.
richard verney on January 4, 2017 at 1:23 am [2]
My lady Pangolina contacted a GHCN specialist to check for the existence of data stored at the time of this chart’s publication in Science News. Here is the answer:
Do you consider this chart be valuable information?
Steven Mosher – “1998 and 2016 are not outliers or anomalies. It’s normal for El Niño to be about .2c warmer.)
———————–
It is, in fact, very normal for the super-El-Ninos to be outliers versus the normal mid-range El Ninos.
The 1877-78 super-El-Nino resulted in temperatures which were 0.7C above the on-going trend of the time.
1997-98 was about 0.6C above trend in the lower troposphere (and was in the surface record until they adjusted it out).
2015-16 is a jump of 0.5C (soon to be completely gone).
The lone exception is the 1982-83 super-El-Nino but it was cut-off mid-jump by the El Chichon volcanic eruptions in March 1983.
And the longer back-to-back-to-back El Ninos of 1939-1942 resulted in a jump of 0.4C.
Lets have a closer look at El Ninos again and then how that makes a difference when people try to talk about the record 2016 and how the climate models are right. Well it makes a big difference how you view what super-El-Ninos really do.
The climate models now look like crap again with the down-dip after the super-El-Nino completing its phase.
“The climate models now look like crap again”
No, the graph looks like crap. Why is it comparing forecasts for the lower troposphere with predictions for the surface?
Bill:
“Lets have a closer look at El Ninos again and then how that makes a difference when people try to talk about the record 2016 and how the climate models are right. Well it makes a big difference how you view what super-El-Ninos really do.
The climate models now look like crap again with the down-dip after the super-El-Nino completing its phase..”
Yes let’s…
See the ’98 EN?
It raised GMT’s (well actually not as this is brightness as seen over a layer of the trop which the MSU/AMSU over registered due sensitivity to atmos WV …. but I digress).
By ~ 0.6 C
The ’16 EN raised Temps by a similar amount.
Yet the latter was based from a heightened trend. Hence the “warmest year evah”.
And no they don’t look “crap” at all, as we haven’t had any sort of trend extension visible with only 10 months having gone by since the EN peak.
You do hold the correct concept of a trend in mind?
That is – a meaningful one in terms of length?
30 years is about right to see a natural cycle within the climate system complete.
I also suppose, since you are prepared to place the blame on warming at the feet of EN’s – that you would do the same for the opposite. For LN’s.
Only fair.
Yes?
FI : the succession of them within the -be PDO/ENSO regime that was largely responsible for “Monckton’s pause”?
Nurse, nurse, Mosher got out again. Get those “the end is nigh” billboards off him and get him back in his straightjacket ….
…. and somebody find him a real job, PLEASE.
Steve I’ve actually read a bit about you, I commend you for publishing your name. I don’t have that luxury since I can’t afford private security and I’m not wiling to risk my life and livelihood in the pursuit of scientific integrity.
That said, can you seriously argue the resolution of temperature is a tenth of a degree? Honestly?
We have been in a cooling trend since the 1930’s. Hansen said the 1930’s was hotter than 1998, and 2016 is tied with 1998, which makes the 1930’s hotter than 2016. That’s a downtrend. And it looks like we are still going to be in the downtrend as the temperatures are going down now, not up.
I know TA, I suppose I’m suffering from Stockholm Syndrome a bit. I moved 250 miles south last year, 500 miles south the year before. I’m invested in global cooling.
Forrest I’ve read many of your posts along with many posts by Eric an Anthony, Willis and Tim.
You should be aware that you might very well be walking directly into a trap. Just as “The Donald” first tried to identify his adversaries at NASA, NOAA and the EPA, so you should be aware that someone of very equivalent power is actively trying to identify YOU.
That’s right, we have been on a warming trend for well over a century. It’s sort of like climbing a mountain, and at nearly every point along the path you will be the highest you’e ever been on the journey. The only question is how high is the mountain.
Steve,you could step over the mountain if it were not for all the adjustments and other data mangling and fudging.
And how steep.
That’ absurd Steve. Near as anyone can tell the planet has been warming since the end of the last ice age, over 10,000 years ago. It would be a surprise if 2017 wasn’t warmer by some ridiculous fraction than 2016.
We call it a “warming trend” because it’s a trend. That means we actually expect it to be warmer in the future. Did you miss that part?
“It would be a surprise if 2017 wasn’t warmer by some ridiculous fraction than 2016.”
The years after the 1998 El Nino were not warmer than 1998. In fact, no year has been warmer than 1998, until we get to 2016.
What should be expected, imo, is that the temperature profile after the 2016 El Nino will resemble the temperature profile after the 1998 El Nino, when the temperatures dropped and there were no record hot years between 1998 and 2016 (UAH).
“We’re all going to die!!!!!”
(c) Griff 2017
It should that this month’s drop of 0.21 C puts temps right back where they were before the el nino. With the el nino gone, it’s a matter of wait and see as we head into the next solar min…
“It should that” should read “It should be noted that”
The BIG news is the 0.21C drop.
The anomaly in December is only 0.243C. And the effects of the 2015-16 super-El-Nino have still not completely wore off yet. There is still another 0.1C of decline yet to come.
This my projection going one year out. (If you don’t think this can be accurate, one year ago my projection for December 2016 UAH-RSS average was 0.222C and the actual for UAH came in at 0.243C so that is more accurate than any climate model by a mile).
+1
WOWZA(!) Bill, that’s impressive… Where do you think temps are going after that?
Bill, thanks and well done on your previous prediction.
As I have said before; you are one of the few people around here who knows what they are talking about.
Great work Bill.
Here is my similar post from July 2016, with more recent comments.
The cooling is right on schedule.
Best, Allan
https://wattsupwiththat.com/2016/12/02/climate-advocate-outrage-over-global-cooling-congress-tweet/comment-page-1/#comment-2358088
This drop in temperature was predicted four months ago in July in this post. The Nino3.4 area temperatures continue to fall, so the UAH Global LT temperatures should soon catch up with the LT land temperatures.
Bill Illis did an earlier and more detailed analysis of this subject, with a three-month predictor of Tropical LT temperatures..
Regards, Allan
https://wattsupwiththat.com/2016/07/01/spectacular-drop-in-global-average-satellite-temperatures/comment-page-1/#comment-2250667
I plotted the same formula back to 1982, which is where I (I think arbitrarily) started my first analysis. Satellite temperature data began in 1979.
That formula is: UAHLT Calc. = 0.20*Nino3.4SST +0.15
It is apparent that UAHLT Calc. is substantially higher than UAH Actual for two periods, each of ~5 years,
BUT that difference could be largely or entirely due to the two major volcanoes, El Chichon in 1982 and Mt. Pinatubo in 1991.
This leads to a startling new hypothesis: First, look at the blue line, which shows NO significant global warming over the entire period from 1982 to 2016. Perhaps the “global warming” observed after the 1997-98 El Nino was not global warming at all; maybe it was just the natural recovery in global temperatures after two of the largest volcanoes in recent history.
Comments?
Regards, Allan
https://www.facebook.com/photo.php?fbid=1030751950335700&set=a.1012901982120697.1073741826.100002027142240&type=3
The Nino3.4 SST Anomaly continued to cool to -0.73C in October 2016 before warming to -0.42C in December 2016.
http://www.cpc.ncep.noaa.gov/data/indices/sstoi.indices
My formula is: UAHLT Anom. Calc. (4 months in the future) = 0.20*Nino3.4SST Anom. +0.15
So “theoretically” (and assuming I can still run a hand calculator), UAHLT should decline to about 0.00C in February 2017 before recovering to about +0.07C in April 2017.
OK, let’s round that to 0.0C in February 2017 and +0.1C in April 2017.
Competing bets are welcomed – Ladies and Germs, faites vos jeux!
Best, Allan 🙂
My above prediction is based on NO MAJOR VOLCANOES.
Hate those major volcanoes – they not only cause havoc, destruction and global cooling, they also really mess up a good correlation.
Wow! A global temperature predictive model that really works (most of the time) with only ONE input variable.
Don’t tell the IPCC modellers – they’ll be really upset. I mean, they have models that require huge state-of-the-art computing power, and they still cannot predict anything with any accuracy. SO frustrating!
Regards, Allan 🙂
“one year ago my projection for December 2016 UAH-RSS average was 0.222C and the actual for UAH came in at 0.243C”
Again, proving the age old adage that you have a better than 50/50 chance predicting that tomorrow’s weather will be about the same as today’s?
Just checking.
“Globally, 2016 edged out 1998 by +0.02 C to become the warmest year in the 38-year satellite temperature record, according to Dr. John Christy, director of the Earth System Science Center at The University of Alabama in Huntsville. Because the margin of error is about 0.10 C, this would technically be a statistical tie”
Christy is correct the margin of error is 5 times bigger than the signal.
confidence?
1 sigma, 2 sigma?
higher? lower ?
“Inquiring minds want to know”
Christy is correct.
“Because the margin of error is about 0.10 C, this would technically be a statistical tie”
You cannot claim more accuracy than your margin of error.
This would be clear in any science other than the climate pseudoscience.
“this would technically be a statistical tie”
You misspelled “lie” Bryan.
What shall we do? Where will we hide? This menacing heat goblin is overtaking planet earth and has caused mayhem world-wide. It must get colder. It has to be colder. We must strive for COLD COLD COLDER!
Anyone who thinks the average temperature of this planet can be measured and reported in hundredths of a degree C., is either a fool, or a liar.
That is false precision — a logic fallacy.
I expect hundredths of a degree from the leftists.
Maybe thousandths of a degree in the future!
After all, it is a scientific fact that presenting more decimal places impresses laymen.
I don’t expect hundredths of a degree C. in an article TITLE from Mr. Watts, or from Mr. Christy.
A less misleading title (but still misleading) would be:
El Nino years — 2016 vs. 1998 — no temperature change in 18 years!
An honest title would have been:
2016 was warm from El Nino
An interesting comparison would be 1998 vs. 2016 excluding the El Nino peaks if that was possible
I know the body of the article says “statistical tie” — but it’s too late by then — some people never read more than the title.
There may be a claim that the satellite margin of error is +/- 0.1 degrees C., in spite of the fact that satellites do not directly measure temperature, nor do they place instruments at the surface of our planet where we want to measure.
I don’t believe +/- 0.1 degree C., at all, but let’s assume that is the real margin of error for now.
The average satellite temperature SHOULD NOT be reported in hundredths of a degree.
That’s bad math.
That’s bad science.
And I don’t care who is responsible for this — stop it!
We skeptics criticize the goobermint (NASA) for doing this with surface temperature data … and then we do the same thing with satellite data?
I know NASA (GISS) reports average temperature in hundredths of a degree C. … and also claims about a +/- 0.1 degree margin of error (which is laughable, since most of the Earth will have no surface measurements in a given month)
Even worse, the smarmy people compiling the surface data WANT to show warming, so they will always “round up”, in contrast to the satellite data compilers who (I believe) are trying to be good scientists.
But… reporting average temperature in hundredths of a degree,and claiming one year was 0.02 degrees C. warmer than another year … is stupid science ,,, and embarrassing to any skeptic who knows what margin of error means!.
Computer modelling
Last night’s local weather forecast (ALGORE-ithim) missed our high temperature by 10 F today.
Richard writes: “in spite of the fact that satellites do not directly measure temperature”.
Well, the truth is there’s no “direct” measure of temperature. You should lose this comment/argument; all measures of temperature are analogies. They’re “useful models” as Box would have it.
That said, it is bad math. It’s bad science. It’s very bad statistics. Bad all the way down. No help coming. Stupid and moronic.
Thank you for writing this.
If NOAA and NASA hadn’t significantly reduced the 1930s temps, 1934 and 1936 would remain the hottest years of the century.
Don:
So you approve of the practise of reading a max temp (and resetting the thermo) during the early evening?
Thereby ensuring that should the next day be cooler then the temp at time when reset the previous evening was recorded for the following day as well.
If so should we revert to that practise now? And elevate present day max temps by a similar amount?
It’s called “apple to apple” comparison.
And the reason you see such diff when the TOBS homogenisation was made.
The claim that they have accurately adjusted for TOBS is just another of the lies that are given to try and excuse the fact that we really don’t know what the Earth’s temperature was in years past.
The idea that you can tell what the average temperature for a day was by knowing the daily high and daily low is so stupid, that only someone with an alternative agenda would propose it.
MarkW says: “The idea that you can tell what the average temperature for a day was by knowing the daily high and daily low is so stupid”
…
Mark you don’t understand the definition of the term “average daily temperature”
..
Try learning the definition: http://w1.weather.gov/glossary/index.php?word=mean+daily+temperature
MarkW:
“The claim that they have accurately adjusted for TOBS is just another of the lies that are given to try and excuse the fact that we really don’t know what the Earth’s temperature was in years past.
The idea that you can tell what the average temperature for a day was by knowing the daily high and daily low is so stupid, that only someone with an alternative agenda would propose it.”
Ah.
And with one bound they were free.
Again.
Then try looking at Hadcrut.
And if they are in on the conspiracy….
How about the JMA?
Or are they too? (Sarc)
http://www.data.jma.go.jp/cpdinfo/temp/fig/an_jpn.png
Must make life oh so simple if one can just dismiss any and all evidence that naysays your ideological bias, even in the absence of basic logic and common sense.
By the appeal to conspiracy.
Toneb: You approve the practice of randomly changing data becuase you think it might be wrong? Were you standing next to the fellow who wrote down those temps in 1897? In North Dakota? In a snowstorm?
It’s made up BS Tone. We, who do this shit for a living, understand that.
It also makes a difference whether you go Jan-Jan, Feb to Feb, March to March etc.
People seem to be obsessed with 1/100 th’s of a degree.
Keep in mind that in 1998 we had just moved into the +AMO and Arctic sea ice extent was still very high. Now we are near the peak of the AMO’s effect. That is why you see almost all the warm areas in the Arctic. Warmer ocean water melts more ice which allows heat from the water to warm the air.
Looks to me like we are cooling outside of this climate noise.
The start of the satellite data was a relatively cold period in the instrumental record, or at least they thought it was at the time:
http://realclimatescience.com/wp-content/uploads/2016/04/Screenshot-2016-04-08-at-05.24.44-AM-down.png
Nice find, Chris Hanley!
What I would really like to find is the transcripts of congressional hearings and discussions involving the launching of the MSU satellites in the first place. I think there would be some very interesting bits in there from climate scientists of the day, such as how satellites are necessary because the surface temperature data is insufficient for climate science and climate modeling.
What do they mean by Change in the above graph? Difference from the mean, or difference from the previous year?
It’s a z-score Norm. Difference from the mean. I don’t know what they used as the mean in that example.
I had not yet worked my way down the comments when I posted the same plot in response to a comment above. I have posted this plot a number of times as it well depicts the fall in Northern Hemisphere temperatures since the highs of the late 1930s/early 1940s. It shows a fall of more than 0.6deg C. There were a number of papers published at around the same time suggesting similar, and NASA thought that the fall in temperatures (Northern Hemisphere) was in the order of 0.5degC
I often point this out when questioning whether we are today any warmer than we were in the late 1930s/1040s. IF this plot is correct, and IF there has been warming since the mid 1970s of about 0.5degC, it may well be that the Northern Hemisphere is now about the same temperature as was seen in the late 1930s/early 1940s. This is particularly material since it raises the prospect that during the time when about 95% of all manmade CO2 emissions took place, there has been no measurable warming (at any rate in the Northern hemisphere, and as we all know, we have little sampling of the Southern Hemisphere so no one knows what has happened there)
By way of further information, this plot was published in an article in an issue of Science News Volume 107. It was one of those articles (that are not meant to exist) on Global Cooling, headed “Climate Change Chilling Possibilities” by J Douglas
The sub heading was:
.
From the article:
Notice how in the article you quoted they state quite specifically that “COOLER climatic periods” drive more severe and extreme weather events like droughts and floods, and warm and cold temperature records. This is as expected logically, due to the greater temperature differential between the poles and the equator, which SHOULD increase extreme weather. Today, they try to sell us the nonsensical notion that warmer climate, with LESS temperature differential between the poles and the equator, will increase extreme weather events. Complete propaganda, and utter BS.
https://wattsupwiththat.com/2017/01/03/2016-edges-1998-as-warmest-year-in-satellite-record-by-0-02c/comment-page-1/#comment-2388877
The stratosphere is most interesting. If you compere the average for each year 2016 is the coldest on record and each year since 2006 the average is colder than the previous year. This is due to the sun’s influence.
…. because the sun causes the heat that is “being released by the oceans” maybe ?? (It sure as hell isn’t anything to do with CO2).
I’m not sure of the connection with the stratosphere, but willing to learn.
Actually it’s due to the increase in CO2 and decrease in O3.
In addition to El Nino, one contributing factor was reduced Arctic sea ice that was blown into the Atlantic when the Arctic Oscillation altered the direction of freezing winds, allowing more subsurface heat to ventilate.
I don’t believe it for a second. Month by month Australia was colder and wetter than any time in the last 30years, yet that somehow turns into warmer than average for the year.
At this point the reported temperatures have as much to do with reality as Santa Claus.
You mean you don’t believe in santa claus?!
Can’t argue with that. He’ll be telling us the tooth fairy doesn’t exist next. My kids know a silver dollar when they see one.
I wish I would see silver dollars as frequently as I did in Idaho during the 1950s.
In Spain, 2016 was for the main part a cool year.
Nearly daily, between Spring and Fall, I viewed the local weather via the Windows 10 weather App, and each day is was invariably 2 to 3 degC cooler than the average for the day in question. Indeed, my swimming pool struggled around 31degC, may be the high was 32 degC, but normally I would expect in July/August to see temperatures of 33 to 35degC. In years gone by, I would be disappointed if it did not reach 35degC in late July to mid August.
I would say that apart from a few weeks here and there, this year has been a cool year in Southern Spain.
But this is weather. It is not universally warm everywhere at the same time.
I frequently visit Spain including the Canary Islands. However I stopped visiting Southern Spain since a few years because the weather has become colder in May. Every year we moved the start date a bit further so we would be sure we had warm weather. Now we go to the Canary Islands so we can start holidays in May again. But still that’s no guarantee for warm weather. Actually funny that the settled science says it’s warmer every year but as a person I need to actually search for warm weather.
Arjan Weijdema on January 4, 2017 at 6:44 am
However I stopped visiting Southern Spain since a few years because the weather has become colder in May.
Where in Southern Spain did you spend your holidays?
Here is Moron de la Frontera in 2015:
http://fs5.directupload.net/images/170105/movzjcdj.jpg
and in 2011:
http://fs5.directupload.net/images/170105/i7pnizsh.jpg
2012 till 2014 were quite a bit cooler along some of the Mediterranean coasts.
Actually funny that the settled science says it’s warmer every year but as a person I need to actually search for warm weather.
You are right. Northern Atlantic’s atmospheric perturbation power has increased. In Eastern Germany, western wind dominance even in the winter was unknown 40 years ago.
I agree. Canberra has had a very cool year. Even this summer has rarely exceeded 30 C.
Poor soul living in Canberra!
I have noticed though that the local weather forecasters on the TV have been droning on about how the rainy days reaching a maximum of 25C are just, like, the worst thing ever for January and aren’t we all so unfortunate it’s so hot and humid!
Sydney, and the South Coast (NSW) had the warmest year on record.
Good sources there Nick, the BoM and ABC. Alarmist much?
Most of the Australia was above the long term average in 2016.
http://www.bom.gov.au/jsp/awap/temp/index.jsp?colour=colour&time=latest&step=0&map=maxanom&period=12month&area=nat
Are they greedy, conspiratorial extremists in seething hotbed of communist agent provocateurs or just balding computer geeks with bi-focals? YOU DECIDE!
“tony mcleod January 5, 2017 at 12:04 am”
1 device for every ~68,500 square kiliometers. You decide.
Patrick MJD on January 4, 2017 at 9:50 pm
Good sources there Nick, the BoM and ABC. Alarmist much?
Ten highest yearly temperature anomaly means for SYDNEY (AUS)
1. GHCN unadjusted V3, stations SYDNEY & SYDNEY AIRP (1880-2016)
2016 1.355
2013 1.129
2014 0.992
2015 0.809
2009 0.797
2005 0.692
2007 0.588
2004 0.501
2010 0.500
1988 0.422
2. UAH6.0 2.5° grid cells encompassing SYDNEY stations (1979-2016)
2016 0.676
1998 0.660
2014 0.657
2005 0.577
1999 0.500
2006 0.445
1979 0.411
2010 0.370
2011 0.361
2012 0.352
Patrick MJD on January 5, 2017 at 10:30 am
1 device for every ~68,500 square kiliometers. You decide.
http://fs5.directupload.net/images/170106/xaoqdus9.jpg
Linear trend estimates for 1979-2016, in °C / decade
– GHCN V3 unadjusted: 0.266 ± 0.028
– UAH6.0 AUS: 0.155 ± 0.025
It’s quite a bit warmer at the surface, but troposphere and surface are in good correlation, as show the 36 month running means.
Hey, Santa is real.
Globally, 2016 edged out 1998 by +0.02 C
the margin of error is about 0.10 C
But the +0.02 is not really a globally measured temperature.
It is a value established by regional observations.
Riddle me this?
Why aren’t the same notions that theorize how the MWP was regional applied to the current warming claims?
Especially with the advantage of having far more data?
That is really below the noise level but that would imply a global warming rate of roughly .01 degrees C per decade and hence .1 degrees C per century. So at the rate it would take 2,000 years for the globe to warm 2 degrees C. This climate change is less than has been observed during the Holocene for the past 10,000 years. There is clearly no evidence that CO2 is responsible.
One should see not only 1 month and the trend over all is about 0.12 K/ decade and there is no evidence that CO2 is NOT responsible!
Don’t ask us to prove C02 isn’t responsible for something that isn’t happening. You are demanding that we spend billions on your insane idea that CO2 has caused dangerous warming. You need to prove it first.
Hivemind: I do NOT demand anything! I also NOT said something about dangers. For the increasing of the global troposphere temperature by about 0.4 degC since 1980 it’s very likeley that the forcing moistly due to GHG is the cause.The mankind made giant proceedings during the last 200 years. The other side is: the GMST increased by about 0.9°C. In face of the great improvement of man’s life this is negligible. The society has to decide what to make of the fact that CO2 warms the world by an amount of about 1.3…1.4 °C per doubling of CO2
“For the increasing of the global troposphere temperature by about 0.4 degC since 1980 it’s very likely that the forcing mostly due to GHG is the cause.”
Why is it very likely? The warming from 1910 to 1940 was that much or more, and CO2 levels were lower then than today.
No! The data we are talking about shows a warming trend of roughly .1 degrees C per century. The AGW conjecture depends of the existance of a radiant greenhouse effect caused by LWIR absorption band activity of socalled greenhouse gases. Such a radiant greenhouse effect has not been observed in a real greenhouse, anywhere on Earth. or anywhere in the solar system for that matter. The AGW conjecture is hence fiction. If CO2 really affected climate then one would expect that the increase in CO2 over the past 30 years would have caused at least a measureable increase in the dry lapse rate in the troposphere but such has not happened.
willhaas says: “Such a radiant greenhouse effect has not been observed in a real greenhouse, anywhere on Earth.”
..
Here are two locations on Earth where it has been measured: http://www.nature.com/nature/journal/v519/n7543/full/nature14240.html
All they did is detect that CO2 maintains its IR absorption bands while in the atmosphere and it took them 10 years to accomplish it. They did not actually detect a radiant greenhouse effect. It turns out the atmophhere’s causing the surface of the Earth to be roughly 33 degrees C warmer than it would be without an atmosphere is all a result of gravity and the heat capacity of the atmosphere. In essence gravity retards cooling by convection and provides a convective greenhouse effect. The convective greenhouse effect as derived from first principals is responsible for all 33 degrees C. There is no more room for an additional radiant greenhouse effect. The so called greenhouse gases do not trap heat energy because they are LWIR radiators. All gases in the Earth’s atmosphere transfer heat energy via conduction and convection which dominates in the troposphere but it is the so called greenhouse gases that radiate energy to space much more efficiently than the non greenhouse gases.
“it’s very likeley that the forcing moistly due to GHG is the cause”
I got a kick out of “moistly”. I know it was a typo and I know English is your second language, but I couldn’t stop laughing. Sorry.
Aside from that, no, there’s no evidence CO2 is the cause. None. Anywhere.
And for Donald who cites Feldman? No. Feldman did measure radiance in a new and interesting way, it was absurdly expensive but it did independently confirm Keeling. It did not however confirm or even support a causal link. While Feldman was measuring radiance, the troposphere wasn’t warming. End of story. End of hypothesis. The very paper you cite rejects AGW.
willhaas
“Such a radiant greenhouse effect has not been observed in a real greenhouse, anywhere on Earth.”
Does that include H2O? Or any other gas? Or are referring just to CO2?
The lapse rate in the Earth’s atmosphere is a function of the pressure gradient and the heat capacity of the atmosphere and has nothing to do with the LWIR absorption properties of so called greenhouse gases. Contrary to the AGW conjecture, adding H2O to the atmosphere lowers the lapse rate which is a cooling effect as evidenced by the act that the wet lapse rate is significantly less than the dry lapse rate in the troposphere.
As mentioned, the UAH data just released for December indicates that strong Global Cooling is now underway.
We’re now at the level of “The Pause” again.
How low will we go?
Oh please – can’t WUWT at least use accurate headlines? If it was a statistical tie you cannot say 2016 was the warmest year. Such a statement is scientifically and mathematically WRONG. I expect more of WUWT.
“Oh please – can’t WUWT at least use accurate headlines? If it was a statistical tie you cannot say 2016 was the warmest year. Such a statement is scientifically and mathematically WRONG. I expect more of WUWT”
Can’t say for sure, but I think it’s stupid fkwit bait. Come on Griff, live up to your stellar reputation as a stupid fkwit troll …….
I asked earlier, “Why aren’t the same notions that theorize how the MWP was regional applied to the current warming claims?”
I went looking for an answer and stumbled across something interesting.
When it suited Skeptical Science to discount the sun as being responsible for the MWP…
https://skepticalscience.com/print.php?n=688
“Overall during the MWP, there was little change in TSI.”
vs.
When it suited Skeptical Science to blame the sun for the MWP………..
https://www.skepticalscience.com/medieval-warm-period.htm
“the Medieval Warm Period occurred during a time which had higher than average solar radiation”
From what I have gathered from googling graphs of TSI reconstruction the MWP and RWP appear to have similar TSIs.
If SS can play opposite sun positions when it suits them are they doing the same thing with the MWP being regional and the RWP not?
“When it suited Skeptical Science to discount the sun as being responsible for the MWP…”
It makes a difference if you quote it properly:
“Overall during the MWP, there was little change in TSI. However, it did increase approximately 0.2 W/m2 from in the years leading up to 1000 AD. This would correspond to a 0.04°C increase in global surface temperature, or perhaps as much as 0.05°C in land surface temperature, as reconstructed through proxy measurements like Figure 3. Thus TSI appears not to have played a particularly large role in the MWP, accounting for perhaps 10-20% of its peak warming.”
Quite different if you don’t chop it short. And not at all inconsistent.
Christy is correct.
“Because the margin of error is about 0.10 C, this would technically be a statistical tie”
You cannot claim more accuracy than your margin of error.
This would be clear in any science other than the climate pseudoscience.
If I handed in a lab report at university with a margin of error of a tenth of a degree yet claimed an accuracy to one hundredth a degree I would get an embarrassing fail
You cherry picked. The first SS link clearly diminishes the sun role and yet blames the sun for the MWP in the second link.
“It has now become clear to scientists that the Medieval Warm Period occurred during a time which had higher than average solar radiation and less volcanic activity (both resulting in warming).
However, you’re avoiding my central question.
Why aren’t the same notions that theorize how the MWP was regional applied to the current warming claims?
Given the selective malleability with using reconstructions to wash away MWP as global or hemispheric
the current warming with hard data is even easier to attribute to being regional or hemispheric events.
Why are their two standards?
Convenient flexibility with the MWP assumptions and then a far more rigid stance on the Recent Warming Period being global?
“You cherry picked.”
I cherry picked??? You chose the quote. I just showed what it said if you didn’t just pluck out one sentence.
Whew! Heat wave! 0.044F ‘hotter’ than 1998!
I turned my thermostat down 0.044F here, south of Seattle WA……. no point in using more natural gas or firewood than necessary!
It was 76F to 90F on the west shore of Kauai from Dec 20 to Dec 27, a week ago. The temp range here south of Seattle today was 18F to 32F. (sigh) I’ll never get the hang of this Global Warming thing….
I turned my thermostat down 0.044F here, south of Seattle WA
Oh dear, not another person who thinks that a thermostat controls heat output….:)
It can if it is a variable stage or modulating output unit.
Reblogged this on Climate Collections and commented:
2016, an El Niño year, edges 1998, another El Niño year by 0.02C as the warmest year in the satellite era. Dr. Roy Spencer calls it statistically insignificant. http://www.drroyspencer.com/2017/01/global-satellites-2016-not-statistically-warmer-than-1998/
RSS and UAH satellites show 2016 was nowhere near as warm as 2010 and 1998. See my website
http://scientificqa.blogspot.co.uk
Both UAH and RSS show 2010 and 1998 warmer. than 1998 Terri Jackson http;//scientificqa.blogspot.co.uk
Terri
On Tue, Jan 3, 2017 at 10:23 PM, Watts Up With That? wrote:
> Anthony Watts posted: “Global Temperature Report: December 2016 Global > climate trend since Nov. 16, 1978: +0.12 C per decade December temperatures > (preliminary) Global composite temp.: +0.24 C (about 0.43 degrees > Fahrenheit) above 30-year average for December. Norther” >
“Both UAH and RSS show 2010 and 1998 [I think you mean 2016] warmer. than 1998 Terri Jackson http;//scientificqa.blogspot.co.uk ”
Neither UAH or RSS show 2010 as being warmer than 1998. The only period in the satellite temperature record that is hotter than the hottest point of 1998, is Feb. 2016, when it was exceeded by one-tenth of a degree. The current temperature is below the 1998 high.
http://www.drroyspencer.com/wp-content/uploads/UAH_LT_1979_thru_December_2016_v6.jpg
When I studied physics we were taught not to leave hundredth digits in the result if margin of error was in tenth. How on earth do they speak of +0.61? It should be +0.6!
Yes and at my university too.
This whole discussion is like how many fairies can dance on a pin.
Likewise in earning my Chemistry degree. Moreover, I was required to lay out the entire mathematics of determining the final margin of error in the reported results. The type of error analysis (or lack thereof) I see offered regularly in climate studies would have resulted in the person being dropped from the chemistry program. In my day they would have become biology majors because at that time it consisted mostly of memorizing names of parts and was not as technically oriented as it is today.
Professional publications I regularly see error bars that exceed the stated precision, It comes from not throwing away data. So for example if I look up an atomic mass or the universal constant G I get something like: G=6.67408(31)x10^{-11} m^{3} kg^{-1} s^{-2}
That (31) is standard notation for error, and indicates that the estimated error bars on the last two digits listed are +/- 31. Listing only the thought to be correct digits would throw away the last two decimal places and lose data.
So – I look at that 78 to 2016 global monthly anomaly chart and it seems to me the right hand half of it is overwhelmingly warm anomalies….
As would be expected for the warm half of the PDO and AMO.
So, what would you expect from a general warming trend? Cooling?
It never ceases to amaze me the media crows “warmest (decade, year, month, day) ever!” as if it was a surprise. Doesn’t the paleo record pretty much tell us that, in general, temperatures have been rising for something like 10,000 years?
It would be a surprise if 2017 wasn’t warmer than 2016. A decade of cooling would likely return us to the “new ice age” scare of the 70’s.
Well no B. It’s been steadily dropping for thousands of years – since the holocene max.
http://southwind.com.au/wp-content/uploads/2013/03/286Marcott-Temp1.jpg
Given that overarching trend line and recent solar waning on top, you’d expect it would be cooling wouldn’t you? That would make a blue water Arctic later this year (it’s rarely been like that for 2.5 million years) a real black swan.
southwind.com.au/wp-content/uploads/2013/03/286Marcott-Temp1.jpg
No Tony, I wouldn’t expect it to be cooling, nor would I consider a “rapid” 0.5C rise in the past 100 years in any way significant.
You may ask “why?” Well, simply because over a longer millennial scale, the climate is still in a warming trend and the temporal resolution of climate records in that time frame would not detect an event that occurred over the course of 150 years.
So your “hockey stick” graph is a statistical artifact; the reult of improved instrument resolution, nothing more.
You know the irony of this entire fiasco Tony? Real scientists and engineers gave you these tools. Thermometers, satellites, rain gauges, CO2 detectors. Clocks. We did that. For you.
Now we get to watch while you use those tools to terrify the general population. If I could take them back from you I would.
Last but not least Tony, what did you really use to measure temperatures 5000 years ago? 10,000? 1000?
You have a fake science graph showing temperature in 0.1C resolution. Who do you think you’re fooling?
And you quote Marcotte. If he were dead he’d likely be spinning.
Tony, my old Dad had a saying, “Always engage your brain before engaging your mouth”.
Try it. It may come in useful? You have a fundamental measurement problem in your alarmist fantasies. The Thermometer was invented by some German dude back in the 1700’s. Got that part? You’ve got an instrument history that spans an entire 400 years and it’s only been reliable for the past 70 or so.
You know exactly didly about the Earth’s climate. Almost nothing. Call us all back when you have a clue.
you can google for the adjustments applied to RSS and UAH temp series…
There are quite a lot of them, but adjustments on the satellite temp data are OK, aren’t they?
Poor Griff, he’s still trying to convince himself that all adjustments are equal.
What happened to the great “Global temperatures have plummeted” everyone was celebrating last year despite the lack of evidence? Cold winters in the US? Arctic ice within normal limits? Antarctic expanding? Lack of wild weather?
Shome Mishtake Shurley ?
I thought everyone was convinced all these measurements and observations were a scam having been ‘adjusted’?
Are we now saying the world is indeed warming ?
Gareth wrote: “What happened to the great “Global temperatures have plummeted” everyone was celebrating last year despite the lack of evidence?”
Not sure what you are talking about. February 2016 was the hottest month in the satellite record, so I don’t think anyone was claiming global temperatures were plummeting last winter, at least I don’t recall anyone doing so.
Gareth: “Are we now saying the world is indeed warming ?”
Not me. I’m saying the world has been in a slight temperature downtrend since the 1930’s, which show to be 0.5C hotter than 1998 (or 2016) on Hansen’s 1999 chart. We didn’t break the downtrend in Feb 2016, the hottest month of 2016, and now the temperatures are falling well below that level. So, the downtrend continues, at least for now.
Gareth Phillips on January 4, 2017 at 4:27 am
Are we now saying the world is indeed warming ?
Certainly not when considering such an example! But well if we speak about some parts in the world, e.g. the latitude zones 80-82.5N or 80-82.5S.
Linear trends for the period 1997-2016
– 80-82.5S: 0.14 °C / decade
– 80-82.5N: 0.39 °C / decade
Source: UAH 2.5° grid dataset
Shome Mishtake Shurley ?
Don’t call me Shurley.
Of course it did! Just enough to get the headlines.
Hotest year evah!!!!
As if atmospheric temperature could be measured with the accuracy of 0.01 degrees centigrade when it ranges over 100 degrees globally at any point of time.
It’s a bit like measuring Bill Gate’s wealth in pennies.
I was about to raise the question of precision as a dumb question, so I’ll go ahead and do it anyway:
Does 0.02 degrees have any real meaning? … ARE the figures for global average temps. this precise?/b>
Now let’s argue over 0.002 degrees. Why stop with the measly hundredths decimal place? Let’s draw some alarming graphs with big scales representing a thousandth of a degree for every inch, so our trend lines angle sharply and [clear throat] catastrophically upward.
The smaller the mole hill, the bigger the mountain.
Get your HTML right, Kernodle !! grrrrrrrrrrrrrrrrrrrr !
Yes. And many learned people call this global temperature “climate.”
In a word no.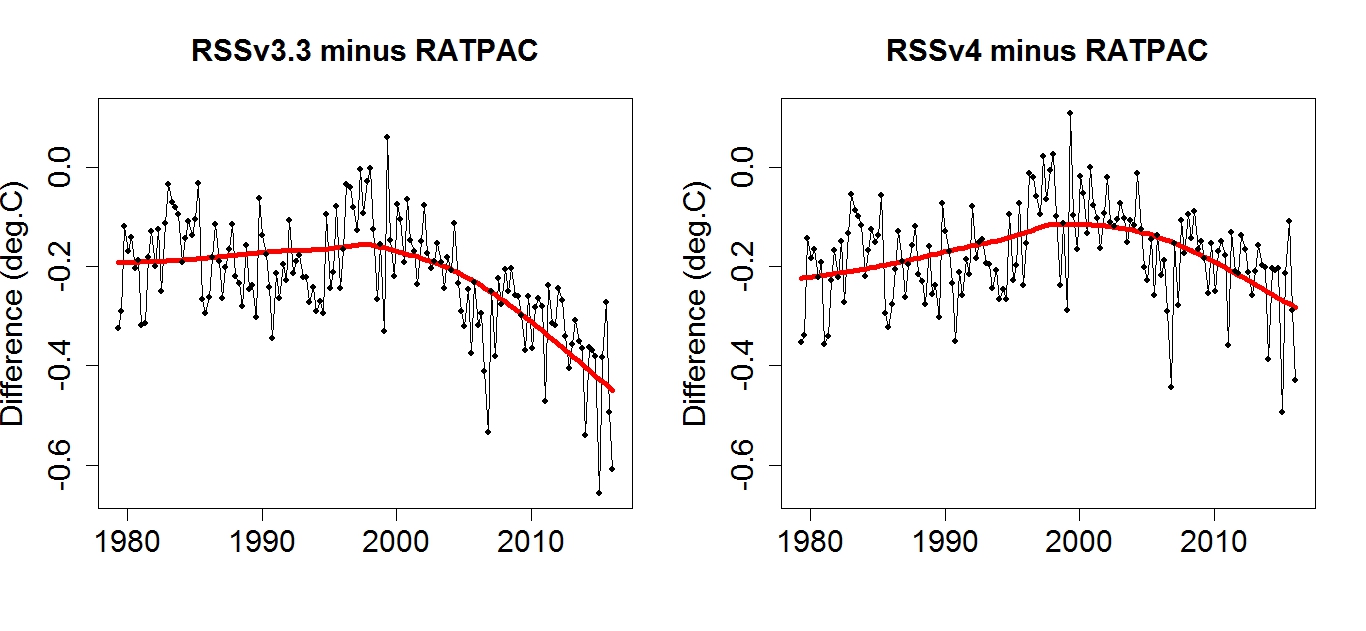
The MSU sensor aboard NOAA 14 was replaced in ’98 by an AMSU sensor aboard NOAA15.
That’s where problems arose and why RSS amended v3.3 up to v4.
Also the TLT produce was subject to sat drift errors.
RSS say that they don,t know which sensor is in error (MSU or AMSU) and so have split the error between the 2 …..
Whilst UAH maintain that as the AMSU is newer, it is more likely to be correct.
Yet it is running cold against the RATPAC radiosonde data.
RSS v3.3 was v close to UAH v6
But the RSS correct puts UAH as. Distant outlier…..
http://postmyimage.com/img2/995_Tropospheretrends.png
From: http://www.drroyspencer.com/2016/03/comments-on-new-rss-v4-pause-busting-global-temperature-dataset/
“While the title of their article implies that their new diurnal drift adjustment to the satellite data has caused the large increase in the global warming trend, it is actually their inclusion of what the evidence will suggest is a spurious warming (calibration drift) in the NOAA-14 MSU instrument that leads to most (maybe 2/3) of the change. I will provide more details of why we believe that satellite is to blame, below.”
From: http://www.remss.com/blog/RSS-TMT-updated
“In summary, we made a change to the dataset to reduce the intersatellite differences, particularly for the AMSU data. We applied the same method to all the data, including MSU and AMSU. We suspected that this would lead to more warming during the part of the NOAA-15 mission that underwent a large drift in measurement time, but did not know the result for the entire dataset.”
“We agree that there is a problem with either NOAA-14 or NOAA-15, or both. We explicitly discuss the problem with the NOAA-14/NOAA-15 overlap in the paper. We do not know if the problem is due to NOAA-14 or NOAA-15. If we assume that all the drift is due to NOAA-14, as Dr. Spencer would like us to do, we can eliminate the use of NOAA-14 after 1999 so that its (potentially erroneous) trend during the overlap period does not affect the overall results. If we do this, the overall trend is decreased by 0.019K/decade.
Using the current trends through February 2016, this would lead to a decrease from 0.133 to 0.114 K/decade. This adjusted number is still well above the trend in our previous versions, and also above the trends in UAH V6, UAH V5.6, or NOAA STAR V3.0.
There is no evidence that NOAA-14 drifts for time periods before 1998, because it agrees well with measurements made by other MSU satellites (NOAA-11 and NOAA-12) over the ocean, where the diurnal adjustment is not important. The drift would have to suddenly appear in 1998.
So we cannot assume that the problem is with NOAA-14. We instead explore
the 3 cases:
1. we assume NOAA-14 is wrong and remove it to the extent possible* This leads to a decrease of 0.019K/decade
2. we assume NOAA-15 is wrong, and remove it to the extent possible. This leads to an increase of 0.010 K/decade
3. we assume that the error is shared between them, and we keep all the data.”
Your Ratpacs and your Rich’s are just the warmist scientists trying to undo the satellite data and the work of 1000s before them.
Weather specialists have been putting up weather balloons and radiosondes for 70 years and they knew what the heck they were doing. They were not screwing around with the data they collected.
Then along comes a dedicated pro-global warming person on the public purse and he decides he is just going to rewrite all the hard work done by those 1000s of weather specialists over the years diligently trying to help weather forecasts be better.
The adjusters have no integrity and should be sanctioned in some manner for having no integrity.
“Your Ratpacs and your Rich’s are just the warmist scientists trying to undo the satellite data”
So what was the global average that these honest “weather specialists” compiled before Ratpac?
HadAT
http://hadobs.metoffice.com/hadat/
Versus the Ratpacs …
https://www.ncdc.noaa.gov/oa/climate/ratpac/
So after 7 months why have we not heard an update from RSS and why haven’t they published an update for the lower troposphere?
http://www.drroyspencer.com/2016/03/comments-on-new-rss-v4-pause-busting-global-temperature-dataset/
Bill:
You rather missed the point.
Read the comments made by both RSS and UAH.
There is a definite discontinuity at the point of switch from the MSU to the AMSU sensor.
Both teams know one of them is WRONG.
UAH chooses to go with the current AMSU.
RSS comes up with a “fudge” and splits the difference.
You don’t get to blame the hundreds of individual radiosondes as being wrong vs just the 2 sat sensors when it can plainly be seen that the change occurs at the swap-over of the TWO instruments.
Bill:
“Weather specialists have been putting up weather balloons and radiosondes for 70 years and they knew what the heck they were doing. They were not screwing around with the data they collected.”
Yes, I do know that … I was one of the very same for 32 years.
“Then along comes a dedicated pro-global warming person on the public purse and he decides he is just going to rewrite all the hard work done by those 1000s of weather specialists over the years diligently trying to help weather forecasts be better.”
Nope.
I know denizens are unable to divorce politics from science. You seem to think that anyone who advocates the consensus climate science is a “leftie”.
Correct?
Sorry, no.
I just, well, as I said – advocate the science.
Full stop.
Because as a Science/Met trained professional I know it to work.
Now that out of the way what else…
Ah yes ….
Indeed thanks for the complement.
I was on of those 1000’s of hard working weather specialists.
And more…
“The adjusters have no integrity and should be sanctioned in some manner for having no integrity.”
You are not talking to the cheering denizens with me.
That bizarre hand-waving accusation holds no truck.
Neither does it to anyone with an ounce of common sense.
You dismiss yourself as a credible debater instantly with that.
Bill Illis
“HadAT
http://hadobs.metoffice.com/hadat/
Versus the Ratpacs …
https://www.ncdc.noaa.gov/oa/climate/ratpac/“
Your HadAT link says:
Cautionary note
It is important to note that significant uncertainty exists in radiosonde datasets reflecting the large number of choices available to researchers in their construction and the many heterogeneities in the data. To this end we strongly recommend that users consider, in addition to HadAT, the use of one or more of the following products to ensure their research results are robust. Currently, other radiosonde products of climate quality available from other centres (clicking on links takes you to external organisations) for bona fide research purposes are:
<b<Radiosonde Atmospheric Temperature Products for Assessing Climate (RATPAC)
RAdiosonde OBservation COrrection using REanalyses (RAOBCORE) and Radiosonde Innovation Composite Homogenization (RICH)
IUK (Iterative Universal Kriging) Radiosonde Analysis Project
Bill Illis on January 4, 2017 at 9:45 am & January 4, 2017 at 10:55 am
Your Ratpacs and your Rich’s are just the warmist scientists trying to undo the satellite data and the work of 1000s before them.
Wow! Bindi says. What an arrogant spell!
Sorry, Bill Illis. One more time you give us a wonderful proof that you make good charts but don’t know much more than how to make good charts.
Unfortunately for you, I have all RATPAC B and HadAT2 data in the PC, and so you can see how wrong you are:
http://fs5.directupload.net/images/170104/7wuhiuvm.jpg
This is a chart comparing the two radiosonde datasets from 1958 till 2012 (end of HadAT2), at an atmospheric pressure of 700 hPa (I can show you any other pressure level).
BTW I remind you that you use, in your charts comparing HadAT2 with UAH6.0, a wrong HadAT2 dataset, namely that one which has been a posteriori harmonized with… satellite data; that means you don’t compare apples with apples, but… 1 with 1.
RWturner January 4, 2017 at 11:08 am
So after 7 months why have we not heard an update from RSS and why haven’t they published an update for the lower troposphere?
http://www.drroyspencer.com/2016/03/comments-on-new-rss-v4-pause-busting-global-temperature-dataset/
Same reason as UAH haven’t done so, they’ve both dropped that product.
None of you even clicked on the Ratpac link.
I purposely gave you a dead link because that is all the NCDC does.
They adjust the data and then make the old data disappear. They don’t even provide a following update link.
All the Ratpac data used to be completly different. then it got changed into Ratpac A and then a verision 2.0 and then 2.01 then 2.5 then 2.5.4 and then we moved onto another letter and we got a Ratpac B.
And then that was not good enough, we needed a Rich and then a Raobcore and then Raobcore B and people are working on version 3.2.1
And it just gets higher every time the NCDC or a climate scientist tries to adjust upwards a new more “accurate” version.
There is too much “conflict of interest” in this business. There is a reason the human race has so many rules against conflict of interest. Because humans sometimes take advantage of these situations. The human race needs lawa and police and courts because people sometimes do wrong things and the laws are needed to protect the rest of us from those wrongs. The NCDC needs a conflict of interest law and another objective entity to take over the data gathering function.
They need to split in two and one of those can be building the climate models and writing theory papers and giving interviews about ice-shelves calving off glaciers. And the other entity will be collecting the data and going to boring statistical math lectures – like the national statistical agencies do today.
What would the increase in global temp from 1998 to 2016 have been if the observations reflected the average projections of the CMIP-5 models? Don’t they show something like 0.288 degrees rise on that time frame? [reported to be 0.161 C / decade] 0.02 degrees is about 7% of that. Or to say it differently, we observe about 1/14th of what has been projected [going from one El Nino peak to the next].
Still waiting on error bars, something I don’t recall ever seeing with respect to climate. You can’t measure something without +/- something occurring during your calculations unless you choose to willfully ignore it. So what is it then? Up 0.02 +/- 0.05? I’d put a significant chunk of money on a bet that says the result is not statistically significant when measured and calculated properly.
https://wattsupwiththat.com/2016/04/19/systematic-error-in-climate-measurements-the-surface-air-temperature-record/
The people compiling the global instrumental record have neglected an experimental limit even more basic than systematic measurement error: the detection limits of their instruments. They have paid no attention to it.
Resolution limits and systematic measurement error produced by the instrument itself constitute lower limits of uncertainty. The scientists engaged in consensus climatology have neglected both of them.
It’s almost as though none of them have ever made a measurement or struggled with an instrument. There is no other rational explanation for that sort of negligence than a profound ignorance of experimental methods.
The rate and magnitude of temperature change since 1850 is literally unknowable. There is no support at all for any “unprecedented” in the surface air temperature record.
Claims of highest air temperature ever, based on even 0.5 C differences, are utterly insupportable and without any meaning.
All of the debates about highest air temperature are no better than theological arguments about the ineffable. They are, as William F. Buckley called them, “Tedious speculations about the inherently unknowable.”
There is no support in the temperature record for any emergency concerning climate. Except, perhaps an emergency in the apparent competence of AGW-consensus climate.
Maybe unsurprisingly, this was the exact issue that caused me to to reject the AGW “hypothesis” in 2003, nearly 15 years ago.
My background is measurement theory and statistics, design of experiments (I have an autographed copy of Box & Hunter. I was born a nerd). When I read Mann’s “Global-scale temperature patterns and climate forcing over the past six centuries” I almost tossed my cookies; I’d never encountered such trash in my entire professional career. For nearly a year I avoided being seen in public. Had I really supported that nonsense? I had. it was horribly embarrassing.
If you have the stomach for it, consider doing research into the uncertainties of dendrochronology. If that doesn’t ring your chimes, do some investigating of CO2 estimation using boron isotope decay in fossil foraminifera. Then there’s always gas migration in ice cores to consider.
The entire paleo record is rife with uncertainties that are never discussed. Then we come to the instrument record. How can anyone believe in measures from the 1800’s accurate and precise to 0.1C? Any takers on that? Old men wearing bifocals reading thermometers they got mail order from Sears in a snowstorm, in North Dakota, in February? Seriously?
And so we pass the peak of the Modern Warm Period.
Don’t be hasty. We haven’t been looking that long.
2016 warmest year eva, just more fake news. . .
Aside from world news (always depressing) my first port of call in the morning is WUWT. Thanks to all that post relevant information connected with the science. The politics are just yuk.
I trust the satellite and balloon data . The argo data will also become increasingly important over time. I most certainly don’t trust any data prior to 1960. It is useless IMO, unless you want to know temp within 3C. As for trends, I trust most the principles of nature, which I have both studied academically and observed through farming the same environment over 40 years.
We can expect a trend in climate over a millennium scale. This trend will be influenced by temporary events and noise. We see this in the rock record within my field, geology. The important mechanism to be aware of is feedback. Nothing works independently. Pull one strand in a spider web and all others are influenced. Likewise, we live in a giant thermostat. Buffering is going on the entire time to moderate the influence of temporary events: volcanic eruptions, El Niño e.t.c. But there is always a time lag, such that the event can be recorded. The point is that nothing spirals out of control and most events do not influence long term trend.
Nevertheless, there will always be a long term trend. Of most interest in the charts is the slight step-up to a plateau for 18 yrs after the 98 El Nino. My understanding is that Bob Tisdale is predicting a similar occurrence after this latest. My gut feeling is that he may be right. This mechanism (if it occurs) is a reflection of the long term trend i.e. gradual warming on a millennium scale.
On a much small scale, we have had a most unusual spring and early summer in New Zealand. There may have been a cooler seasonal period over the last 40 yrs but I cannot remember it. We farmers have historical diaries in our head. A local observation is the very slow growth of the maze crops this year. I was told by a grower many years ago that “a good crop is up to the top of the fence by Christmas”. New Zealand fences are of a standard height. I have driven past his crops every year while going to town, and every year that I can remember – he has got it spot on, except for this year. I checked it yesterday. 10 days after Christmas and the crop is still way short. There has been plenty of rain, but too darn cold.
The poor holiday campers are going home miserable.
‘2016 edges 1998 as warmest year in satellite record – by 0.02°C’
Which means ‘not at all’. Is anyone going to seriously claim they can measure the Earth’s global temperature over an entire year down to .02 degrees?
It’s worse then we thought. Mann has now made the climate constant.
Humour from the loony socialist Alberta NDP Party – yes Virginia, warmist idiots really do talk like this.
Warning to “climate changer deniers” everywhere – be very afraid! Nannie Rachel Notley will get you!
Best, Allan 🙂
NDP DEMANDS REMOVAL OF WILDROSE CRITIC OVER CLIMATE CHANGE ROW
By Emma Graney
First posted: Tuesday, January 03, 2017 08:30 PM MST
The NDP is calling for the removal of the Wildrose renewables and electricity critic, who insists the science of man-made climate change isn’t settled.
Don MacIntyre’s latest comments came Monday at a news conference about the new carbon tax, but the official Opposition says the Innisfail-Sylvan Lake MLA isn’t going anywhere.
MacIntyre doesn’t question climate change as such; ask him about it and he’ll tell you it’s a reality, but the climate has been changing since “this world was first spit out into orbit.”
He does question to what extent it’s being caused by humans.
On Tuesday, the NDP caucus issued a news release saying after a year of similar comments from MacIntyre, Wildrose Leader Brian Jean needs to put his foot down and remove the MLA from the renewables portfolio.
The official Opposition didn’t make anyone available for an interview Tuesday, but in an emailed statement, Wildrose caucus whip Jason Nixon said rather than calling for MacIntyre’s head, NDP backbenchers “should be more worried about getting rid of incompetent NDP ministers bringing in carbon taxes, making a mess of children’s services and tearing up confidence in Alberta’s economy.”
Leduc-Beaumont NDP MLA Shaye Anderson said Tuesday if an opposition critic is going to talk about something, “it would be appreciated if they had all the facts.”
“I’m not taking anything away from MLA MacIntyre — he’s done some incredible things in his career and he’s very smart man. His background is really quite interesting, that’s why it frustrates me even more,” Anderson said.
“This is an important issue, and if you’re not going to go on fact-based discussions, then maybe someone else can.”
And those discussions, Anderson said, shouldn’t be about scoring cheap political points.
“I want to make sure it’s not a partisan issue,” he said. “I think it’s something we could actually work on together, because solving climate change is a profitable opportunity for our industries we have here, our manufacturers, our energy companies.”
The term “climate change denier” became highly charged in the legislature last year after the NDP government repeatedly threw it at the Opposition.
On June 1, Speaker Robert Wanner cautioned MLAs to be more selective in bandying it around: “Clearly, it does on occasion create disorder.”
The next day he repeated his plea, after Premier Rachel Notley used the term in question period.
While some Wildrose MLAs have posted comments and links to anti-climate-change videos and articles online, they’re at odds with Jean, who said during the 2015 election: “Man-made climate change is real and we need to tackle it head-on.”
egraney@postmedia.com
Here in Australia the ABC are reporting 2016 4th hottest nationally, hottest year globally.
And then we have this;
http://www.smh.com.au/environment/climate-change/no-cooking-the-books-new-study-confirms-global-warming-hiatus-didnt-happen-20170104-gtlujo.html
So 0.02 deg C +/-? What are the error bounds?
+/- 0.1
ToneB ~ “And the difference is that sat temp data rely on ONE instrument.
Whereas the surface record relies on thousands of thermometers.
That do?”
Not really, I’m afraid. The satellite record has a correspondence to the radiosonde record of 0.98 and the radiosonde record is derived from tens of thousands of instruments ~ a different one for each flight. The satellite record is reliable. That do?
RWturner January 4, 2017 at 9:37 am
Then you show the RSS adjustments for v4.0 in an attempt to compare them to the changes occurring with 6.0 but don’t even grasp that the two graphs are measure two different things. RSS 4.0 has only been released for the mid-troposphere. RSS seems to be dragging their feet on the 4.0 LT interpretation, probably because they need to account for the differences in NOAA-14-MSU and NOAA-15-AMSU.
No, they measure the same things.
I suspect like UAH RSS will drop the TLT product because of the difficulty in dealing with the surface interference and the use of multiple angles.
Both RSS and UAH now use a Middle troposphere measurement corrected by the stratospheric measurement to remove the influence of stratospheric cooling in order to produce their new Lower troposphere data.
The two new products have peak weighting at 4km (2km higher than the previous TLTs) and have better coverage towards the poles.
RSS TTTv4 is comparable with UAH LTv6, neither is directly comparable with the previous TLT products.
The essential difference that remains is the way in which they deal with the drift associated with the shift from MSU to AMSU sensors.
Vimy100 on January 5, 2017 at 11:39 am
The satellite record has a correspondence to the radiosonde record of 0.98
Oh nooo! Don’t tell me you are naive enough to trust in this graph:
Because
1) it surprisingly ends… around 2005; and weren’t we in 2016 as the chart was published in this testimony?
HHRG-114-SY00-Wstate-ChristyJ-20160202.pdf
and
2) it is based on VIZ sondes, which aren’t longer in use since years. Deprecated material.
This was not John Christy’s first try to let us think about “correlations” between satellites and some “carefully selected” radiosondes:
http://journals.ametsoc.org/doi/full/10.1175/JTECH1937.1
Christy, J.R. and W.B. Norris, 2006: Satellite and VIZ-Radiosonde intercomparisons for diagnosis on non-climatic influences. J. Atmos. Oc. Tech., 23, 1181 – 1194.
Upon reading that paper I found an interesting list:
http://fs5.directupload.net/images/170107/pa3to22y.jpg
And after a second pass I found:
A compilation of the subsequently downloaded IGRA network dataset showed that the “Christy” radiosonde set in fact contained a rather small subset of the (127) IGRA radiosondes located in the USA.
Somewhat intrigated I generated out of the complete IGRA data two time series:
– one with those of the “Christy” set located in the USA (some are „US controlled“ but outside);
– one with the 127 US IGRA radiosondes
and in addition
– one of UAH6.0 (beta5 at that time).
Here is a chart with three plots to compare the time series from 1979 till 2016:
http://fs5.directupload.net/images/170107/ffnk4rq6.jpg
You easily see that Christy’s radiosonde choice has a trend even lower than UAH, whereas the 127 US based radiosondes have a much higher one.
Excellent correlation indeed!
Of course I didn’t follow all UAH map publications, but this is the first time I see at WUWT a map showing, for the UAH era, linear estimates for all grid cells between 82.5S and 82.5N: ?w=720&h=446
I just reviewed the entire thread, and I am surprised that nobody seems to have noticed the map, as no comment explicitely refers to it.
Unfortunately, using this globe map format, you see pretty good every detail near the equator but as you move near the poles, things get smaller and smaller and thus less visible. A possibility to rotate the map along the horizontal / vertical axes would be very helpful.
Nick Stokes‘ tool showing a Globe you can rotate interactively in any direction btw is nice as well:
https://s3-us-west-1.amazonaws.com/www.moyhu.org/maps/webgl/grid.html
*
We all can see, on the map shown above, that near the North Pole, UAH has computed trends above 0.4 °C / decade.
For me this is interesting, as it once more confirms that my interpretation of UAH’s grid data is correct. Here are linear trends I obtained for the two highest northern latitude zones:
From dec 1978 till nov 2016:
80.0N-82.5N: 0.42 ± 0.04
77.5N-80.0N: 0.35 ± 0.04
This is in real contrast with Antarctica:
80.0S-82.5S: 0.04 ± 0.05
77.5S-80.0S: 0.05 ± 0.05
But what Roy Spencer‘s map doesn’t show, as we can’t interactively modify the trend start date, is this:
From jan 1997 till nov 2016:
80.0N-82.5N: 0.39 ± 0.11
77.5N-80.0N: 0.32 ± 0.10
While the trends in the northernmost latitudes decreased, those in the southernmost ones increased:
80.0S-82.5S: 0.14 ± 0.13
77.5S-80.0S: 0.11 ± 0.12
This trend increasing at the South Pole is a bit surprising.
v’