From NASA/GODDARD SPACE FLIGHT CENTER and the ” sporadic and incomplete measurements, so let’s use an estimate” department.
See How Arctic Sea Ice Is Losing Its Bulwark Against Warming Summers
Arctic sea ice, the vast sheath of frozen seawater floating on the Arctic Ocean and its neighboring seas, has been hit with a double whammy over the past decades: as its extent shrunk, the oldest and thickest ice has either thinned or melted away, leaving the sea ice cap more vulnerable to the warming ocean and atmosphere.
“What we’ve seen over the years is that the older ice is disappearing,” said Walt Meier, a sea ice researcher at NASA’s Goddard Space Flight Center in Greenbelt, Maryland. “This older, thicker ice is like the bulwark of sea ice: a warm summer will melt all the young, thin ice away but it can’t completely get rid of the older ice. But this older ice is becoming weaker because there’s less of it and the remaining old ice is more broken up and thinner, so that bulwark is not as good as it used to be.”
Direct measurements of sea ice thickness are sporadic and incomplete across the Arctic, so scientists have developed estimates of sea ice age and tracked their evolution from 1984 to the present. Now, a new NASA visualization of the age of Arctic sea ice shows how sea ice has been growing and shrinking, spinning, melting in place and drifting out of the Arctic for the past three decades.
“Ice age is a good analog for ice thickness because basically, as ice gets older it gets thicker,” Meier said. “This is due to the ice generally growing more in the winter than it melts in the summer.”
In the early 2000s, scientists at the University of Colorado developed a way to monitor Arctic sea ice movement and the evolution of its age by using data from a variety of sources, but primarily satellite passive microwave instruments. These instruments gauge brightness temperature: a measure of the microwave energy emitted by sea ice that is influenced by the ice’s temperature, salinity, surface texture and the layer of snow on top of the sea ice. Each floe of sea ice has a characteristic brightness temperature, so the researchers developed an approach that would identify and track ice floes in successive passive microwave images as they moved across the Arctic. The system also uses information from drifting buoys as well as weather data.
“It’s like bookkeeping; we’re keeping track of sea ice as it moves around, up until it melts in place or leaves the Arctic,” said Meier, who is a collaborator of the group at the University of Colorado and the National Snow and Ice Data Center in Boulder, Colorado, the center that currently maintains the Arctic sea ice age data.
Ice in motion
Every year, sea ice forms in the winter and melts in the summer. The sea ice that survives the melt season thickens with each passing year: newly formed ice grows to about 3 to 7 feet of thickness during its first year, while multi-year ice (sea ice that has survived several melt seasons) is about 10 to 13 feet thick. The older and thicker ice is more resistant to melt and less likely to get pushed around by winds or broken up by waves or storms.
The motion of sea ice is not limited to its seasonal expansion and shrinkage: Except for coastal regions where sea ice is attached to the shore, the sea ice cap is in almost constant movement. The primary driver of sea ice movement in the Arctic is wind and there are two major features in the Arctic circulation: the Beaufort Gyre, a clockwise ice circulation that makes ice spin like a wheel in the Beaufort Sea, north of Alaska, and the Transpolar Drift Stream, which transports ice from Siberia’s coast toward the Fram Strait east of Greenland, where the ice exits the Arctic basin and melts in the warmer waters of the Atlantic Ocean.
“On a week-to-week basis, there are weather systems that come through, so the ice isn’t moving at a constant rate: sometimes the Beaufort Gyre reverses or breaks down for a couple weeks or so, the Transpolar Drift Stream shifts in its direction … but the overall pattern is this one,” Meier said. “Then the spring melt starts and the ice shrinks back, disappearing from the peripheral seas.”
The new animation shows two main bursts of thick ice loss: the first one, starting in 1989 and lasting a few years, was due to a switch in the Arctic Oscillation, an atmospheric circulation pattern, which shrunk the Beaufort Gyre and enhanced the Transpolar Drift Stream, flushing more sea ice than usual out of the Arctic. The second peak in ice loss started in the mid-2000s.
“Unlike in the 1980s, it’s not so much as ice being flushed out -though that’s still going on too,” Meier said. “What’s happening now more is that the old ice is melting within the Arctic Ocean during the summertime. One of the reasons is that the multiyear ice used to be a pretty consolidated ice pack and now we’re seeing relatively smaller chunks of old ice interspersed with younger ice. These isolated floes of thicker ice are much easier to melt.”
“We’ve lost most of the older ice: In the 1980s, multiyear ice made up 20 percent of the sea ice cover. Now it’s only about 3 percent,” Meier said. “The older ice was like the insurance policy of the Arctic sea ice pack: as we lose it, the likelihood for a largely ice-free summer in the Arctic increases.”
###
Omg! The bulwark is disappearing too?? It’s worse than we thought!!
Roy thanks for your assessment, I trust you.
Never mind the bulwarks !!
Note the language creep: IPCC consistently use the term “nearly ice free” to refer to “less than million km^2” of sea ice. Now Meiers is using “largely ice free” . Presumably that is a new, undefined term which will be flexibly adjusted in the future to fit prevailing conditions. Maybe the Arctic is “largely ice free” already.
Yeah, right, this is not actually news that Arctic sea ice has reduced since 1980 , so one wonders why they are harking back to taking a long view instead of looking at what has happened in the last decade with the current annual minimum being essentially identical to what is was in 2007 and more than it was in 2012.
Don’t mention the 45% increase in ice volume in one year which Cryosat2 measured in 2013. Maybe we don’t a bulwark anyway !
If we look at drift in the date the of turning point from melting to freezing each year there was a reversal after the 2007 OMG minimum.
https://judithcurry.com/2016/09/18/is-the-arctic-sea-ice-spiral-of-death-dead/
The main loss reduction is sea ice area happened from 1997-2007 since then rate of ice loss has slowed dramatically.
Maybe the “insurance policy” is that there is an apparent negative feedback from open water.
If the primary cause of melting were AGW then it would now be melting faster than it was during the 1997-2007 period. The reverse if the case. It’s now melting much slower.
Never mind the bulwarks !!
Greg, what happens to the slope of the blue post 2007 line if the data is brought up to date?
Arctic sea ice last ten years.
“Worse than we thought”, of course, is double-speak for…our models were wrong.
As I pointed out last month, back in the heyday of AGW alarm (2004/2005), regular September minimums of 3-5 mkm2 were not predicted to occur until about 2060 or so. The “endangerment” of polar bears was based on those dire predictions.
Yet, we’ve had those 3-5 mkm2 levels virtually every year since 2007 – and global polar bear population numbers did not crash. Extinction of polar bears is no more imminent now than it was in 2005 despite a decade of ice conditions not predicted until mid-century (which the USFWS predicted would result in the loss of 2/3 of the world’s polar bears).
https://polarbearscience.com/2016/09/13/recent-studies-show-sept-ice-of-3-5-mkm2-did-not-kill-polar-bears-off-as-predicted/
Maybe the strategy is to get folks to worry about the lost bulwark, in hopes they will forget the modellers’ failure on the ice predictions.
I doubt it, because I suspect few (if any) newscasters can say “bulwark” three times without looking puzzled.
“susanjcrockford October 30, 2016 at 2:39 am”
Susan, you might want to see what alarmists claim here in Australia.
http://www.smh.com.au/environment/climate-change/polar-heatwaves-have-ice-in-retreat-at-both-ends-of-the-planet-20161030-gse9q6.html
Has anyone got a picture of a bulwark ?
Sounds pretty darn scary to me. !
Searched on google.. and found this..
http://i.imgur.com/ULv5BE4.jpg
Ugly monsters, to be sure.
But check the feet. Cloven hoofs, diagnostic of a Demon From Hell of some variety or another.
No wonder the ice is melting.
Bulkwarks is an all inclusive term for the walls, ramparts, parapets and or other such massive permanent structures that served for the defense of castles and forts.
English translation of Martin Luther’s hymn, “adjusted” for the Church of CACCA:
A mighty fortress is our Mann,
a bulwark never failing;
our helper he amid the flood
of Deni’r ills prevailing.
For still our ancient foe
doth seek to work us woe;
his craft and power are great,
and armed with cruel hate,
on earth is not his equal.
Rah,
I do know that.. Was just having some fun with the “scary” words. 🙂
[youtube https://www.youtube.com/watch?v=r1kkKJK8l54&w=560&h=315%5D
bulwark in some parts of Britain is pronounced “bollock” which is exactly what it is in this case. 🙂
http://onlineslangdictionary.com/meaning-definition-of/bollocks
Cheers
Roger
http://www.rogerfromnewzealand.wordpress.com
Sorry, I left my caption off the video clip of the ‘muscular bull’. Being the first video clip I have posted, I wasn’t sure it would work.
The captions I thought of were:
A lot of bull!
A bull walk (bulwark).
Maybe it didn’t need my captions, so bright are the readers of this blog.
AndyG55
I figured you knew that but others here may not have. How many would know what a “loophole” is in the context of fortifications? I suspect more Brits and Europeans in general would know the answer than Americans because so many castles or their ruins still stand in the old country.
Dr. Spencer, getting extremely snarky? Does this mean I have to be serious now?
I will confess to getting snarkier with age.
LOL. As long as I can be my usual snarky self, it’s all good. I have found that when I have to be serious, it usually means I am either unhappy or about to be unhappy about something.
With some of BS you’ve had to put with on your blog, who can blame you?
Is it a cousin of the Narwhal
http://assets.worldwildlife.org/photos/5905/images/story_full_width/HI_232813_Paul_Nicklen_National_Geographic_Stock_WWF_Canada.jpg
I wonder just how much of the alleged change is due to changes in instrumentation. As all the estimates are indirect, changes in tools can produce purported changes in what is being measured.
Here is another scare story frohttp://www.perthnow.com.au/news/western-australia/wa-speaks-climate-change-to-hit-state-hard-west-australians-concerned-about-global-warming/news-story/f24aeaab0m WA:
Asybot, that was a stale reference, as it comes up as “page not found” from the Perth News.
After last winter, folks in Perth are really looking forward to some warming.
Not to mention all the ice breakers surging back and forth so that the eco-tourists can gap and gasp.
Currently seems to be a plethora of scary climate stories in Australian newspapers … surprised to see them carried by Murdock mastheads!
Tom Halla writes: changes in tools can produce purported changes in what is being measured.
Almost certainly Tom, and that’s the case for pretty much all of the alarming measures that have made headlines over the past 30 years. In 1979 I crewed a rare, possibly the first, aircraft equipped with a downward looking phased radar array NASA used to measure arctic ice thickness and extent. That was less than 40 years ago and it’s the beginning of the instrument record near as I can tell. Before that we had very rare ship logs, some data from the occasional submarine and sparse reports from arctic explorers on dogsleds.
The article erroneously suggests the vehicle has only been in use since 1984, in fact I was on that plane in 1979 when we moved it from Johnson Spaceflight to Ames Research. It may not have been used for university research missions until 1984, but it was around long before that. The data acquisition system, NERDAS (NASA Earth Resources Data Acquisition System) was my specialty. To this day I still have no idea why NASA was involved in measuring arctic sea ice. I know it wasn’t something I ever expected to be doing.
Until the satellites went up we had essentially nothing. So everything we see is “unprecedented” and that’s a true statement, but it has no real meaning.
Sorry, I used the wrong link, I guess I don’t understand how NASA’s website works. The link to the plane is here:
http://www.nasa.gov/mission_pages/icebridge/multimedia/sum13/C130-aircraft.html
It’s a C-130 they claim they acquired in 2013 that was previously a USAF property. It was previously USAF, but NASA had it well before 2013.
[snip – unnecessary comparison, I know Dr. Meier, and he’s nothing like that -Anthony]
every time it rains, a narwhal dies
iceberg lives matter.
don’t let Frosty die!
soon, children won’t know what ice is
think of the children!
excellent!
More theories to explain theories.
Why would less Arctic sea ice in summer be a problem? It’s good for maritime transportation.
Ringed seals, polar bears’ favored food during late winter and early spring, give birth to a single pup in snow lairs on ice floes or shorefast ice in March or April.
Polar bears don’t need summer ice to survive.
Who decided that the climate of AD 1850, 1900 or 1950 was ideal?
If alarmists want more Arctic sea ice, then why not bring back the climate of AD 1690? Or the Last Glacial Maximum, if humans have so much control over it.
“the likelihood for a largely ice-free summer in the Arctic increases.”
But it’s supposed to have been ice free every year for several years. Now the likelihood increases?
Can’t we just buy a new Arctic Sea Ice insurance policy for a few trillion dollars?
we must put a price on the pollutant H2O because negative externalities and dead black babies.
the earth is already drowning!
70% of our planet is under water. These are, of course, Gaia’s Tears. But the trend is increasing and it’s worse than we thought every single day!
97% of scientists and world leaders agree and are now calling upon the United Nations to coordinate pprogressive global policy needed to enact the hard changes we must. Failure to act puts civilization at risk of unprecedented business as usual.
An Intergovernmental Panel on Water Sequestration shall be formed to oversee the establishment of review boards to assess the development of protocols for implementation of precautionary principle requirements to commence this urgent action on this extremely vital matter.
On the national level, governments must establish a Water Credit Derivatives Futures Market as a Free Market solution to marketization of the negative externalities and to discourage water abuse.
They shall also produce a Document of Good Intent to outline their 5 yr plan to comply with the U.N. order and to establish ground, air and naval forces to ensure voluntary compliance.
All products that include dihydrogen monoxide or it’s compounds or derivatives shall be strictly regulated and phased out over a 5 year period.
At the local level, local funds may be used to establish dehydration centers for moisture addiction and halfway houses for rehabilitation of damp individuals recovering with dignity.
Pro actively, Sensitivity Training shall be administered to all public employees for the sake of inclusiveness and diversity in anticipation of a potential flood of new patients who self identify as gender 47 on the Stanford-Binet Assessment Profile.
Hate Speech Laws shall be reviewed to ensure the use of the W word to ensure it is used in a neutral fashion.
Thank god, finally a rational policy to solve this urgent problem!
Len and I, and others, have warned about the inestimable perils of oxygen dihydride for some years.
It is a major component of tea – and those who drink tea will, unquestionably, die.
At last, someone serious [not IPCC!] is taking this with a degree of seriousness.
Auto.
===
Mods – oxygen dihydride – /sarc.
Did that surprise you?
Elon Musk outlined his vision of solar powered ice farms filling the vast expanse of arctic tundra continously removing tons of deadly greenhouse moisture from the atmosphere..
Completely financed by water sequestration credits, a pilot plant north of Anchorage, consisting of several hectares of photovoltaic cells converting sun to cold by the Peltier effect, will provide local eskimos with green jobs and prosperity to a neglected minority.
Back in the big city, fish processing plants are being scrutinized for ways to prevent leaks and seepage of hydrogen hydroxide pollution that has imperiled the health of workers.
Bullwark?
Bulls#it more like.
Iceland is black. Black. No ice at all. Greenland is black. …
Among the darkest masses on Earth outside of a fresh lava field.
Walt Meier could certainly do better than this canard. Instead of playing the percentage game, why does he not talk about age? Where is the 50 y old ice Walt? Wanna bet it is gone forever?
Come on, if periodically older ice was not being replaced in its entirety, we should then find 50, 100 or 200 y old multiyear sea ice. It could be dated and then mapped: edge of 200 y old sea ice, edge of 100y old, 50 y old, 25 y old etc… Instead researchers consider multiyear ice as usually around 7 to 10 years old and lumped it into one color… suggesting that indeed, sea ice does not live very old… and thus replacement is a normal occurrence and that there is nothing nefarious about it.
The reality is that during periods of rapid mode of circulation, when the atmospheric dynamic is reinforced, even the “old” ice is being re-mobilized and ultimately replaced by more recent ice. Animations show this process occurring now very well and it is even discussed in the PR above. The high pressure summer anticyclones -low cloud coverage- and their associated deeper lows “Arctic summer cyclones” are proof of this renewed dynamic. So much for “global warming”…
This will continue until a slower mode of circulation sets in and the Arctic dynamic is reduced, sea ice then does not move as much and new ice can be accreted faster that it is mobilized, creating a stable multi year ice: anticyclones are less powerful and their associated storms much weakened under that scenario.
It is thus easy to understand what seems a paradox in Kinnard et al. 2011, a paper showing evidence that Arctic sea ice was LESS extended during the LIA than today.
This relationship between atmospheric dynamics and Arctic sea ice suggests indeed that the so called “canary in the coal mine” one liner used in the alarmist circles is quite misplaced if not a complete misreading of small amplitude Earth climate variations such as LIA, Medieval Optimum etc…
Yet Arctic sea ice was lower during the Holocene climatic optimum, and these guys found that its greater extent caused and sustained the LIA:
http://journals.ametsoc.org/doi/abs/10.1175/JCLI-D-12-00690.1
They model ice formation and transport, but based upon and checked by paleoclimatic proxy data.
Simulation… Kinnard is using sediment data to estimate the edge of sea ice.
As for the Holocene Optimum, we are not talking about small amplitude climate variations do we as we came out of a glaciation?
The Holocene Climatic Optimum, c. 8000 to 5000 ybp, was well after the LGM.
Thanks… usually maximum interglacial happens the day after LGM right? LOL
“Direct measurements of sea ice thickness are sporadic and incomplete across the Arctic, so scientists have developed estimates of sea ice age and tracked their evolution from 1984 to the present. Now, a new NASA visualization of the age of Arctic sea ice shows how sea ice has been growing and shrinking, spinning, melting in place and drifting out of the Arctic for the past three decades.
“Ice age is a good analog for ice thickness because basically, as ice gets older it gets thicker,” Meier said. “This is due to the ice generally growing more in the winter than it melts in the summer.”
In the early 2000s, scientists at the University of Colorado developed a way to monitor Arctic sea ice movement and the evolution of its age by using data from a variety of sources, but primarily satellite passive microwave instruments. These instruments gauge brightness temperature: a measure of the microwave energy emitted by sea ice that is influenced by the ice’s temperature, salinity, surface texture and the layer of snow on top of the sea ice. Each floe of sea ice has a characteristic brightness temperature, so the researchers developed an approach that would identify and track ice floes in successive passive microwave images as they moved across the Arctic. The system also uses information from drifting buoys as well as weather data.”
####################
Note the contrasts between DIRECT measurements of thickness ( which is actually going out on the ice and measuring) and INDIRECT methods using satellites.
its too funny that the author criticizes estimates made by satellites
And then hilarious that Roy Spencer comes on and says nothing.
[It’s also hilarious that Steve Mosher doesn’t seem to understand it is a Saturday night, now past 9PM on the East Coast, and Dr. Spencer doesn’t run on Mr. Mosher’s time schedule. If you think the estimates are accurate, and that microwave sounding can accurately divine ice thickness, then explain why, showing your data and code per your usual demands. Me, I retain the right to be skeptical of Dr. Meier’s work, as it’s still preliminary. Some ground truths proving they have the thickness right would go a long way. -Anthony]
Anthony,
When I was in the army, I was assigned to the Cold Regions Research and Engineering Laboratory in Hanover, NH, as a member of the Scientific and Engineering Personnel program. In April of 1967, my civilian supervisor and I went to Point Barrow (which has now been changed to a name I can’t pronounce). We set up empty 55-gallon oil drums on the sea ice to mark a flight path for a NASA overflight with a microwave imager. We took thermocouple measurements of the snow and ice temperatures. We also cored through the ice to obtain thicknesses. It seems to me it was around 8 or 9 feet thick, but don’t hold me to that after 50 years. The point is, while my supervisor has since died, hopefully, the lab archived the information and might be available to researchers. When the Photo Interpretation Research Division (where I was working) was moved to Ft. Belvoir, the information may have moved with the people. Jack Rinker and others have retired, so it is more problematic as to whether the information can be retrieved readily. However, the truth is out there, somewhere.
Clyde, I think it’s remarkable these data have been “lost” somehow. I was involved a few years later doing those overflights you mention, but this article claims we don’t have any instrument data before 1984. I have a lot of trouble with that and my ex-wife s likely trying to figure out where I really was all that time I told her I was flying planes over the arctic…
“In the early 2000s,”
Ahhh so only 16 or so years , on the upward cycle of the AMO.
You are trying to see us a LEMON, yet again, Mosh !!
When the presentation starts with language like “double whammy” we can pretty sure what to expect : a load of bulwarks !
i thought a load of bulls**t but maybe bullwark is the censored version of it?
“[It’s also hilarious that Steve Mosher doesn’t seem to understand it is a Saturday night, now past 9PM on the East Coast, and Dr. Spencer doesn’t run on Mr. Mosher’s time schedule. If you think the estimates are accurate, and that microwave sounding can accurately divine ice thickness, then explain why, showing your data and code per your usual demands. Me, I retain the right to be skeptical of Dr. Meier’s work, as it’s still preliminary. Some ground truths proving they have the thickness right would go a long way. -Anthony]
You utterly miss the point.
1. You pick and choose which records and which methods to trust based on the answer you see.
2. You have no problem “trusting” the Estimation of Air temperature using microwaves, but
here you belittle estimates without EVEN LOOKING AT THE METHODS.
You just cry “estimate” and think that is an argument. Here is a clue, EVERY measurement is an estimate. Every measurement depends upon a device that has been built based on theory. Every measurement comes with error, just as every “estimate” comes with error.
3. YOU made the claim or insinuation that the estimates are not accurate. The ball would be in YOUR COURT not mine.
4. I merely note that in some cases you whine about estimates ( when you dont like the answer ) and in other cases you swallow estimates ( like UAH ) without question or any due diligence.
My comment is Not about the ice,
My comment is about the inconsistent and rhapsodic acceptance/ rejection of science without due diligence.
If you hear the word Model and like the answer, you keep quiet
if you hear the word Model and dont like the answer you say “its a model”
If you hear the word estimate and like the answer (UAH) you keep quiet
if you hear the word estimate and dont like answer you say “Its an estimate!”
If you hear the word adjustment and like the answer ( UAH ) you keep quiet
if you hear the word adjustment and dont like the answer, you say “Its adjusted!!”
That is my observation. Not about the ice per se, but rather about the knee jerk insinuations.
[Reply by Anthony: I can look at some of the ways you comment here on WUWT, about when you “keep quiet” on things you like vs. when you rattle off “poorly supported drive by comments” on things you don’t. What I can tell you is that your own bias is at work here, because you don’t know what I think about models and estimates and adjustments in a firm way, you are only going by your impressions, which are often emotionally based.
That said, your strong opinions on the subject reinforce with me something I have been intending to do: publish a statement on my EXACT position on climate change and the pieces of the puzzle that go with it. By not doing so, people such as yourself who have a specific world-view create their own view of my position, then tout it as factual. That’s my own fault for not doing this sooner. WUWT’s 10 year anniversary is coming up very soon. So, it is a good time to publish my exact opinion so that you and others won’t be able to speculate about it. – Anthony]
Steve, what’s really funny (funny peculiar not funny ha ha) is that NASA claims they don’t have data before 1984. It’s not a long time, but if they can’t figure out where it is or how long they’ve been doing it, it does detract from their credibility.
Could someone please explain the physics behind WHY older ice melts at a different rate than ‘new’ ice? It seems logical to me that a Kg of ‘old’ ice in a given environment would be expected to melt at exactly the same rate as a similarly configured (ie compressed/shaped/dense) KG of ‘new’ ice.
Now it is obvious that newer ice will be on top of old ice (in general) because it is deposited from the air later – assuming it is all snow/rain water that it forms from. Thus, when a warm wind blows the top ice melts first and the lower parts might never melt in the first year (that is why it is called ‘OLD ice! – duh). Some melting from the bottom – the ‘old’ ice? – is also expected when the water currents/salinity are warm enough to do that. [Yes, I realize that sea ice can grow to be quite thick when nothing more than extreme cold air is available to freeze the seawater and the heat transfer is through many feet of ice to the freezing interface].
It seems to me that someone is trying to make a distinction without a difference.
Density? older ice is more compact? Just a guess, cant see any other reason, oh and that older ice has never ice around it?
You’re not supposed to understand it even when it defies logic (and physics).. You just have to accept it. After all, it is climate “science”.
The older the ice, the less salt and the more air pockets. Hummocks of multiyear ice are fresh enough to drink, as the Eskimos used to do. Might still do so, for all I know. Except of course, it’s disappearing! And with it, the world!
precisely. A lot of salt gets pushed out initially, then the salinity gradually decreases over time.
The ice structure becomes more uniform and less liable to fracture.
Is it just me or why does a body with the words “space flight” in its name spend time examining “sea ice”. Can anyone explain how this came about?
Chris in oz commented: “…Is it just me or why does a body with the words “space flight” in its name spend time examining “sea ice”. Can anyone explain how this came about?…”
Easy peasy. For the same reason they were asked to be more relevant to a specific religious group…..Obama has required every government or quasi government agency to support the AGW narrative.
NASA GISS’ whole rice bowl is now CACCA.
Chris, it’s an excellent question, one I’ve struggled with for nearly 40 years. As I mentioned above, I was on those early flights and responsible in part for some of the instrumentation. I’ve spent time hanging my ass over the arctic void, literally since the 130 has rear clamshell cargo doors we opened in flight to deploy the downward looking array.
This isn’t NASA’s job or charter; it belongs to NOAA. NASA is the right organization to b flying those instruments, but GISS isn’t the right place to be doing the research, designing the instruments, collecting, analyzing and reporting the data. That job belongs to NOAA.
NASA has always been the agency responsible for getting the experiments and instruments aloft, its our charter. Doing arctic ice measurement isn’t and that stuff needs to stop because it’s eaten into NASA’s spaceflight budget to the tune of about $2 billion this past year. It’s a gross misappropriation of funds perpetrated by none other than the Executive branch of our government.
So how on earth did the Laurentian Ice sheet ever melt?
Were not some of its component ice 100,000 years old?
Once Meier explains that discrepancy I am sure he will rush to ban the ice disruption caused by ice breaker activity in the Arctic.
Save the Climate Caterwaller.
They always leave out the icebreakers ‘researching’ (ie smashing up) the Arctic ice. More than 100 icebreaker trips to the pole have occurred since 1977. Not to mention the even more numerous trips that weren’t going to the pole.
Meier says:
The older and thicker ice is more resistant to melt and less likely to get pushed around by winds or broken up by waves or storms.
so he obviously knows that breaking up the ice causes it to melt more quickly.
Let’s have a 10 year moratorium on mashing up the Arctic ice with icebreakers to find out if it makes a significant difference. There are other ways to the pole, by air for example.
If NSIDC were concerned about the ice they would be promoting the reduction of ice breaker activity, not contributing to it.
A few hundred trips in 5 million sq kms over 30 years? That’s not the problem.
“scientists have developed ESTIMATES of sea ice age and tracked their evolution from 1984 to the present”
More modeling that must be accepted as fact and not questioned. I’m sorry but my faith in modeling can’t be measured with a thimble. The thimble is just too large.
I’m not sure I understand. Are they saying that older, thicker ice is being selectively targeted by global warming leaving only the thinner, younger ice behind?
I love this, “Every year, sea ice forms in the winter and melts in the summer.” I can just imagine Roy Spencer digging through his notes and exclaiming “citation needed!!” only joking
What did they do? Go out and count ice ring circles?
If so, I want to see their core samples.
They should announce that old ice is a species. Once it is gone it’s lost forever. Then we can all hang our heads as if we were at a funeral.
Is older ice colder for some reason? More experienced at being ice or something? Is that why its preferable over new ice??
I’ve always thought this was a silly argument: if I have the same amount of ice in year X as in year Y, but year Y had older ice, the effects should be the same.
Salinity. A lot of salt is expelled initially, but it continues to be squeezed out over time.
A more uniform structure means less liability to fracture, which means less total surface area exposed to melting..
It’s an ageism thing.
Old ice must be revered.
“It’s an ageism thing.”
Waiting for the far left Politically Correct brigade to add that to the list of things we aren’t allowed to say !!
Oh wait, most of them have 12 year old brains !!!
AndyG55 … did you hear the one about the live brain trade? Well, apparently Lefty brains are highly prized as they have so little use!
Dear NASA, while this is a good start, I fear it does not quite make the point well enough. Please use my tax money to make a a more realistic video based on models that shows the ice spinning, shrinking, and bursting into flames. Some CGI of skinny polar bears exploding might help too, but don’t add too many. I wouldn’t want people to think this was just all a bunch of fake bullshit.
Regards,
Mike
What a great series of images put forward from NASA. I presume the images are at Arctic ice minimum.
I personally I think the people at NASA do a great job and my communications with various folk are just a delight to deal with. Don’t mix politics with fantastically talented and well meaning people. If you don’t like the official interpretation, then I am always happy to read any other commentary on the reason why the ice is acting in the current manner.
After long time study encompassing many other interlocked actions, atmospheric transport is the cause of the reduction and variation. By looking at each image by stopping and starting the video you can see from what direction the atmosphere is coming from. Sometimes it comes from the Atlantic, then the Pacific, then both then across Eurasia. The highest ice density is always opposite the direction of the transport. I know I am stating the obvious, but it needs to be said. It is the atmospheric transport that causes the temperature movements. Sea surface temperatures will act to potentially weaken the ice but it is the wind that moves and breaks it up. The movements up and down of area are the telling point. The same occurs during the winter maximum. Its the atmospheric transport continually moving into the Arctic low pressure area. Look at the CO2 charts for the high latitude surface stations from Ireland to Cold Bay Alaska, and they all go flat during December to February (inclusive). No accumulation during human peak emissions, just continuous well mixed transport, These two stations are on the transport pathways into the Arctic.
If you go looking in the Arctic for the reasons for sea ice variations you will be disappointed. The source or cause is no where near the Arctic. It is not caused by CO2, it is simply progressive changes in atmospheric circulation since 1996. I will stop there.
Why atmosphere and oceans? We know the AMO went positive right around 1996 and we know water will melt ice much quicker than the air.
The overwhelming majority of the energy entering the Arctic is via the atmosphere, about 97%.
http://www.colorado.edu/geography/class_homepages/geog_5241_f09/media/Class_Notes/week_2.pdf
Well we’re human beings, we can adapt. Since there is a growing excess of ice in the Antarctic, we can just break off some really big ice bergs and tow them to the Arctic. That way we can keep the Arctic so frigid that almost nothing lives there. Yes, we can keep the Arctic good for nothing! Now I know what everyone is going to say, the tropics are really warm, the ice will melt en route. But I’ve figured out how to deal with that. We’ll go in winter.
And move it at night to reduce melting by the sun.
you’ll find this year there are near record low levels of Antarctic sea ice…
http://www.smh.com.au/environment/climate-change/polar-heatwaves-have-ice-in-retreat-at-both-ends-of-the-planet-20161030-gse9q6.html
Meier stated:
“What’s happening now more is that the old ice is melting within the Arctic Ocean during the summertime. One of the reasons is that the multiyear ice used to be a pretty consolidated ice pack and now we’re seeing relatively smaller chunks of old ice interspersed with younger ice. These isolated floes of thicker ice are much easier to melt.”
Notice he says nothing about the cause other than the ice is easier to melt. I have no problem with his statement. The ice is easier to melt by the warmer waters carried to the Arctic by the positive AMO. Less ice then allows the atmosphere to be warmed as well.
AGW alarmists jump on these warmer temperatures and claim they are due to our emissions. At least Meier did not resort to this deception.
They modelled it.
So we can expect those models to be proven wrong in the near future.
Bulwark Synonym for tipping point..
Just like Walt Meier, I much prefer old ice with my whisky. It has a far more wholesome taste. I have been toying with the idea of getting a research grant to determine why the old ice has a more wholesome taste than new ice.
That’s fair dinkum.
Along with some Japanese tourists, I once savored 40,000 year old ice in my whisky. I tried to be objective, but obviously that’s impossible.
Old air released from pockets in the ice, redolent of decaying mammoth flesh seemed to me to have a je ne sais quoi fragrance which enhanced the experience and released the chemicals in the scotch.
http://sites.uci.edu/zlabe/files/2016/10/sit_PIOMAS_mask.gif
UC Irvine – Earth System Science Ph.D. Student
Cornell University – Atmospheric Sciences B.Sc.
Twitter: @ZLabe
Website: http://sites.uci.edu/zlabe/
Yes, we know that 1979 was an EXTREME, up there with the LIA
Pity this little phttt student didn’t do more research about Arctic sea ice levels prior to the LIA, especially prior to the Neoglaciation period. But not paid to do that, is he/she!
Imagine the MASSIVE benefits to having open Arctic sea lane for at least some part of the year !!!
True. The year 1979 was at or near the Arctic sea ice high for the previous century. IPCC doesn’t show the satellite data from the 1960s and ’70s obtained from unspecialized imagery. Not to mention sea ice maps from earlier in the 20th century.
Icelandic Sea ice index tells a story.
oopsie…. forgot the pic…. nice Semillon, bottle all gone (with some very nice Tassie salmon etc )
Oh yeah, real turning point at 1979. Damn cherry pickers.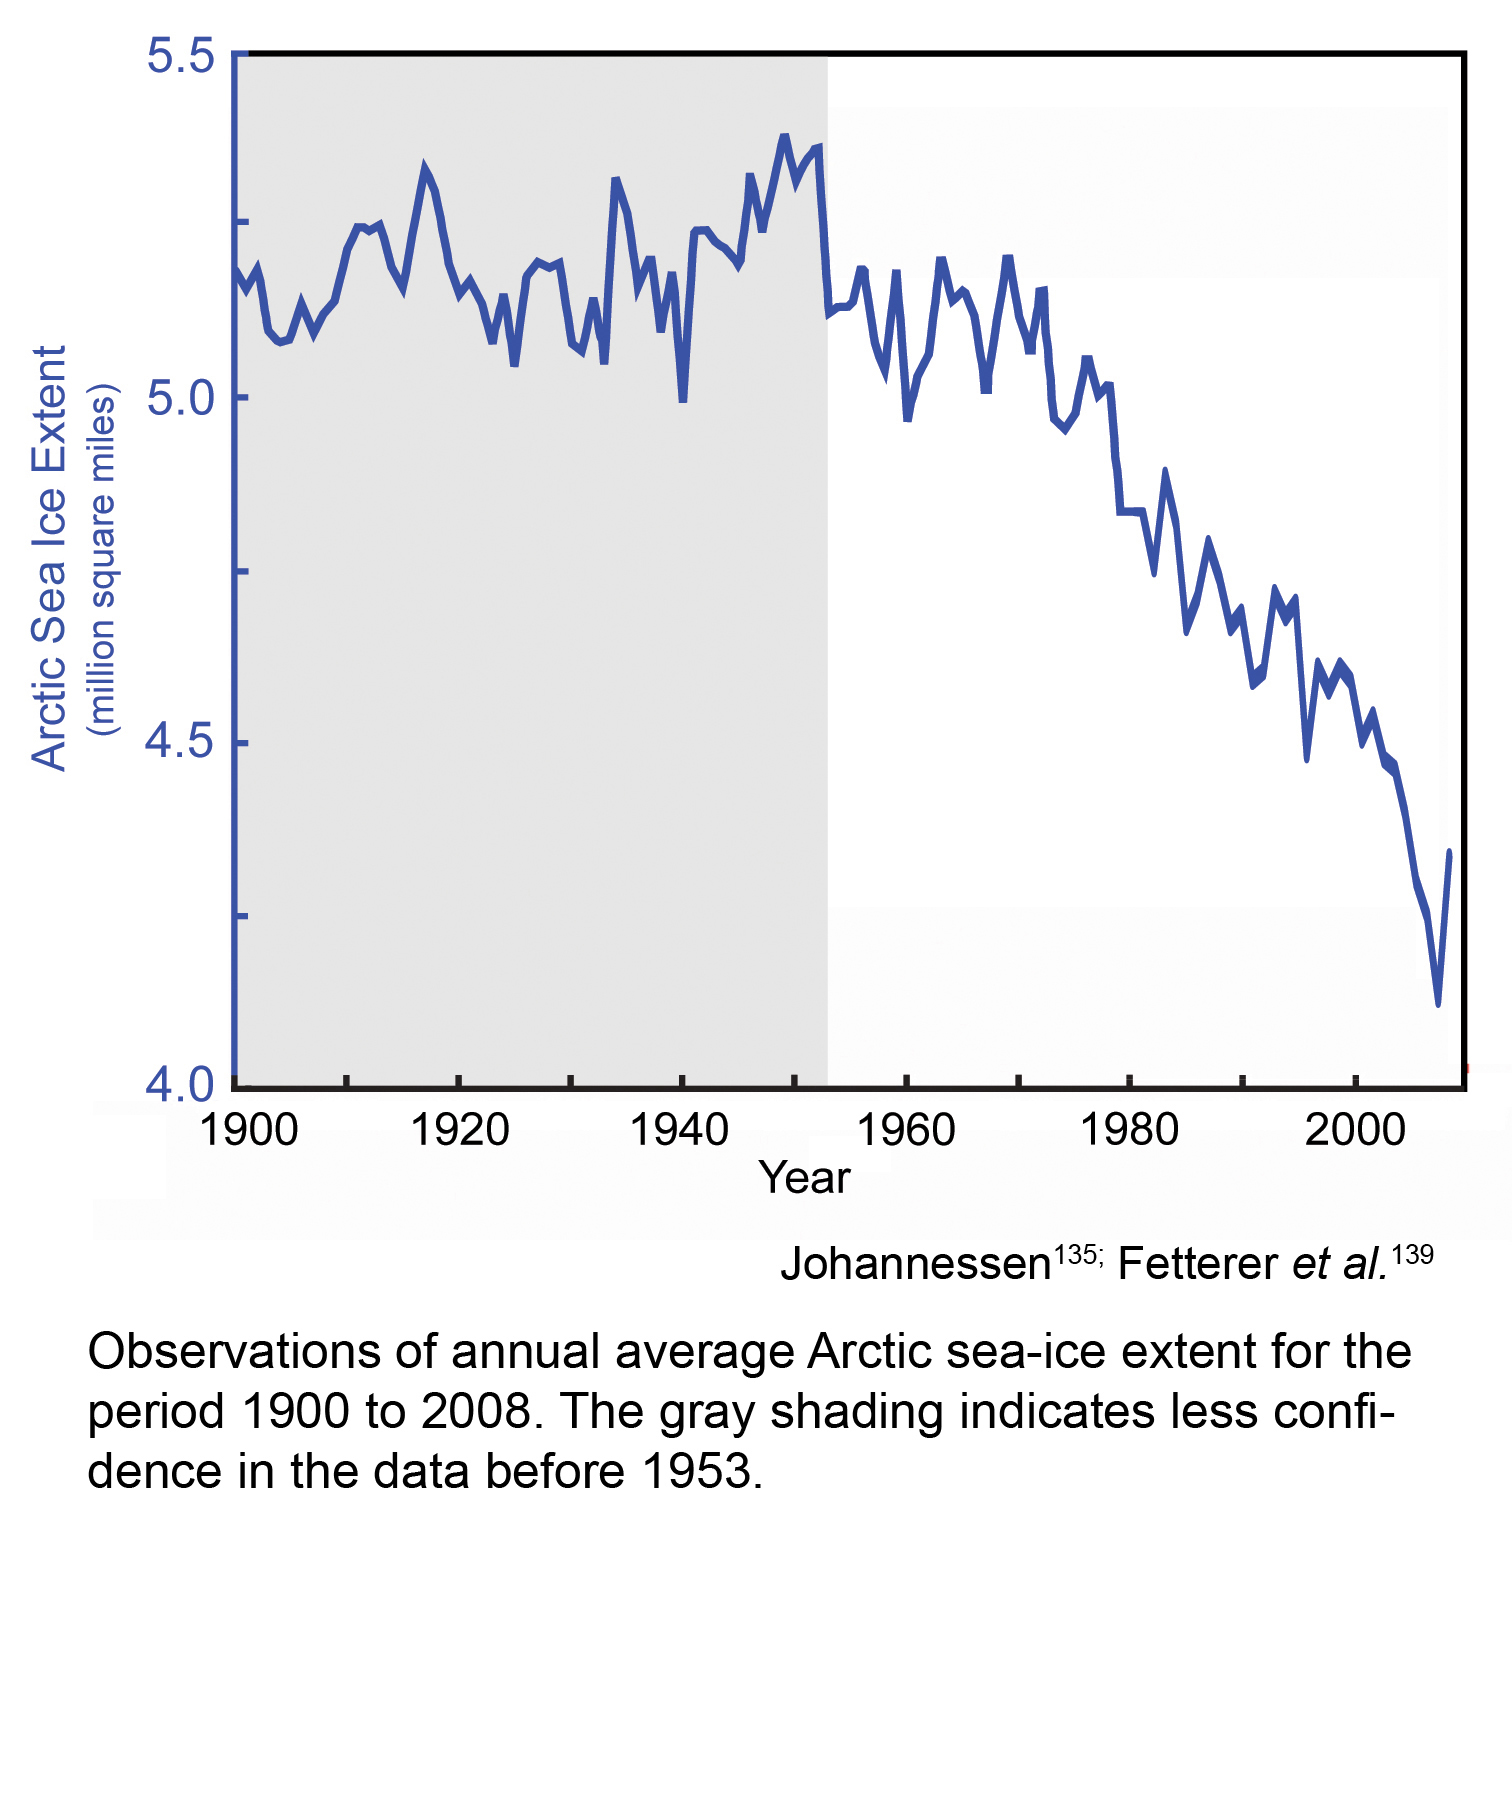
Previous to 1970’s is a load of BULWARKS. A modelled fabrication.
Look at the actual data from Iceland, and forget the Bulwarks from whoever was paid to FABRICATED that graph.
Fetterer, is at NSIDC with Serreze.. climate troughers unanimous !!
No paid bias there… none whatsoever. !!
The very fact that they say “observations” of annual average sea ice from 1900 – blah blah….
immediately tells you it is a LOAD OF HOGWASH. !
Observations DON’T EXIST !!
And where they do, as in the Icelandic sea ice index, they counter the fabrication you have posted.
Global temperatures were warmer in the 1940’s and 1950’s than the 1970’s. The station instruments covering the Arctic also showed this, so how do warmer temperatures cause more sea ice? Blatantly obvious that the Arctic sea ice graph pre 1970’s is a load nonsense and not actually from observations.
thanks tony , looks pretty bad huh? So what is it showing?
A beautiful example of how “earth science” PhDs can be so deliberately misleading in the way they present data.
First note that this is model output NOT data. He picks out the month of August so as to get the most dramatic changes but it still looks pretty bad. It looks like the Arctic “nearly ice free” by 2016 doesn’t it? Why won’t all the deniers accept the reality of what is happening?
Now look at the colour scale. Black has been chose represent 1.5m or less of ice cover. It’s the same as open water!
Why? Doesn’t ice of 1.5m “count”?
Someone from the National Hurricane Centre was recently deploring the lack of trust people have in scientists. This kind of thing is the reason why. Graphic effects being use to mislead the viewer. You need certain amount of scientific training and a familarity with graphs and data to spot the “tricks” being employed to fool the layman.
Frankly : a load of bulwarks
Nice BS graphic. Anything less then 1.5m of ice gets coloured black like it has disappeared. Odd that.
Good enough for seals to haul out on; good enough polar bears to hunt baby seals on; good enough Inuits to drive their show mobiles on and cut holes to go fishing …
Apparently not regarded as significant for “PhD student” ZLabe.
science by Tweet is NOT science, it’s political activism.
Are you blind?
Are you drunk ?
It is a shocking sea ice volume graph excluding 1.5m or less volume ice. Everything expected in a person supporting propaganda not science.
Shall I bother to include a global temperature graph missing any warming by 1 c to make it as equally awful as this one?
No, I won’t because it would be a waist of time.
You guys will absolutely love this one. BTW, ’15 is low and ’16 is falling of the cliff.
Walt Meier announces, publishes or releases his claim that older thicker ice is declining; without actually posting any factual information.
Dr. Meier continues on mixing in just enough reality to make his overall claim plausible.
Only that animation at the end, is exactly what it is titled. An animation, powered by some model.
If that is the reason so many polar adventurers are trying to measure ice thickness in the Arctic?
For what purpose is Dr. Meier out showing models while making more claims about polar ice loss? If Meier is half the polar ice scientist he believes himself to be, he should be studying why the polar region ice cycles are in opposition. Just as they are on many other of our Solar System’s planets.
This kind of nonsense, coming from Dr. Meier gives one pause; enough loss of reality in Dr. Meier’s presentations, causes readers and followers of Arctic/Antarctic science to be concerned about Walt’s ability to accept scientific reality.
The supposed loss of albedo due to summer sea-ice decrease has been at least partly compensated by the increase in cloud albedo due to evaporation:
http://www.pmel.noaa.gov/arctic-zone/detect/detection-images/climate-cloud-mamseries.jpg
Any loss of albedo from Arctic sea ice has been compensated for many times over by increase of Antarctic sea ice at lower latitudes.
The gain in Antarctic sea ice is about five times as albedo positive as any presumed loss in Arctic sea ice, not only from extent but because of the angle of the sun at the lower latitudes to which Antarctic sea ice reaches.
Interesting , now how about some more resent data? There have been some significant changes in the Arctic since the first OMG minimum event in 2007.
Greg:
Exactly the type of data Dr. Meiers should be pondering.
Nice Graph!
I saved a link to it.
It also makes me worry just a tad about pushing the plant hardiness zone where I live.
The muscadine grapes may still survive a number of winters.
The date palms and orange trees will have to wait. 🙁
Greg
So what is the graph telling you ???
Why does the Arctic sea ice minimum move towards the end of September as it does on occasion. ???
Bulwark. LOL. There are no absorbing surfaces in the area. It is the angle of the sun to the planet. That is all.
But those warming summers won’t stop Global Warming from causing colder winters.
https://thinkprogress.org/stronger-cold-spells-likely-in-north-america-as-the-polar-vortex-is-shifting-7225c56569c2#.ga661e67w
Global warming brings longer, deeper COLD spells. (and zero warming)
You KNOW it makes sense!
Joe Romm will explain it to you. 😉
sometimes it does.
Look up the effects of a blocking high in winter and the increase in blocking highs as a result of climate change
Ah yes, the ever miraculous “Global Warming”!
It will wash your dishes, but cause them to get dirtier.
It causes droughts and floods, less rain and more rain, less snow and more snow!
GW causes cold weather, warm weather, tepid weather and freezing weather!
GW causes snow in unusual places, just ignore the historical records reporting previous snow.
GW wreck marriages, causes less and more pregnancies, changes the sex drive of plants and fish.
Somewhere on yon internet, people are keeping track of every new claim for what “Global Warming” evoked by CAGW true believers seeking to gerrymander their religion to encompass all weather.
It’s very clear from your comments you are not a student of quantum mechanics. Nuff’ said.
Maybe I should have added a smiley 🙂 or /sarc on that…
Bartleby:
Are you planning on playing dice with Global Warming?
No worries here, I’m good.
Ok, predictions for next year’s Arctic minimum.
I’ll go with 2.75 million sq km. smashing the 2012 low.
Just to preempt the idiots who will try to claim I actually want to see the ice disappear because I’m a communist human-hater, just post your prediction, if you’re game.
No , you are just a moron you has never bothered to look at the real history of Arctic sea ice.
If you had you would know that during the first 3/4 or so of the current interglacial, there was often pretty much zero summer sea ice.
The current level is actually anomalously HIGH compared to the Holocene average.
That’s because we are only a tiny molehill above the COLDEST period in the last 10,000 years.
I suspect it will be much the same as this year, maybe a bit higher.
Its what happens as the cooling sun starts to take affect over the next several years that will be interesting.
I hope you have plenty of rags to wipe the egg off your face.
So you are saying about 4 million plus Andy? I hope your right, 5 would be better.
Actually, the massive economic benefits from lower summer sea ice means that LOWER numbers would be better. Unfortunately, probably not going to happen.
Take the Arctic back to the before the LIA.. finally a RECOVERY to more open Arctic waters, instead of the EXTREMES of 1979, and before that, the LIA,
Does this hurt your brain?
http://realclimatescience.com/2016/10/starting-their-graph-at-the-right-year-to-produce-maximum-fraud/
Quoting Tony Heller is not evidence…
He has a track record of being utterly wrong about sea ice, when he is not being deliberately misleading about it.
This must hurt your brain…? http://realclimatescience.com/2016/10/starting-their-graph-at-the-right-year-to-produce-maximum-fraud/
4.6 million square kilometres tony .
Thank you chilly.
So far:
bit chilly 4.6
Andy about 4.2
tony 2.75
Any other takers? Feel free to explain your reasoning.
“See How Arctic Sea Ice Is Losing Its Bulwark Against Warming Summers”
http://ocean.dmi.dk/arctic/plots/meanTarchive/meanT_2016.png
http://ocean.dmi.dk/arctic/meant80n.uk.php
WARMING SUMMERS,where are these warming summers???????????????
That was something I noticed. The summer do not seem warmer according to the observations, but the winters certainly are. That would suggest that it is not an issue of summer ice melting faster than usual, but a lower rate of re-freeze which is reducing ice volume.
As long as water is in contact with ice it will stay at the same temperature (the freezing point of the ice), that’s why you put ice in your drinks!
It’s very likely that the difference is down to warmer water underneath, so the surface above the ice or near the surface, makes little difference during summer. The key component in this the AMOC and therefore the AMO.
The atmosphere above the Arctic is very warm now and has been for the last few weeks.
Joe Bastardi at Weatherbell has been mentioning this for some time now. On his last Saturday summary he starts discussing Arctic WEATHER at about 9:18.
To get to the free content at Weatherbell click this link.
http://www.weatherbell.com/premium/#joe-bastardi
Then click the “Premium” tab at the top and the latest Daily Update and Saturday Summary videos will pop up.
Temperature at 2 meters in the northern hemisphere.
http://pamola.um.maine.edu//DailySummary/frames/GFS-025deg/ARC-LEA/T2/01.png
http://hockeyschtick.blogspot.com.au/2012/07/nasa-data-shows-arctic-was-warmer-in.html
The thickness of the sea ice.
http://ocean.dmi.dk/anim/plots/ice.arc.1.png
And let’s not forget, in 1903 , Amundsen navigated the Northwest passage.
In 1994 Larson sailed a route near Banks Island.
Neither of those routes was passable when the Northabout sped through on there powerful fossil fuel engines earlier this year .
The current Arctic sea ice level is nothing untoward whatsoever.
Much higher than before Neoglaciation. Probably quite a bit higher than during the MWP and RWP.
The best outcome for people living up there would be for further reductions in summer sea ice. The economic benefits would be massive.
Unfortunately, the NATURAL cycles have now turned, and increasing sea ice will most likely be the decadal outlook.
Amundsen did not navigate the NW Passage in 1903, it took until 1906 to complete the passage.
He was MAPPING at the time. That was his job.
I’m guessing you don’t comprehend the difference.
AndyG55 October 30, 2016 at 12:08 pm
He was MAPPING at the time. That was his job.
I’m guessing you don’t comprehend the difference.
I comprehend what he was doing very well, I’ve read his books describing the journey, have you?
“The North-West Passage: Being the Record of a Voyage of Exploration of the Ship Gjoa, 1903-1907: Volumes 1 & 2”
Before anchoring at Gjoa Havn for the winter in september 1903 they had run aground twice, had an engine room fire and been battered in a 4 day long storm which forced them to throw supplies overboard, they were ready to overwinter!
Larsen’s single season transit was in 1944. You are correct about the route.
Unfortunately, the NATURAL cycles have now turned, and increasing sea ice will most likely be the decadal outlook.
Based on what, your gut feeling?
One of those natural cycles is the AMO. The AMO has plateaued in it’s positive phase. Based on past performance this is an indicator it will be heading towards negative.
This again?
Taking 2 years in a small strengthened boat is not the same as being able to sail a massive cruise liner through without any interference from ice whatever.
there is no comparison from pre 1990s passage of NWP and what has happened on a near yearly basis since – completely open water passage for any size of ship.
Just with a modest sized icebreaker removing the interference from ice you mean?
pbweather October 31, 2016 at 8:11 am
Just with a modest sized icebreaker removing the interference from ice you mean?
Icebreaker was apparently doing a great job judging by this view from the bridge of Crystal Serenity passing through the NW Passage.
http://www.maritime-executive.com/media/images/article/Photos/Cruise_Ships/Cropped/Crystal%20serenity%20under%20way%20nwp%20northwest%20territories%2016×9.jpg
What this actually shows is how unimportant sea ice extent is to climate. The Arctic is the tail of the dog. The climatocracy should consider the implications that ice on top of water actually acts as an insulator.
…tracked their evolution
fromout of 1984 to the presentThere, FIFY
I think they forgot about winter! You know, when the Sun is gone for 6 months and temperatures drop to -40C.
The sea surface temperatures in the Arctic have already dropped to -30C in some places and the most of the basin is below 0C already (noting that the Arctic sea ice forms at -1.9C to -0.5C depending on the location in the basin – some of it is not as salty).
This is produced from a variety of satellites. SSTs on October 29, 2016.
Yet on this date the seaice extent is at its lowest level during the satellite era.
http://nsidc.org/data/seaice_index/images/daily_images/N_stddev_timeseries.png
Amazing! Isn’t it Phil?
With temperatures well below the temperature to freeze sea water; just what is happening to the ice that forms?
http://arctic.atmos.uiuc.edu/cryosphere/NEWIMAGES/arctic.seaice.color.000.png
Seriously, AtheoK?
you know that this display has been bust since spring when the satellite went out?
Wrong data from a bust satellite is your evidence?
Try this…
https://seaice.uni-bremen.de/amsr2/index.html
Be sure to note the extent graphs: lowest figure at this date in the satellite record -currently lower than 2012
Yet within 2 sigma, so perfectly ‘normal’.
The satellite looks bu99ered, again.
The same is happening at the Antarctic also.
stevekeohane October 30, 2016 at 8:19 am
Yet within 2 sigma, so perfectly ‘normal’.
More like 4 sigma!
ATheoK October 30, 2016 at 6:59 am
Amazing! Isn’t it Phil?
With temperatures well below the temperature to freeze sea water; just what is happening to the ice that forms?
As has been pointed out by others the image you posted is compromised by satellite problems. You must have known this because immediately above that image they post the following (in bright red text):
“Special Sensor Microwave Imager and Sounder (SSMIS) on the Defense Meteorological Satellite Program (DMSP) F-17 satellite that provides passive microwave brightness temperatures (and derived Arctic and Antarctic sea ice products) has been providing spurious data since beginning of April. Working on resolving problem or replacing this data source.”
Here’s a satellite image showing a non-frozen Hudson Bay contrary to your spurious image.
Does nobody here look at the ice thickness/age figures?

There is indeed very little old/thick ice left in the arctic…
How can you dispute that?
http://www.cpom.ucl.ac.uk/csopr/seaice.html
and 2010 for comparison
http://www.cpom.ucl.ac.uk/csopr/seaice.html?thk_period=0&select_thk_vol=select_thk&season=Autumn&ts_area_or_point=all&basin_selected=0&show_cell_thickness=0
And
with 2012 for comparison
Did I miss something? The cpom.ucl.ac.uk/csopr/seaice…. has data all the way back to 2010? What a source for trends!!!
Griffypoo:
You do love false reality.
That ice thickness graphic is all modeled. If you check the background pages you can even find where they ‘modded’ the program to add forcings to the model.
Here is one Arctic photograph:
Check out close detail of the “open water” areas; note the large patches of either slush or wet ice. Easily greater than 15%, but not counted in the official totals.
That little reflectance discussion.
Yet the question should be is the water navigable to ordinary shipping or will it require ice breaking.
You would delight many people if you would undertake that navigable ice challenge.
http://nsidc.org/data/seaice_index/images/daily_images/N_bm_extent_hires.png
Or if you prefer, here is a relatively live satellite imagery:
http://www.nrlmry.navy.mil/nexdat/CONUS/focus_regions/Arctic-x-x/x-x-x/night_vis/viirs/20161015.224005.npp.viirs.Night-Vis-IR.Arctic.covg94p1.x.res4km.jpg
Yeah and it matches the data verified by observation and is consistently modelled so allows for year on year comparison.
You show me your evidence its is exactly as thick and old as ever…
Verified by observation?
Who has actually been drilling ice cores on floating ice in the Arctic?
You Griffypoo?
Consistently modeled… What does that mean?
Models are programs. The accomplish tasks the programmer sets in code.
Models that repeatedly reach the same result are hard coded to reach that result.
People who accept model output as real data need psychiatric help, and perhaps crayons, rubber blocks and full time care.
Griff, and has nobody here read about the shenanigans going on with multi-year ice data? See http://realclimatescience.com/2016/04/nsidc-caught-cheating-yet-again .
Rich.
no.
because you are quoting Tony Heller and he just makes stuff up
There you go Griffypoo!
Someone just like you!
Though I doubt Tony Heller will consider you a friend.
There will still be warmer in the Arctic because the polar vortex in the stratosphere is broken.
http://www.cpc.ncep.noaa.gov/products/stratosphere/strat_a_f/gif_files/gfs_t30_nh_f00.png
Jumping the speed of the solar wind, which led to the breakdown of the polar vortex.
http://files.tinypic.pl/i/00834/avvo6shk1bng.gif
http://files.tinypic.pl/i/00834/ktfgtynlbfgd.png
The best I can say about the article: Use of the predicate “When we first started measuring…” in any written or presented climate research result, is a reliable proxy for the presence of unadmitted bias.
I interpret it a little differently but in the same vein Pamela; to me it’s code for “don’t ask us how long we’ve been measuring…” It’s a cheap trick since people are accustomed to paleo records reaching back millions of years without understanding the lack of precision and accuracy in those estimates.
Contemporary, instrument based measures have little provenance, but most folks don’t understand that and so are easily drawn into filling in “unprecedented” without actually being prompted by the author.
Well, I think I have to call b.s. on the basic assumption that thickness equals age for sea ice. This ice gets pushed around by wind and currents, especially when there is open water. The result of this is the ice pushes up into ridges and folds over. These thick blocks may be more likely to last longer and “age”, but they are also more resistant to additional folding and growth. Their movements after they form will determine how long they last. Much randomness in this process. Maybe they should model it. Regardless, thick, folded ice can be years old or days old. There is no direct correlation.
er.. no.
there is a direct age/thickness relationship, as measured by observation:
http://www.mdpi.com/2072-4292/8/6/457/pdf
“Ice age is a good analog for ice thickness because basically, as ice gets older it gets thicker,” Meier said. “This is due to the ice generally growing more in the winter than it melts in the summer.”
There has to be times throughout history when ice generally grew less in the winter than it melted in the summer, right?
Otherwise we’d be back in a full blown ice age with mile thick ice in US instead of this almost perfect interglacial.
Geez, some people don’t know when they got it good.
The bulwark also never gave way on Joseph Conrad’s Patnain Lord Jim. But the captain and crew, imagining disaster, still abandoned ship in an act of cowardice.
Ice mass is currently increasing both in Antarctica:
http://www.nasa.gov/feature/goddard/nasa-study-mass-gains-of-antarctic-ice-sheet-greater-than-losses
and Greenland:
http://www.dmi.dk/en/groenland/maalinger/greenland-ice-sheet-surface-mass-budget/
How does this spell global warming justifying denying citizens electricity and taxing air?
why do you hate babies so much?
It turns out babies are worse than we thought!!!
Researchers at Oregon State University have discovered that babies breathe out a toxic gas which is killing the planet, and that green color in plants is unnatural and caused by human CO2 emissions and toxic baby breath (normally they should be pink or purple).
Warming oceans mean more evaporation creating more snowfall but is obviously causing sea ice to shrink at both poles. I know, I know, it can be quite confusing.
Although I would usually like to agree, 2016 is a low ice year for the Antarctic as well. So, to put this out there, because the Arctic is gaining so slowly, because the Antarctic had a big loss in September, we are at the lowest extent globally since satellite records began. Of course, worth pointing out that in the last 4 years or so, 3 of those had record high Antarctic ice. It’s important to cherry picking comes.
Why do we think we know what the sea ice coverage should be? It’s been changing ever since we started looking and we haven’t even been looking all that long.
We are observing a trend – a downward trend.
and we know that without there being old and thick ice that downward trend is likely to be quicker.
Griff, I’m not sure you know what a trend is. You observed a trend until 2007. You observed a new tend since then and it isn’t in the direction you want, overall.
When the line from left to right is tilted down to the right, I know what I’m seeing.
John October 31, 2016 at 8:54 am
Griff, I’m not sure you know what a trend is. You observed a trend until 2007. You observed a new tend since then and it isn’t in the direction you want, overall.
Are you sure about that?
Griff writes: “We are observing a trend – a downward trend.”
No doubt. New York is free of permanent ice now. With luck that trend you observe will continue at least until I’m dead, after which its someone else’s problem. You’ve chosen to make a value judgment conflicting with mine; for some unknown and unstated reason, you believe the trend should be towards more ice. I disagree and I believe I have good reason.
Why are you concerned the climate is warming?
The graph cherry-picks the start point. There is Arctic ice extent data for the years prior to the chart, showing much lower ice extent anomaly. The low was 1974, about 1.2 million square km less than 1990. Ice extent rose rapidly to the anomaly in 1979, which was 1.8 million square km higher than 1974.
If these earlier data were included in the chart, the straight-line slope would be entirely different, and likely an inappropriate summary for the dataset.
Yes, optimal would be ‘no ice’.
That’s all very well until where you live catches up with the Artic and is 6 or 8 degrees hotter than now.
https://forum.arctic-sea-ice.net/index.php?action=dlattach;topic=230.0;attach=37783;image
Well, the arctic was near normal temperatures most of the summer, hence the fast melting in Spring didn’t deliver a record low for summer months. Not everything is about Co2, you know.
Re shrinking arctic sea ice area: Could it be that we are encountering another satellite sensor biting the dust again? Because this draft looks very suspicious to me:
No, it is correct. October moving slowly for sea ice build up. Polar Vortex hasn’t got going yet and the cold air is over most of Europe and Russia. Someone might be better able to explain the mechanics of it, but when the Polar Vortex isn’t up and running at a good speed, cold air slips down, warm air slips up, warmer than usual arctic. It should go up after November 10th, as even without favorable conditions, it is hard for ice not to grow then.
Some of the really bad years lots of ice exited into the Atlantic. More recent years a lot of ice has piled up along the Arctic coasts of Canada and Greenland.
Duh — takes a minimal effort to discover the Arctic summers are actually about average or slightly below. It’s the winters that are warming (still far below freezing).
The arctic is 20 degrees above normal temps for this time of year at present…
http://www.climatecentral.org/news/arctic-sea-ice-slow-growth-20838
“Compounding the sea ice misery in the Arctic is the disappearance of sea ice that’s been around for four years or more. That older sea ice essentially acts like the foundation of a house, helping support the growth of new, younger sea ice. It’s also thicker and harder and less prone to melting. Without it, younger sea ice is being built on shaky ground and melts more easily each summer.
And yet the foundational layer of ice is disappearing from the Arctic. In the 1980s, it accounted for about 20 percent of all sea ice. But when sea ice reached its minimum in 2016, older ice made up only 3 percent of the icepack.”