Climate researchers have published a new paper this week in the journal Nature Climate Change that acknowledges there has been a global warming slowdown from 2000-2014. Their research shows a hiatus did indeed occur and continued into the 21st century, contradicting another study last June that said the hiatus was just an artifact that “vanishes when biases in temperature data are corrected.” This is not the first time activists have tried to hide the hiatus by using dodgy methods. –Thomas Richard, The Examiner, 24 February 2016

…
An apparent slowing in the rise of global temperatures at the beginning of the twenty-first century, which is not explained by climate models, was referred to as a “hiatus” or a “pause” when first observed several years ago. Climate-change sceptics have used this as evidence that global warming has stopped. But in June last year, a study in Science claimed that the hiatus was just an artefact which vanishes when biases in temperature data are corrected. Now a prominent group of researchers is countering that claim, arguing in Nature Climate Change that even after correcting these biases the slowdown was real.
“There is this mismatch between what the climate models are producing and what the observations are showing,” says lead author John Fyfe, a climate modeller at the Canadian Centre for Climate Modelling and Analysis in Victoria, British Columbia. “We can’t ignore it.”
…
Ups and downs
The debate revolves in part around statistics on temperature trends. The study1 that questioned the existence of the slowdown corrected known biases in the surface temperature record maintained by the US National Oceanic and Atmospheric Administration (NOAA), such as differences in temperature readings from ships and buoys. This effectively increased the warming recorded, and the researchers also extended the record to include 2014, which set a new record high for average temperatures.
That work, led by Thomas Karl, director of NOAA’s National Centers for Environmental Information in Asheville, North Carolina, calculated the rate of global warming between 1950 and 1999 as being 0.113 °C per decade, similar to the 0.116 °C a decade calculated for 2000–14. This, Karl said, meant that an assessment done by the influential Intergovernmental Panel on Climate Change in 20133 showing that warming had slowed was no longer valid.
Fyfe and his colleagues argue2 that Karl’s approach was biased by a period of relatively flat temperatures that extended from the 1950s into the early 1970s. Greenhouse-gas emissions were lower then, and emissions of industrial pollutants such as sulphate aerosols were cooling the planet by reflecting sunlight back into space. Fyfe says that his calculations show that the planet warmed at 0.170 °C per decade from 1972 to 2001, which is significantly higher than the warming of 0.113 °C per decade he calculates for 2000–14.
Fyfe says that the advantage of this approach is that it takes account of events that affect decadal temperature trends. For instance, researchers have found that climate models underestimated the cooling effect of volcanic eruption and overestimated the heating from solar radiation at the beginning of the twenty-first century4. Other researchers are investigating variability in the Pacific Ocean, including a measure of sea surface temperatures known as the Pacific Decadal Oscillation (PDO)5. All these things can affect the climate, and mask the longer-term warming trend.
Bumps and wiggles
Susan Solomon, a climatologist at the Massachusetts Institute of Technology in Cambridge, says that Fyfe’s framework helps to put twenty-first-century trends into perspective, and clearly indicates that the rate of warming slowed down at a time when greenhouse-gas emissions were rising dramatically.
–Jeff Tollefson, Nature, 24 February 2016
Thomas Karl, director of NOAA’s National Centers for Environmental Information – this man did not get to the level of director without towing the company line, no matter the truth. He provided the customer with what they want. NOAA’s company line is determined by who their biggest customer/boss is and that be the Obama administration.
Only a fool would believe anything that comes out of government at the Federal level. Sad but true at this point in our nation.
” Fyfe says that his calculations show that the planet warmed at 0.170 °C per decade from 1972 to 2001, which is significantly higher than the warming of 0.113 °C per decade he calculates for 2000–14″
A lot of bugger-all is still bugger-all. What a waste of time and money, arguing over a few hundreds of one degree.
Who is the “we”?
There has been plenty of “we” that have NOT been ignoring the glaring mis-matches. Is he admitting there is a certain “we” that has been consistently and purposely ignoring the obvious? We can’t ignore that either.
Hey, the first step in recovery is admitting that you have a problem. I’m just SHOCKED that Mickey Mann signed on to a paper with someone who openly admits that what the climate is doing is NOT what the models say it SHOULD be doing, and that it can’t be ignored. Maybe he means the WE on the AGW side…THEY can’t ignore it anymore.
As 2 sides battle over whether the hiatus exists or not because a group of humans has defined the perfect temperature and CO2 level for the atmosphere and planet……..as being those levels when humans began burning fossil fuels……..the planet continues to green up, most life does well and many measures of extreme weather have decreased(from the decrease in the meridional temp contrast/gradient…..meteorology 101).
Massive, irrefutable benefits to life from the increase in CO2 and modest increase in global temperatures(warming the coldest places the most) are ignored, while global computer model climate projections that support the extreme versions of the speculative theory are treated like gospel.
Isolated weather extremes(that have happened before) get all the weighting, while the good weather gets zero weighting.
Climate change/scientific studies show that life like ticks, mosquitoes, bacteria, viruses and weeds will all thrive while good life, like bees, crops, butterflies, polar bears and humans will all suffer greatly.
Interesting how these creatures/life would all know what their role will be in obeying this newly discovered universal law “Bad things do better, Good things do worse”, when carbon dioxide goes up and our planet warms a bit.
Especially since the effects of warming and increasing CO2 has been universally beneficial to almost all life in the past and cooling/lower CO2 has caused great adversity/hardship.
So far, it appears that the word has not been passed on to life yet because the good creatures are still thriving as the planet continues to green up.
Mike Maguire,
Correctomundo, that’s it exactly. And it applies to just abouut every alarmist argument. They’ve taken the most wrong, easiest to falsify side of the argument.
But they can’t back down now, no matter what Planet Earth is telling everyone. If they did, they would be admitting that the hated skeptics were right all along.
So they lie about it, because they hate skeptics more than the truth…
DB-did you mean “They hate skeptics more than they love the truth”? Because it works either way. LOL 🙂
Aphan…. I think he meant to say it just that way. It perfectly captures the important issue.
So they lie about it, because they hate skeptics more than the truth…
=====================
what they hate most of all is to be shown to be wrong. being wrong doesn’t bother them. it is someone else standing up and pointing out where they are wrong. that is what they fear the most. being made to look stupid for having gotten things wrong.
It continues to green up as long as we can keep output going. What will happen after global population hits the inflection point a few years from now? And I doubt in today’s “bottom line” world anyone will promote less energy efficiency, all green considerations aside. As sure as “peak BTUs” will happen, you can bet that the AGW term will eventually have a negative derivative after a lag time. Then what?
models say it should be ~1/2 degree warmer….is it?
…..fail
It’s amazing how long it took them to discover the impacts of the smoothed PDO signal. I don’t think they even needed to discredit AGW in order to accept it. The real test will be what happens when PDO flips again. But of course, if there is something even lower frequency that flips negative, the pause may become truly multidecadal and maybe more.
It’s worse than we think for the warmistas, all the models say warming is to be ACCELERATING and were clearly not seeing that in global measurement data. This ACCELERATED warming occurs only in the imaginary/pseudo-data generated by climate models.
Global warming has virtually stopped.
Sun Spot says
“Global warming has virtually stopped.”
Mmmm…. this would say otherwise
https://en.wikipedia.org/wiki/Global_warming#/media/File:Global_Temperature_Anomaly.svg
And this
http://arctic.atmos.uiuc.edu/cryosphere/arctic.sea.ice.interactive.html
Oh and this
this would say otherwise
=================
what you have shown is political manipulation. growing up we heard how back communism was. the evils of Stalin re-writing history.
Yet here we are, with NOAA/NASA changing the past in the official temperature series.
Fundamental to accounting and auditing is the notion that you CANNOT and MUST NOT change the past. If you do, it is fraud.
It is the present that you must adjust. if an error was made in the past, you correct it today. you do not alter history, no matter how inconvenient.
We have hundreds of years of experience in the correct way to keep records. Fundamental to these principles is the single underlying rule. You do not tamper with history.
Simon,
Your links are nonsense. The “projected” temperatures never happen.
If you visit the real world, you will see that.
Fred
“Fundamental to accounting and auditing is the notion that you CANNOT and MUST NOT change the past. If you do, it is fraud.”
I think I see your problem. You are on the wrong blog. This is for people interested in climate. Accounting blogs are more boring…. maybe because they don’t correct known past errors which is entirely sensible in the quest to achieve the most accurate record of the past. You may not like the changes, because they are making it increasing hard for you to push your head into the sand, but they are reasonable. And, as has been pointed out many times (see Nick Stokes work) here, the effect of the adjustments in to minimise the warming. So you lose both ways.
DB says
“Your links are nonsense. The “projected” temperatures never happen.”
These are up to date/current/have happened…. they are not projections at all. Keep up DB.
Even the IPCC in its AR5 conceded slowing warming (despite rising CO2). Judith Curry’s written testimony to US Senate:
“Recent hiatus in surface warming and discrepancies with climate models
“The IPCC AR5 notes the lack of surface warming since 1998:
“[T]he rate of warming over the past 15 years (1998–2012) [is] 0.05 [–0.05 to +0.15] °C
per decade which is smaller than the rate calculated since 1951 (1951–2012) [of] 0.12 [0.08
to 0.14] °C per decade.” (AR5 SPM)”
https://curryja.files.wordpress.com/2014/01/curry-senatetestimony-2014-final.pdf
All these people deserve one another… I can imagine the blood pressures rising.
The new paper from Fyfe is not surprising. He previously published that the 117 CMIP5 model runs do NOT replicate actual temperatures from 1992-2012, and the difference is very significant. Same paper also said warming from 1998-2012 (HadCRUT4) not significantly different from zero. Fyfe et. al. Overestimated global warming last 20 years, NCC 3: 767-769 (2013). Here he does something similar, knocking Karl rather than CMIP5.
What IS surprising is his list of co-authors. I suspect the blowback from Karl is creating a great disturbance in the warmunist force. Somebody in that authors list probably knows what the whistleblowers inside NOAA told Rep. Smith’s Congressional Oversight Science subcommittee, which occaisioned the subpoena which occaisioned NOAA contempt of congress. So the heavies decided to get out of the target area. No other explanation for Mann, who as late as 2014 in his Scientific American article False Hope explicitly said yhere was no pause, showing using ‘unique’ (that is, none of the official datasets) that there was only what his figure labeled a faux pause. Essay Unsettling Science covered this in detail. McIntyre showed that Mann’s temperature data in his SciAm figure was ‘unique’.
Fyfe, Santer and several others were also authors on this paper.
http://www.nature.com/ngeo/journal/v7/n3/full/ngeo2098.html
This is a paper that created a 23 year long pause in satellite data once corrected for ENSO and volcanoes. So, these folks know that the satellite data shows no warming for a long time.
http://www.nature.com/ngeo/journal/v7/n3/images/ngeo2098-f1.jpg
How do they reconcile the difference between satellites and surface data? I suspect they simply ignore the problem and hope no one mentions it.
Or they might come out with a video trying to discredit the satellite data.
Oops..too late.
They “reconcile” it by realising that TLT is not the surface and that UAH and RSS have continually *altered* their algorithm — so the record is not a homogenised one.
Also the cooling stratosphere has a bias on the MSU/AMSU.
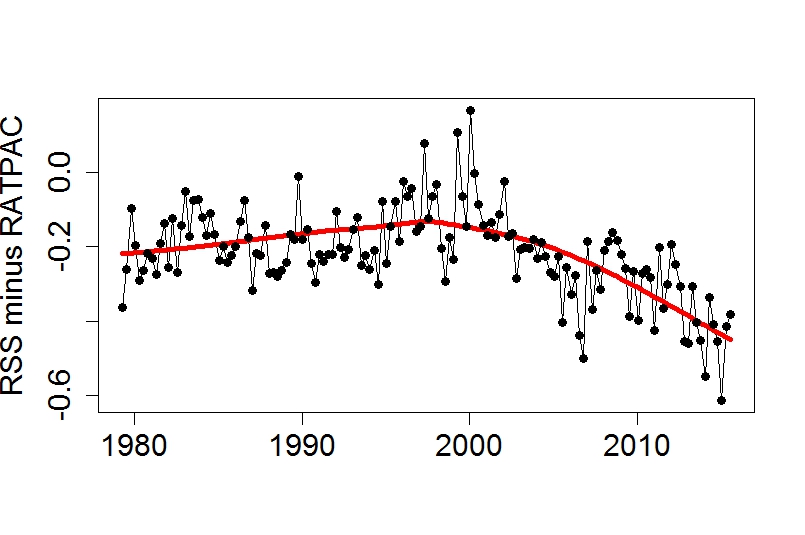
Add to that the fact that RSS has diverged from the RS RATPAC data since around 2000 (when the new AMSU aboard MOAA15 came online.
Before 2000 good match – after thousands of land thermometers wrong.
That’s a reasonable interpretation?
Imagine how that is possible. There might be other explanations. How about satellite calibration?”
your hockey stick is upside down.
This is good stuff. Can someone suggest a reason why, if the climate models so neatly model the cooling effects of past volcanic eruptions, why they never contain any future volcanoes?
(Hint: it’s a rhetorical question)
The Pause; It’s here, it’s clear, get used to it.
Over the next couple years as temperatures start to ease DOWNWARD ( in the reality of satellite data , anyway)…..
…. I hope the likes of Nick and Mosh will stick around to face their due humiliation. 🙂
Its only this drawn out El Nino ocean cooling event that has been holding temperatures level.
Judging by the current SST trend in the Pacific
http://weather.unisys.com/surface/sst_anom.gif
they will no doubt soon be readjusting the SST baselines – again.
Then they’ll all be gushing – again – about another anthropologenic hottest year evah!
Of course, Mann has stated ““The temporary slowdown in no way implies that human-caused warming has ceased or slowed down,” Mann said. “It was temporarily masked by natural factors.””
The hallmark of a cult. Nothing can dissuade them from their Beliefs. In their (computer model) world, only Mankind can cause warming, not nature. But, nature can mask it.
The paper is also trying to take the position that the oceans ate their warming.
Scientific American also has an article on this paper.
http://www.scientificamerican.com/article/global-warming-hiatus-debate-flares-up-again/
Gavin Schmidt is quoted near the end as being tired of the discussion.
I’ll bet he is.
Gavin Schmidt is quoted near the end as being tired of the discussion.
=============
the truth goes on forever, a lie always has an end.
You can only say “The sky is falling!” so many times before the people all notice it hasn’t fallen YET–and cease paying any attention to your squawking.
“An apparent slowing in the rise of global temperatures at the beginning of the twenty-first century, which is not explained by climate models, was referred to as a “hiatus” or a “pause” when first observed several years ago. Climate-change sceptics have used this as evidence that global warming has stopped.”
I would rather say that the pause proves that United Nations climate panel IPCC does not have a proper understanding of the issue at hand. The idea that the statements by IPCC can be trusted on these matters has been falsified.
When little boys like Gavin and Mikey cry wolf too often, they eventually get eaten by the wolf, and nobody notices…or cares ! Woof !
It ain’t a “hiatus” or even a “pause” until it starts going up again. If it goes back down, then it is a peak or a plateau.
Let’s see what happens first before we start giving it names that define it.
These researchers claim that there is no hiatus in warming, but if there is then it’s all the fault of the Pinatubo eruption, or more specifically additional volcanic aerosols emitted since 1991.
http://www.nature.com/ngeo/journal/v7/n3/full/ngeo2098.html
Apparently we are living in extremely volcanic times.
But it seems the frequency of [observed] eruptions has been constant since 1945
https://www.metabunk.org/debunked-significant-increase-in-volcano-eruptions.t6225/
The global average temperature trend consists of [1] natural variability [this includes irregular intra-annual and intra-seasonal variations] — 60-year cycle since 1880 withthe sine curve varying between +0.3 and -0.3 oC; and [2] trend. Trend consists of [2a] greenhouse effect and [2b] non-greenhouse effect. Greenhouse affect consists of [2ai] anthropogenic greenhouse effect, known as global warming and [2aii] other forcings. Non-greenhouse effect consists of [2bi] urban heat-island effect and [2bii] rural cold-island effect. Under human induced effects come: 2ai & 2b. IPCC noted the contribution of [2a] is more than half and contribution of [2b] is less than half — a qualitative definition. In the global average temperature on the land: [2bi] is over emphasised as the met network was concentrated in urban areas and [2bii] is under emphasised as the met network was sparsely distributed. Thus [2b] is over emphasised in the global avrage temperature anomaly. In addition to this the new entry is “filth” that changes the surface reflectivity and obsorption capacity of surface [land & oceans]. This creates the cooling effect, this is not accounted in the global average temperature anomaly. Also, general circulation patterns create advective addition.
Also, atmosphere has more than enough greenhouse gases that transform energy in to temperature and thus global warming is a misnomer only. After rectifying the adjustments made to data — lowering the past and moving upward the current data –, the trend part will be insignificant.
The combined effect of all these factors is, no change for the last around 19 years and will continue in future. This is reflected in satellite and balloon data series.
Dr. S. Jeevananda Reddy
Give thanks for “the pause” and clouds. A Limerick.
The cause for the Climate change pause:
The CO2 increase; because
there’s more clouds in the sky
make more snow, that is why
the climate is stable. Applause! http://lenbilen.com/2016/02/24/4697/
Anthony – I knew their claim was a fake from the start. This is not the first time they have faked global temperature. Last time it was just like the present time – an attempt to suppress the existence of a hiatus. Unfortunately, they were successful and their false warming is still part of the official temperature curve. The hiatus I speak of lasted for 18 years and is the one in the eighties and nineties that is shown as Figure 15 in my book “What Warming?” What they did was to over-write it with a non-existent “late twentieth century” warming and make that fake warming official. It is still part of their official temperature curve after 18 years of creating false impressions of global warming history. I discovered this hiatus in 2008 while studying satellite temperature curves and realized it was missing in ground-based temperature records from GISS, HadCRUT3, and NCDC. Later it turned out that all three had been computer processed and the computer had left identical temperature noise peaks in all three publicly available data-sets. Why this triple play? Most likely to eliminate a disagreement with the new fake official temperature curve they had just created. I kept pointing to this situation in comments and even put a warning about it into the preface of my book when it came out. It was completely ignored. Checking contemporaneous NASA records shows that the eighties and the nineties did not have any warming before 1997 and might even have had a slight negative slope. On October 29th you printed an article of mine that brought out these facts. To my surprise Bob Tisdale immediately jumped on me with an accusation that I had made it all up. He first opined that “In reality, Arno, what you have presented in this post is garbage.” And then he follows it up with this libel; “Arno, it is good to see you up to your old tricks of misrepresenting data.” This calls for a public apology. He is going all out to defend the existence of the fake warming dreamed up by global warming activists As far as misrepresenting data goes, the graph he shows as a justification, allegedly showing satellite data, has nothing whatsoever to do with present or past satellite temperature. That is easy to see by comparing it with any recent monthly temperature curve from UAH or RSS. This being the case, use of this bogus graph by Tisdale qualifies it as his ”…old tricks of misrepresenting data.”
in terms of AGW it does not matter whether there is a pause or whether there is not a pause if it cannot be shown that warming is related to emissions
http://papers.ssrn.com/sol3/papers.cfm?abstract_id=2725743