By Christopher Monckton of Brenchley
The sharp el Niño spike is just about to abolish the long Pause in global temperatures – at least for now. This column has long foretold that the present el Niño would be substantial, and that it might at least shorten if not extinguish the Pause. After all, theory requires that some global warming ought to occur.
This month, though, the Pause clings on. Though January 2016 was the warmest January in the RSS satellite record since 1979, the El Niño spike has not yet lasted long enough to end the Pause. That will happen by next month’s report. The RSS data still show no global warming for 18 years 8 months, notwithstanding record increases in CO2 concentration over the period.

Dr Roy Spencer’s UAH v.6 satellite lower-temperature dataset shows the Pause has already (just) disappeared. For 18 years 2 months there has been barely any warming, though to two decimal places the anomaly is zero:

The believers say there was never a Pause in the first place. After many unconvincing alterations to all of the principal global surface tamperature datasets over the two years leading up to the Paris climate conference, the Pause all the datasets once showed had been erased.
Significantly, the two satellite datasets continued to show a steadily-lengthening Pause till last month, but over the past year or two, long before the present el Niño set in, the three terrestrial datasets had already succeeded in ingeniously airbrushing it away.
The not necessarily reliable Tom Karl of NOAA and the relentlessly campaigning Gavin Schmidt of NASA held a joint press conference to celebrate the grants their rent-seeking organizations can milk out of their assertion that 2015 was the warmest year since 1880. But they carefully omitted the trend-line from their graph, so I have added it back. It shows the world warming since 1880 at an unexciting two-thirds of a degree per century:

NOAA’s much-altered global surface temperature record, showing a 0.9 Cº global warming trend since 1880, equivalent to just two-thirds of a degree per century.
So here’s the Houston problem, the 13th chime, the dog that didn’t bark in the night-time, the fly in the ointment, the poop in the puree, the jumbo in the Jacuzzi – the $64,000 question that would once have alerted true scientists to the possibility that somewhere their pet theory might have gone more than somewhat agley.

The Jumbo in the Jacuzzi
Since the satellites of both UAH and RSS show there has been very little global warming of the lower troposphere over the past decade or two, perhaps Schmidt and Karl would care to answer the following key question, which I have highlighted in red:

Schmidt and Karl, like the Met Office this side of the pond, say there has been rapid surface warming over the past 19 years. If so, where on Earth did it come from? The laws of thermodynamics are not up for repeal. The official theory is that CO2 warms the atmosphere and the atmosphere warms the surface. But for almost 19 years the satellites show that the lower atmosphere has barely warmed. Even if there had been CO2-driven warming higher up, for the official theory says we should expect a faster warming rate in the mid-troposphere than at the surface, how could that higher-altitude warming have magically reached the surface through a lower troposphere that has not warmed at all?
IPCC had predicted in 2007, on the basis of a single bad paper by Ben Santer of Lawrence Livermore National Laboratory, that the tropical mid-troposphere should warm twice or even thrice as fast as the tropical surface. However, as the revealing final slide shown by Schmidt and Karl at their press conference demonstrates, the predicted tropical mid-troposphere hot spot (I had the honor to name it) is in reality absent. Lower and mid-troposphere anomalies are almost identical:

One clue to the source of the warming reported by the surface datasets but not by the satellite datasets over the past 19 years is to be found in another revealing diagram presented by Schmidt and Karl at their presser.
About five-sixths of the areas of “record” surface warming shown in the NOAA diagram are areas of ocean, the el Niño-driven warming of the eastern equatorial Pacific being particularly pronounced.
Aside from the ocean warming, the land-based warming was prominent over Siberia and northern China, Europe and central America, inferentially owing much to urban heat-island effects.
In short, the warming of both land and oceans shows a pattern strongly confirming the satellite record to the extent that the warming – insofar as it is not a mere artefact of the surface-temperature tampering over the past couple of years – displays a pattern suggesting that it originates not from above in the atmosphere, where it would have originated if CO2 had been the cause, but at or below the surface.

On any view, the significant warming that the terrestrial datasets claim over the past two decades cannot have come from the atmosphere, and accordingly cannot have been caused by our enrichment of that atmosphere with greenhouse gases – if, that is, the satellites are correct that the lower troposphere has not been warming.
When the first temperature-monitoring satellites began to deliver data, NASA said the satellite temperature record would be more reliable than the surface record because the coverage was more complete, the method of measurement standardized and the coverage and coverage-bias uncertainties that plague the terrestrial record were absent.
Now that the satellites of both UAH and RSS have been showing so little warming for so long, expect that story to begin to change. If the satellite data are broadly correct, then either the terrestrial data are wrong owing to unjustifiable tampering or they are detecting genuine warming that may be from urban heat-island influences or from deep-ocean warming but cannot be from the atmosphere and is not caused by our sins of emission.
One way to prop up the specious, crumbling credibility of the terrestrial temperature datasets and of the CO2 panic at the same time is to attack the satellite datasets and pretend that the measurement method that NASA itself had once said was the best available is somehow subject to uncertainties even greater than those to which the terrestrial datasets are prone.
I am not the only one to sense that Dr Mears, the keeper of the RSS satellite dataset, who labels all who ask questions about the Party Line as “denialists” and in early 2016 took shameful part in a gravely prejudiced video about global temperature change, may be about to revise his dataset sharply to ensure that the remarkable absence of predicted warming that it demonstrates is sent down the memory hole.
What of ocean warming? The ARGO bathythermographs show little warming at the surface from 2004 until the current el Niño began. What is more, ARGO stratigraphy shows that the warming is generally greater with depth. The warming of the ocean, then, appears to be coming not from above, is it would if CO2 were the driver, but from below.
I should have liked to show graphs to establish that the warming is greater in the lower than in the upper strata of the 1.25-mile slab that ARGO measures. But the ARGO marine atlas is clunky and does not seem to be as compatible with PCs as it should be. So I have been unable to extract the relevant data. If anyone is able to produce complete stratum-by-stratum anomaly-and-trend plots of the ARGO data for its 12 full years in operation from January 2004 till December 2015, please let me know as soon as the December 2015 ARGO data become available. The latest monthly update is very late, as the ARGO data often are:

If the eventual data confirm what I have some reason to suspect, then a further killer question must be faced by the tamperers:

Though the Pause is gone, the problem it poses for the Thermageddonites remains. For their own theory dictates that, all other things being equal, an initial direct warming should occur instantaneously in response to radiative forcings such as that from CO2. However, for almost 19 years there was not a flicker of response from global temperatures, casting serious doubt upon the magnitude of the warming to be expected from anthropogenic influences.
To the believers, therefore, it was important that the Pause should not merely cease, for Nature is, as expected, gradually taking care of that, but vanish altogether. The need to abolish the Pause became still more urgent when at a hearing in December 2015 Senator Ted Cruz, to the great discomfiture of the “Democrats”, displayed the RSS graph showing no global warming for 18 years 9 months.
So to another killer question that Schmidt and Karl ducked at their presser, and must now face (for if they do not answer it Senator Cruz can be expected to go on asking it till he gets an answer):

The now-glaring discrepancies between prediction and reality, and between the satellite and terrestrial datasets, are plainly evident from all datasets even after the tampering. Yet until now there has been no systematic analysis to show just how large the discrepancies have become. So here goes.
In 1990, at page xxiv of the First Assessment Report, IPCC predicted near-linear global warming of 1.0 [0.7, 1.5] K over the 36 years to 2025, a rate equivalent to 2.78 [1.94, 4.17] K/century. However, in the 26 years since 1990 the reported warming rates are equivalent to only [1.59, 1.73] K/century from the terrestrial datasets (blue needles) and [1.14, 1.23] K/century from the satellites (green needles). IPCC’s 1990 central prediction, the red needle, accordingly shows almost double the warming reported by the terrestrial datasets and at least two and a half times that reported by the satellite datasets.
Somehow, the flagrant over-prediction that the discrepancy graphs of temperatures from 1990, 1995 and 2001 to today illustrate did not get a mention in the colourful material circulated to the media by the SchmidtKarlPropagandaAmt.

The models’ extravagant over-prediction becomes still more self-evident when one looks at IPCC’s next excitable prediction. In fig. 6.13 of the 1995 Second Assessment Report, IPCC predicted a medium-term warming rate of 0.38 K over 21 years, equivalent to 1.8 K per century, assuming the subsequently-observed 0.5%-per-year increase in atmospheric CO2 concentration.

Here, at least, IPCC’s prediction is within shouting distance of the terrestrial temperature data, though still extravagantly above the satellite temperature data. But IPCC’s 1990 least prediction was well above its own central prediction made just five years later. IPCC’s 1990 central prediction was 50% above its 1995 prediction, and its 1990 high-end prediction was 130% above its 1995 prediction.
The reliability of IPCC’s predictions deteriorated still further in 2001. On page 8 of the Summary for Policymakers, it predicted that in the 36 years 1990-2025 the world would warm by [0.4, 1.1] K, equivalent to [1.11, 3.05] K/century, again a significant downshift compared with the interval of medium-term predictions it had made in 1990, and implying a central estimate equivalent to about 2.08 K/century (the red needle on the following temperature clock) over the 25-year period:

Three points are startlingly evident in these graphs. First, IPCC has inexorably and very substantially cut its predictions of medium-term warming since the exaggerated predictions in its First Assessment Report got the climate scam going in 1990.
Secondly, even its revised predictions are substantial exaggerations compared with observed, reported reality.
Thirdly – and this is very odd – the most basic measure of the uncertainties in temperature measurement in any time-series, which is the interval between the least and greatest reported trends on that series, has widened when most indications are that it should be narrowing.
To demonstrate that error-bars on temperature measurement should be narrowing in response to all those taxpayer dollars being flung at it, the HadCRUT4 dataset – which to Professor Jones’ great credit publishes the error-bars as well as the central estimate of observed temperature change – shows a considerable narrowing of the uncertainty interval over time, as methods of measurement become less unreliable:

The very reverse of what the HadCRUT4 dataset shows should be happening is happening. As Table 1 shows, the discrepancy between the least (yellow background) and the greatest (purple background) reported temperature change over successive periods is growing, not narrowing:
| Start date | GISS | HadCR4 | NCEI | RSS | UAH | Uncertainty |
| Sat:1979 | 0.60 | 0.61 | 0.37 | 0.45 | 0.42 | 0.51
K/century |
| K/century | 1.63 | 1.65 | 1.55 | 1.23 | 1.14 | |
| AR1:1990 | 0.45 | 0.41 | 0.43 | 0.29 | 0.26 | 0.73
K/century |
| K/century | 1.73 | 1.59 | 1.66 | 1.11 | 1.00 | |
| AR2:1995 | 0.33 | 0.28 | 0.32 | 0.09 | 0.09 | 1.14
K/century |
| K/century | 1.55 | 1.31 | 1.53 | 0.42 | 0.41 | |
| AR3:2001 | 0.18 | 0.13 | 0.20 | –0.02 | 0.03 | 1.46
K/century |
| K/century | 1.22 | 0.85 | 1.35 | –0.11 | 0.19 |
Table 1: Reported (dark blue) and centennial-equivalent (dark green) temperature trends on the three terrestrial (pale green background) and two satellite (blue background) monthly temperature anomaly datasets for periods starting respectively in January of 1979, 1990, 1995 and 2001 and all ending in December 2015.
Note how, on all datasets, the warming rate declines the closer to the present one begins. This, too, is contrary to official theory, which says that the warming rate should at least remain constant given the ever-increasing anthropogenic forcings acting on the climate. It is also contrary to one of the most mendacious graphs in the IPCC reports:

The official storyline, derived from the bogus statistical technique illustrated in the above IPCC graph, is that the rate of global warming is itself accelerating, and that we are to blame. The Swiss Bureau de l’Escroquerie is investigating this and, no doubt, many other outright frauds in IPCC documents.
However, note how rapidly the measurement uncertainty, here defined as the difference between the least (yellow) and greatest (pink) reported centennial-equivalent temperature trend in Table 1, widens even as the start-date of the period under consideration comes closer to the present, when by rights it should narrow. Another killer question for the believers to answer, therefore:

If one excludes the data after October 2015, which are temporarily influenced by the current el Niño spike in global temperatures, the warming rate since 1950 is lower now than at any previous date since that year.

This widening of the divergence between the terrestrial and satellite datasets is clear evidence that the effect of the tampering with all three terrestrial datasets in the two years preceding the Paris climate summit has been what one would, alas, expect of the tamperers: artificially to increase the apparent warming rate ever more rapidly as the present approaches.
A legitimate inference from this observation is that the tampering, however superficially plausible the numerous excuses for it, was in truth intended and calculated to overwhelm and extinguish the Pause that all the datasets had previously shown, precisely so that those driving and profiting from the climate scam could declare, as they have throughout the Marxstream news media, that there was never any Pause in the first place.
Let us hope that Professor Terence Kealy, former Vice Chancellor of Buckingham University, takes a very close look at this posting as he conducts his own review of the tamperings with the various terrestrial datasets.
The current el Niño, as Bob Tisdale’s distinguished series of reports here demonstrates, is at least as big as the Great el Niño of 1998. The RSS temperature record is now beginning to reflect its magnitude. If past events of this kind are a guide, there will be several months’ further warming before the downturn in the spike begins.
However, if there is a following la Niña, as there often is, the Pause may return at some time from the end of this year onward. Perhaps Bob could address the likelihood of a la Niña in the next of his series of posts on the ENSO phenomenon.
The hiatus period of 18 years 8 months is the farthest back one can go in the RSS satellite temperature record and still show a sub-zero trend. The start date is not cherry-picked: it is calculated. And the graph does not mean there is no such thing as global warming. Going back further shows a small warming rate. And yes, the start-date for the Pause has been inching forward, though just a little more slowly than the end-date, which is why the Pause has continued on average to lengthen.
The warming rate taken as the mean of the RSS and UAH datasets since they began in 1979 is equivalent to 1.2 degrees/century:

However, the much-altered surface tamperature datasets show a 35% greater warming rate, equivalent to 1.6 degrees/century:

Bearing in mind that one-third of the 2.4 W m–2 radiative forcing from all manmade sources since 1750 has occurred during the period of the Pause, a warming rate equivalent to little more than 1 C°/century is not cause for concern.
As always, a note of caution. Merely because there has been little or no warming in recent decades, one may not draw the conclusion that warming has ended forever. Trend lines measure what has occurred: they do not predict what will occur.
The Technical Note explains the sources of the IPCC’s predictions in 1990 and in 2005, and also demonstrates that that according to the ARGO bathythermograph data the oceans are warming at a rate equivalent to less than a quarter of a Celsius degree per century. In a rational scientific discourse, those who had advocated extreme measures to prevent global warming would now be withdrawing and calmly rethinking their hypotheses. However, this is not a rational scientific discourse.
Key facts about global temperature
These facts should be shown to anyone who persists in believing that, in the words of Mr Obama’s Twitteratus, “global warming is real, manmade and dangerous”.
Ø The RSS satellite dataset shows no global warming at all for 224 months from June 1997 to December 2015 – more than half the 445-month satellite record.
Ø There has been no warming even though one-third of all anthropogenic forcings since 1750 have occurred since 1997.
Ø Since 1950, when a human influence on global temperature first became theoretically possible, the global warming trend has been equivalent to below 1.2 Cº per century.
Ø The HadCRUT4 global warming trend since 1900 is equivalent to 0.77 Cº per century. This is well within natural variability and may not have much to do with us.
Ø The fastest warming rate lasting 15 years or more since 1950 occurred over the 33 years from 1974 to 2006. It was equivalent to 2.0 Cº per century.
Ø Compare the warming on the Central England temperature dataset in the 40 years 1694-1733, well before the Industrial Revolution, equivalent to 4.33 C°/century.
Ø In 1990, the IPCC’s mid-range prediction of near-term warming was equivalent to 2.8 Cº per century, higher by two-thirds than its current prediction of 1.7 Cº/century.
Ø The warming trend since 1990, when the IPCC wrote its first report, is equivalent to little more than 1 Cº per century. The IPCC had predicted close to thrice as much.
Ø To meet the IPCC’s original central prediction of 1 C° warming from 1990-2025, in the next decade a warming of 0.75 C°, equivalent to 7.5 C°/century, would have to occur.
Ø Though the IPCC has cut its near-term warming prediction, it has not cut its high-end business as usual centennial warming prediction of 4.8 Cº warming to 2100.
Ø The IPCC’s predicted 4.8 Cº warming by 2100 is well over twice the greatest rate of warming lasting more than 15 years that has been measured since 1950.
Ø The IPCC’s 4.8 Cº-by-2100 prediction is four times the observed real-world warming trend since we might in theory have begun influencing it in 1950.
Ø The oceans, according to the 3600+ ARGO buoys, are warming at a rate of just 0.02 Cº per decade, equivalent to 0.23 Cº per century, or 1 C° in 430 years.
Ø Recent extreme-weather events cannot be blamed on global warming, because there has not been any global warming to speak of. It is as simple as that.
Technical note
Our latest topical graph shows the least-squares linear-regression trend on the RSS satellite monthly global mean lower-troposphere dataset for as far back as it is possible to go and still find a zero trend. The start-date is not “cherry-picked” so as to coincide with the temperature spike caused by the 1998 el Niño. Instead, it is calculated so as to find the longest period with a zero trend.
The fact of a long Pause is an indication of the widening discrepancy between prediction and reality in the temperature record.
The satellite datasets are arguably less unreliable than other datasets in that they show the 1998 Great El Niño more clearly than all other datasets. The Great el Niño, like its two predecessors in the past 300 years, caused widespread global coral bleaching, providing an independent verification that the satellite datasets are better able than the rest to capture such fluctuations without artificially filtering them out.
Terrestrial temperatures are measured by thermometers. Thermometers correctly sited in rural areas away from manmade heat sources show warming rates below those that are published. The satellite datasets are based on reference measurements made by the most accurate thermometers available – platinum resistance thermometers, which provide an independent verification of the temperature measurements by checking via spaceward mirrors the known temperature of the cosmic background radiation, which is 1% of the freezing point of water, or just 2.73 degrees above absolute zero. It was by measuring minuscule variations in the cosmic background radiation that the NASA anisotropy probe determined the age of the Universe as 13.82 billion years.
The RSS graph (Fig. 1) is accurate. The data are lifted monthly straight from the RSS website. A computer algorithm reads them down from the text file and plots them automatically using an advanced routine that automatically adjusts the aspect ratio of the data window at both axes so as to show the data at maximum scale, for clarity.
The latest monthly data point is visually inspected to ensure that it has been correctly positioned. The light blue trend line plotted across the dark blue spline-curve that shows the actual data is determined by the method of least-squares linear regression, which calculates the y-intercept and slope of the line.
The IPCC and most other agencies use linear regression to determine global temperature trends. Professor Phil Jones of the University of East Anglia recommends it in one of the Climategate emails. The method is appropriate because global temperature records exhibit little auto-regression, since summer temperatures in one hemisphere are compensated by winter in the other. Therefore, an AR(n) model would generate results little different from a least-squares trend.
Dr Stephen Farish, Professor of Epidemiological Statistics at the University of Melbourne, kindly verified the reliability of the algorithm that determines the trend on the graph and the correlation coefficient, which is very low because, though the data are highly variable, the trend is flat.
RSS itself is now taking a serious interest in the length of the Great Pause. Dr Carl Mears, the senior research scientist at RSS, discusses it at remss.com/blog/recent-slowing-rise-global-temperatures.
Dr Mears’ results are summarized in Fig. T1:

Figure T1. Output of 33 IPCC models (turquoise) compared with measured RSS global temperature change (black), 1979-2014. The transient coolings caused by the volcanic eruptions of Chichón (1983) and Pinatubo (1991) are shown, as is the spike in warming caused by the great el Niño of 1998.
Dr Mears writes:
“The denialists like to assume that the cause for the model/observation discrepancy is some kind of problem with the fundamental model physics, and they pooh-pooh any other sort of explanation. This leads them to conclude, very likely erroneously, that the long-term sensitivity of the climate is much less than is currently thought.”
Dr Mears concedes the growing discrepancy between the RSS data and the models, but he alleges “cherry-picking” of the start-date for the global-temperature graph:
“Recently, a number of articles in the mainstream press have pointed out that there appears to have been little or no change in globally averaged temperature over the last two decades. Because of this, we are getting a lot of questions along the lines of ‘I saw this plot on a denialist web site. Is this really your data?’ While some of these reports have ‘cherry-picked’ their end points to make their evidence seem even stronger, there is not much doubt that the rate of warming since the late 1990s is less than that predicted by most of the IPCC AR5 simulations of historical climate. … The denialists really like to fit trends starting in 1997, so that the huge 1997-98 ENSO event is at the start of their time series, resulting in a linear fit with the smallest possible slope.”
In fact, the spike in temperatures caused by the Great el Niño of 1998 is almost entirely offset in the linear-trend calculation by two factors: the not dissimilar spike of the 2010 el Niño, and the sheer length of the Great Pause itself. The headline graph in these monthly reports begins in 1997 because that is as far back as one can go in the data and still obtain a zero trend.

Fig. T1a. Graphs for RSS and GISS temperatures starting both in 1997 and in 2001. For each dataset the trend-lines are near-identical, showing conclusively that the argument that the Pause was caused by the 1998 el Nino is false (Werner Brozek and Professor Brown worked out this neat demonstration).
Curiously, Dr Mears prefers the terrestrial datasets to the satellite datasets. The UK Met Office, however, uses the satellite data to calibrate its own terrestrial record.
The length of the Pause, significant though it now is, is of less importance than the ever-growing discrepancy between the temperature trends predicted by models and the far less exciting real-world temperature change that has been observed.
Sources of the IPCC predictions
IPCC’s First Assessment Report predicted that global temperature would rise by 1.0 [0.7, 1.5] Cº to 2025, equivalent to 2.8 [1.9, 4.2] Cº per century. The executive summary asked, “How much confidence do we have in our predictions?” IPCC pointed out some uncertainties (clouds, oceans, etc.), but concluded:
“Nevertheless, … we have substantial confidence that models can predict at least the broad-scale features of climate change. … There are similarities between results from the coupled models using simple representations of the ocean and those using more sophisticated descriptions, and our understanding of such differences as do occur gives us some confidence in the results.”
That “substantial confidence” was substantial over-confidence. For the rate of global warming since 1990 – the most important of the “broad-scale features of climate change” that the models were supposed to predict – is now below half what the IPCC had then predicted.
In 1990, the IPCC said this:
“Based on current models we predict:
“under the IPCC Business-as-Usual (Scenario A) emissions of greenhouse gases, a rate of increase of global mean temperature during the next century of about 0.3 Cº per decade (with an uncertainty range of 0.2 Cº to 0.5 Cº per decade), this is greater than that seen over the past 10,000 years. This will result in a likely increase in global mean temperature of about 1 Cº above the present value by 2025 and 3 Cº before the end of the next century. The rise will not be steady because of the influence of other factors” (p. xii).
Later, the IPCC said:
“The numbers given below are based on high-resolution models, scaled to be consistent with our best estimate of global mean warming of 1.8 Cº by 2030 [compared with pre-industrial temperatures]. For values consistent with other estimates of global temperature rise, the numbers below should be reduced by 30% for the low estimate or increased by 50% for the high estimate” (p. xxiv).
The orange region in Fig. 2 represents the IPCC’s medium-term Scenario-A estimate of near-term warming, i.e. 1.0 [0.7, 1.5] K (compared with 1990) by 2025.
The IPCC’s predicted global warming over the 25 years from 1990 to the present differs little from a straight line (Fig. T2).

Figure T2. Historical warming from 1850-1990, and predicted warming from 1990-2100 on the IPCC’s “business-as-usual” Scenario A (IPCC, 1990, p. xxii).
Because this difference between a straight line and the slight uptick in the warming rate the IPCC predicted over the period 1990-2025 is so small, one can look at it another way. To reach the 1 K central estimate of warming since 1990 by 2025, there would have to be twice as much warming in the next ten years as there was in the last 25 years. That is not likely.
But is the Pause perhaps caused by the fact that CO2 emissions have not been rising anything like as fast as the IPCC’s “business-as-usual” Scenario A prediction in 1990? No: CO2 emissions have risen rather above the Scenario-A prediction (Fig. T3).

Figure T3. CO2 emissions from fossil fuels, etc., in 2012, from Le Quéré et al. (2014), plotted against the chart of “man-made carbon dioxide emissions”, in billions of tonnes of carbon per year, from IPCC (1990).
Plainly, therefore, CO2 emissions since 1990 have proven to be closer to Scenario A than to any other case, because for all the talk about CO2 emissions reduction the fact is that the rate of expansion of fossil-fuel burning in China, India, Indonesia, Brazil, etc., far outstrips the paltry reductions we have achieved in the West to date.
True, methane concentration has not risen as predicted in 1990 (Fig. T4), for methane emissions, though largely uncontrolled, are simply not rising as the models had predicted. Here, too, all of the predictions were extravagantly baseless.
The overall picture is clear. Scenario A is the emissions scenario from 1990 that is closest to the observed CO2 emissions outturn.

Figure T4. Methane concentration as predicted in four IPCC Assessment Reports, together with (in black) the observed outturn, which is running along the bottom of the least prediction. This graph appeared in the pre-final draft of IPCC (2013), but had mysteriously been deleted from the final, published version, inferentially because the IPCC did not want to display such a plain comparison between absurdly exaggerated predictions and unexciting reality.
To be precise, a quarter-century after 1990, the global-warming outturn to date – expressed as the least-squares linear-regression trend on the mean of the RSS and UAH monthly global mean surface temperature anomalies – is 0.28 Cº, equivalent to little more than 1 Cº/century. The IPCC’s central estimate of 0.71 Cº, equivalent to 2.8 Cº/century, that was predicted for Scenario A in IPCC (1990) with “substantial confidence” was approaching three times too big. In fact, the outturn is visibly well below even the least estimate.
In 1990, the IPCC’s central prediction of the near-term warming rate was higher by two-thirds than its prediction is today. Then it was 2.8 C/century equivalent. Now it is just 1.7 Cº equivalent – and even that is proving to be a substantial exaggeration.
In 1995 the IPCC offered a prediction of the warming rates to be expected in response to various rates of increase in CO2 concentration:

Figure T4a. IPCC (1995) predicted various warming rates. The prediction based on the actual rate of change in CO2 concentration since 1995 is highlighted.
The actual increase in CO2 concentration in the two decades since 1995 has been 0.5% per year. So IPCC’s effective central prediction in 1995 was that there should have been 0.36 C° warming since then, equivalent to 1.8o C°/century.
In the 2001 Third Assessment Report, IPCC, at page 8 of the Summary for Policymakers, says: “For the periods 1990-2025 and 1990 to 2050, the projected increases are 0.4-1.1 C° and 0.8-2.6 C° respectively.”
Is the ocean warming?
One frequently-discussed explanation for the Great Pause is that the coupled ocean-atmosphere system has continued to accumulate heat at approximately the rate predicted by the models, but that in recent decades the heat has been removed from the atmosphere by the ocean and, since globally the near-surface strata show far less warming than the models had predicted, it is hypothesized that what is called the “missing heat” has traveled to the little-measured abyssal strata below 2000 m, whence it may emerge at some future date.
Actually, it is not known whether the ocean is warming: each of the 3600 automated ARGO bathythermograph buoys takes just three measurements a month in 200,000 cubic kilometres of ocean – roughly a 100,000-square-mile box more than 316 km square and 2 km deep. Plainly, the results on the basis of a resolution that sparse (which, as Willis Eschenbach puts it, is approximately the equivalent of trying to take a single temperature and salinity profile taken at a single point in Lake Superior less than once a year) are not going to be a lot better than guesswork.
Unfortunately ARGO seems not to have updated the ocean dataset since December 2014. However, what we have gives us 11 full years of data. Results are plotted in Fig. T5. The ocean warming, if ARGO is right, is equivalent to just 0.02 Cº decade–1, equivalent to 0.2 Cº century–1.

Figure T5. The entire near-global ARGO 2 km ocean temperature dataset from January 2004 to December 2014 (black spline-curve), with the least-squares linear-regression trend calculated from the data by the author (green arrow).
Finally, though the ARGO buoys measure ocean temperature change directly, before publication NOAA craftily converts the temperature change into zettajoules of ocean heat content change, which make the change seem a whole lot larger.
The terrifying-sounding heat content change of 260 ZJ from 1970 to 2014 (Fig. T6) is equivalent to just 0.2 K/century of global warming. All those “Hiroshima bombs of heat” of which the climate-extremist websites speak are a barely discernible pinprick. The ocean and its heat capacity are a lot bigger than some may realize.

Figure T6. Ocean heat content change, 1957-2013, in Zettajoules from NOAA’s NODC Ocean Climate Lab: http://www.nodc.noaa.gov/OC5/3M_HEAT_CONTENT, with the heat content values converted back to the ocean temperature changes in Kelvin that were originally measured. NOAA’s conversion of the minuscule warming data to Zettajoules, combined with the exaggerated vertical aspect of the graph, has the effect of making a very small change in ocean temperature seem considerably more significant than it is.
Converting the ocean heat content change back to temperature change reveals an interesting discrepancy between NOAA’s data and that of the ARGO system. Over the period of ARGO data, from 2004-2014, the NOAA data imply that the oceans are warming at 0.05 Cº decade–1, equivalent to 0.5 Cº century–1, or rather more than double the rate shown by ARGO.
ARGO has the better-resolved dataset, but since the resolutions of all ocean datasets are very low one should treat all these results with caution.
What one can say is that, on such evidence as these datasets are capable of providing, the difference between underlying warming rate of the ocean and that of the atmosphere is not statistically significant, suggesting that if the “missing heat” is hiding in the oceans it has magically found its way into the abyssal strata without managing to warm the upper strata on the way.
On these data, too, there is no evidence of rapid or catastrophic ocean warming.
Furthermore, to date no empirical, theoretical or numerical method, complex or simple, has yet successfully specified mechanistically either how the heat generated by anthropogenic greenhouse-gas enrichment of the atmosphere has reached the deep ocean without much altering the heat content of the intervening near-surface strata or how the heat from the bottom of the ocean may eventually re-emerge to perturb the near-surface climate conditions relevant to land-based life on Earth.

Figure T7. Near-global ocean temperatures by stratum, 0-1900 m, providing a visual reality check to show just how little the upper strata are affected by minor changes in global air surface temperature. Source: ARGO marine atlas.
Most ocean models used in performing coupled general-circulation model sensitivity runs simply cannot resolve most of the physical processes relevant for capturing heat uptake by the deep ocean.
Ultimately, the second law of thermodynamics requires that any heat which may have accumulated in the deep ocean will dissipate via various diffusive processes. It is not plausible that any heat taken up by the deep ocean will suddenly warm the upper ocean and, via the upper ocean, the atmosphere.
If the “deep heat” explanation for the Pause were correct (and it is merely one among dozens that have been offered), the complex models have failed to account for it correctly: otherwise, the growing discrepancy between the predicted and observed atmospheric warming rates would not have become as significant as it has.
In early October 2015 Steven Goddard added some very interesting graphs to his website. The graphs show the extent to which sea levels have been tampered with to make it look as though there has been sea-level rise when it is arguable that in fact there has been little or none.
Why were the models’ predictions exaggerated?
In 1990 the IPCC predicted – on its business-as-usual Scenario A – that from the Industrial Revolution till the present there would have been 4 Watts per square meter of radiative forcing caused by Man (Fig. T8):

Figure T8. Predicted manmade radiative forcings (IPCC, 1990).
However, from 1995 onward the IPCC decided to assume, on rather slender evidence, that anthropogenic particulate aerosols – mostly soot from combustion – were shading the Earth from the Sun to a large enough extent to cause a strong negative forcing. It has also now belatedly realized that its projected increases in methane concentration were wild exaggerations. As a result of these and other changes, it now estimates that the net anthropogenic forcing of the industrial era is just 2.3 Watts per square meter, or little more than half its prediction in 1990 (Fig. T9):

Figure T9: Net anthropogenic forcings, 1750 to 1950, 1980 and 2012 (IPCC, 2013).
Even this, however, may be a considerable exaggeration. For the best estimate of the actual current top-of-atmosphere radiative imbalance (total natural and anthropo-genic net forcing) is only 0.6 Watts per square meter (Fig. T10):

Figure T10. Energy budget diagram for the Earth from Stephens et al. (2012)
In short, most of the forcing predicted by the IPCC is either an exaggeration or has already resulted in whatever temperature change it was going to cause. There is little global warming in the pipeline as a result of our past and present sins of emission.
It is also possible that the IPCC and the models have relentlessly exaggerated climate sensitivity. One recent paper on this question is Monckton of Brenchley et al. (2015), which found climate sensitivity to be in the region of 1 Cº per CO2 doubling (go to scibull.com and click “Most Read Articles”). The paper identified errors in the models’ treatment of temperature feedbacks and their amplification, which account for two-thirds of the equilibrium warming predicted by the IPCC.
Professor Ray Bates gave a paper in Moscow in summer 2015 in which he concluded, based on the analysis by Lindzen & Choi (2009, 2011) (Fig. T10), that temperature feedbacks are net-negative. Accordingly, he supports the conclusion both by Lindzen & Choi (1990) (Fig. T11) and by Spencer & Braswell (2010, 2011) that climate sensitivity is below – and perhaps considerably below – 1 Cº per CO2 doubling.

Figure T11. Reality (center) vs. 11 models. From Lindzen & Choi (2009).
A growing body of reviewed papers find climate sensitivity considerably below the 3 [1.5, 4.5] Cº per CO2 doubling that was first put forward in the Charney Report of 1979 for the U.S. National Academy of Sciences, and is still the IPCC’s best estimate today.
On the evidence to date, therefore, there is no scientific basis for taking any action at all to mitigate CO2 emissions.
Finally, how long will it be before the Freedom Clock (Fig. T12) reaches 20 years without any global warming? If it does, the climate scare will become unsustainable.
 Figure T12. The Freedom Clock approaches 20 years without global warming
Reply to Bellman’s 0932 am post above: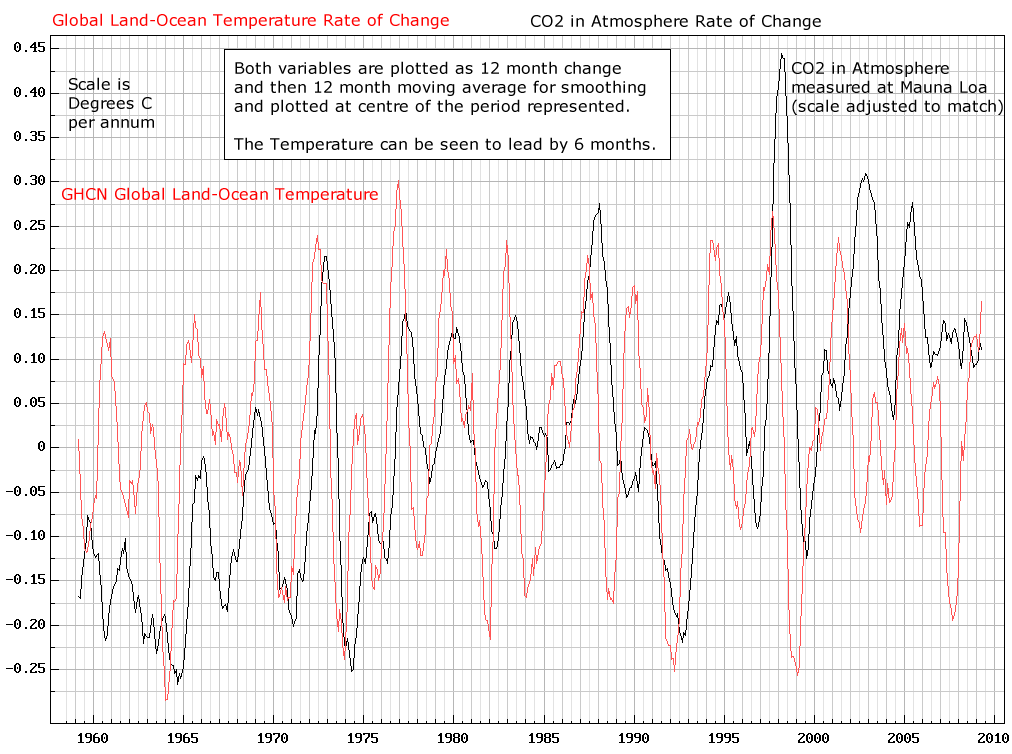
*Sigh*, every time some noob shows up with the same tired old talking points, we have to straighten them out.
Listen up, Bellman. That chart is an overlay. It does not show cause and effect.
The only charts anyone has ever posted here are either overlays, or they show the only verifiable causation:
∆CO2 is caused by ∆temperature.
Here’s just one example:
Got plenty more if you like. Just ask.
Next, @dcp, who asserts:
Still no theories about mechanisms to support your assertions. That’s okay, I know there aren’t any.
You don’t know nearly as much as you think you do. For example, you still don’t know that skeptics of a conjecture like CO2=cAGW have nothing to prove. But you do, and you’ve failed pretty miserably. Wake me when you can produce a measurement quantifying AGW. Until then, you’ve got nothin’ but hand-waving.
dbstealey:
Could you expand on that? Are you saying that all the rise in CO2 over the past century was caused by the rise in temperature?
This is Werner Brozek responding. I just want to let you know that there is a huge controversy on this point. But this only applies to the last 150 years. Ferdinand Engelbeen believes that the whole rise from 280 ppm to 400 ppm is due to man. Many agree with that. Others say we either cannot know, or that temperature is a large part of it. Many posts have been devoted to this topic!
dbstealey :
I think the problem with that graph is that CO2 changes have been shifted down. In fact regardless of the small changes in the rate of increase, CO2 has been steadily increasing year on year. Here’s what it looks like if both deltas are given the same zero point:
So, yes changes in temperature do affect the rate of the rise in CO2, the graph does not demonstrate what causes the steady rise in CO2.
Bellman says:
Are you saying that all the rise in CO2 over the past century was caused by the rise in temperature?
No, I’m not saying that all the rise in CO2 is caused by the rise in global temperature (T). Nor am I saying that none of the rise in global T was caused by the rise in CO2. Human emissions are the likely cause of most, if not all of the rise in CO2. And yes, CO2 has a warming effect.
Almost all the warming effect from CO2 occurred within the first few dozen ppm. But at the current ≈400 ppm, CO2 has only a minuscule effect. Global warming from CO2 at current concentrations is too small to measure. Even if CO2 doubled from current concentrations, we still couldn’t measure the resulting warming. It would still be too small to measure.
On all time scales from years, to hundreds of millennia, the causation is clear: ∆T is the cause of ∆CO2. There are numerous data-based charts showing this cause and effect. Here are just a few:
http://www.brighton73.freeserve.co.uk/gw/paleo/400000yearslarge.gif
On a multi-year scale, the WoodForTrees database shows the same causation: ∆CO2 is caused by ∆T.
Here is another chart showing the same cause and effect:
(Look at the “Note” in the center-left part of the chart. Click in charts to embiggen)
For years I have been asking for someone, anyone, to post a chart showing the opposite causation: that changes in CO2 cause changes in global T. But so far, no one has ever been able to produce such a chart. The only charts ever posted are overlays, which do not show cause and effect.
As stated, I think CO2 has a warming effect. But at current concentrations the warming is minuscule. It is certainly too small to measure, because there are no empirical, testable measurements of AGW.
I have more charts showing that changes in temperature cause subsequent changes in CO2. Ask if you’d like to see them.
What about this one that you posted here:
http://wattsupwiththat.com/2016/02/10/the-profiteers-of-climate-doom/#comment-2142593
http://www.woodfortrees.org/plot/rss/from:1998/plot/rss/from:1998/trend/plot/esrl-co2/from:1998/normalise/offset:0.68/plot/esrl-co2/from:1998/normalise/offset:0.68/trend
Werner,
Different issue, different chart. That is an overlay, but the question wasn’t about cause and effect; there obviously is no measurable effect. That was my point.
The claim is that ∆CO2 will cause ∆temperature. That chart shows it doesn’t, at least not in any measurable way.
The only measurements available show that ∆CO2 is caused by ∆T.
My point is this, namely that chart shows two things,
∆CO2 is NOT caused by ∆T as well as that
∆T is NOT caused by ∆CO2.
The reason is that the temperature did NOT change, but CO2 went up.
But having said that, I agree with you that in general
some CO2 causes some temperature change and that
some temperature change causes some CO2 change.
However that chart is extremely strong evidence that Ferdinand Engelbeen is totally correct about the fact that over the last 150 years, human emissions are responsible for the great majority of the CO2 increase.
Werner,
I’ve tried to be clear and consistent all along: I agree with Ferdinand Engelbeen. Human emissions are the primary cause of the rise in CO2. But human emissions only started with the Industrial Revolution. ∆CO2 is an anomaly, not a step change like the rise due to human emissions.
I also agree that CO2 causes some slight warming; but so slight that it hasn’t yet been measured. I’ve never said otherwise. And I agree with what Ferdinand Englebeen wrote about CO2 here:
“In my opinion even a doubling would have little impact, as clouds are a negative feedback (while all current GCM’s include clouds as a positive feedback!), thus a doubling of CO2 would have only moderate (and thus globally positive) effects.”
And that goes to the heart of the matter. The rise in CO2 has been harmless, and beneficial to the biosphere. Therefore, the alarmist crowd is wrong.
GREAT!!!
But then you confuse me and others when you say this:
That last statement contradicts Ferdinand Engelbeen. Keep in mind we are just talking about the last 150 years. And of the 120 ppm increase since then, Ferdinand Engelbeen would attribute less than 10 ppm to rising ocean temperatures.
dbstealey:
Yet the chart you just posted showed a doubling of CO2 would result in an increase of 3C.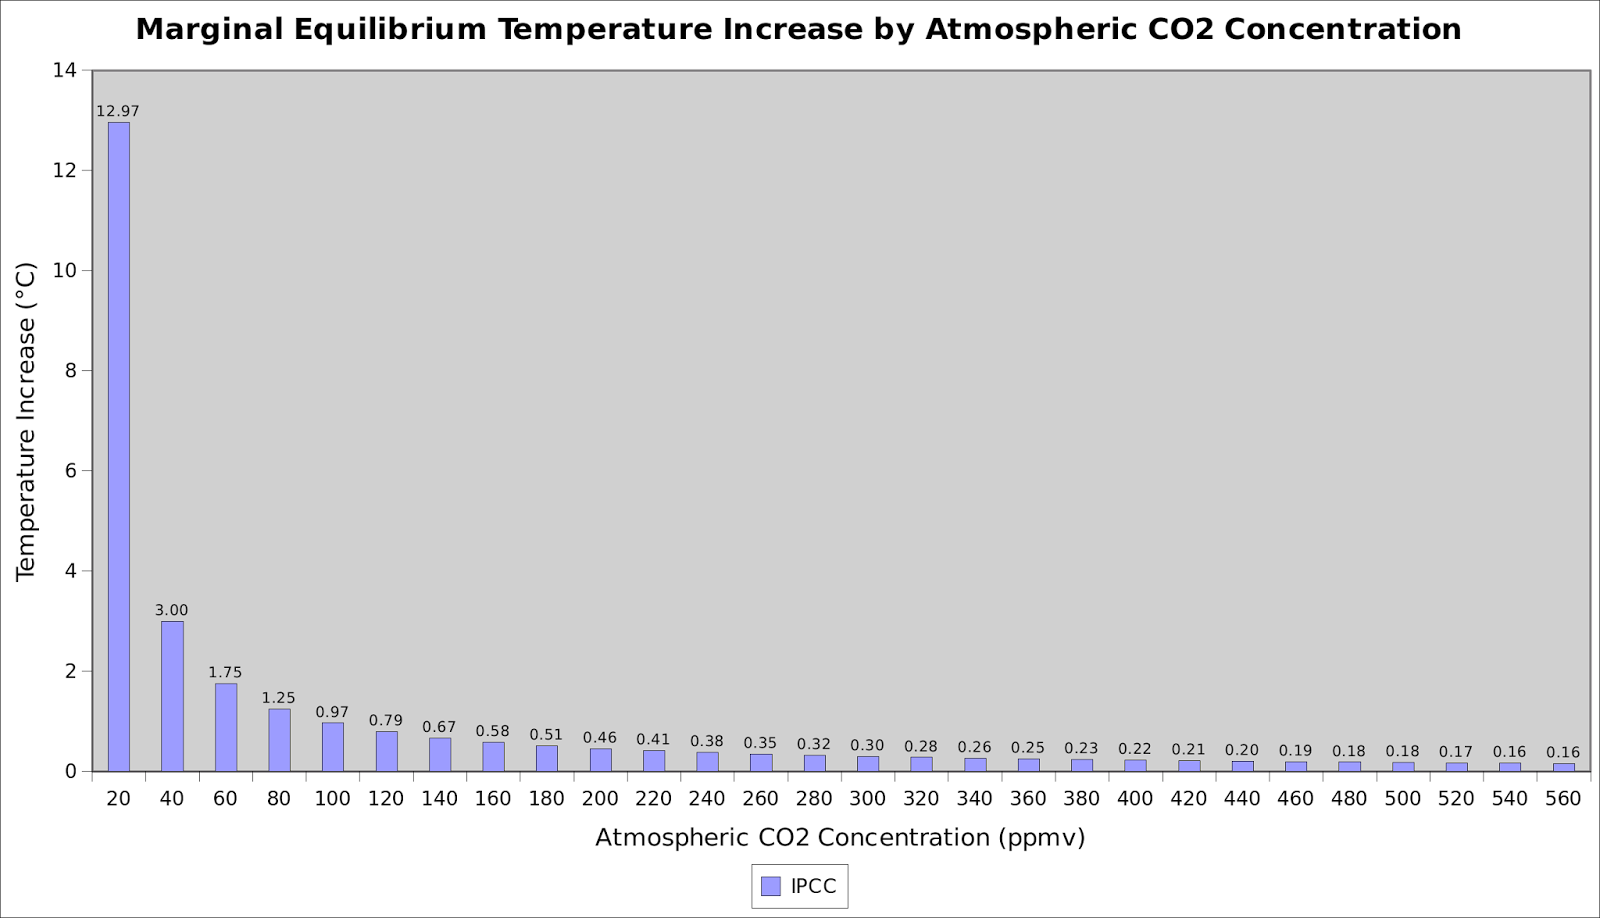
No argument from me about the causation over hundreds of millennia. But, obviously, we haven’t had an industrial revolution before, so wouldn’t expect to see a big increase in CO2 that wasn’t caused by changes in temperature.
http://www.brighton73.freeserve.co.uk/gw/paleo/400000yearslarge.gif
Note that in the above graph the CO2 concentration never goes above 300ppm, even when the temperatures were 2 – 4C warmer than now.
Yet the chart you just posted showed a doubling of CO2 would result in an increase of 3C.
From 400 ppm? No. And where are the charts showing that CO2 is the cause of temperature changes? That is the central belief of the ‘dangerous man-made global warming’ religion. But there aren’t any measurements of AGW. So it’s just a belief, isn’t it? A conjecture.
Yes, from any value.
Maybe you are not understanding the chart, but it shows that an increase from 400 to 420 ppm increases temperature by 0.21C, then an increase to 440 ppm increases temperature by an additional 0.2C, so increasing from 400 to 440 ppm has a cumulative effect of raising temperatures by 0.41C. Increase CO2 to 460 adds another 0.19C.
By the time we reach the end of the chart we see an increase to 560 ppm would increase temperatures by 1.45C from where they were at 400 ppm. Extend this to 800 ppm, and the cumulative increase will be 3C. We know this because it’s a logarithmic chart showing a cumulative constant increase of 3C for each doubling of CO2.
dbstealey, I am confused now as well. You posted two charts here that look the same, but that are out by an order of magnitude as Bellman says.
http://wattsupwiththat.com/2016/02/06/the-pause-hangs-on-by-its-fingernails/#comment-2142944
The top chart has about 0.3 C at 40 ppm, but the bottom one has it clearly labeled as 3.00 C at 40 ppm. Which is right?
Werner,

I also had never noticed that. They’re all slightly different, but that particular one is an outlier. Here, I’ll post all the charts I have that show the warming effect from CO2.
This one will not appear in the comment (because it’s not a .jpg, .gif, or .png), but you can click on it to see it.
Then there’s this one:
http://wattsupwiththat.files.wordpress.com/2010/03/heating_effect_of_co2.png
And this one:
And another one:
The last chart was provided by our alarmist pal B. Gates, and he says it’s from the IPCC. So we can use that one if everyone agrees.
The point isn’t so much the scale, as the fact that almost all the warming takes place within the first few dozen ppm. Adding more CO2 to current levels doesn’t produce any measurable warming.
Bellman says:
Note that in the above graph the CO2 concentration never goes above 300ppm, even when the temperatures were 2 – 4C warmer than now.
Why do you only go back 400K years ago? That’s convenient for your argument. But let’s go back farther; let’s look at the big picture:
http://2.bp.blogspot.com/_cHhMa7ARDDg/SoxiDu0taDI/AAAAAAAABFI/Z2yuZCWtzvc/s1600/Geocarb%2BIII-Mine-03.jpg
The more we look at the claims that CO2 controls global temperature, the weaker that claim becomes. At this point, it’s merely a belief.
CO2 has risen by only one (1) part in 10,000 — over a century. That is what the alarmist contingent is hanging its hat on. That is the entire basis for the “carbon” scare. But as we see, CO2 has been more than fifteen times higher in the past, and without ever causing runaway global warming. Or any verified warming, for that matter.
After making alarming predictions that have been repeatedly debunked, any other branch of science would have abandoned the CO2-cAGW conjecture, which has been falsified over and over. Only in Climate Science™ do we find such ridiculous, self-serving beliefs.
After almost twenty years of no global warming, it’s time to admit that conjecture fails. Anyone taking out the emotion from the arguments is left with the fact that CO2 just does not do as claimed. But of course, religious beliefs are heavily emo-based, so the emotions can’t be taken out. So the alarmist cult simply bypasses the science. And here we are, arguing about a non-problem.
The first three charts were almost identical, but the last was way off. Looking at the increase in temperature expected from 280 ppm to 400 ppm from the last chart, I get 0.30 + 0.28 + 0.26 + 0.25 + 0.23 + 0.22 = 1.54 C. As we know, it only went up by 0.8 C. Furthermore, most of that 0.8 C was due to the fact that we came out of the LIA so the portion of the 0.8 due to our CO2 increase is way less than 0.8 C. So I would not use that last chart again. It assumes a climate sensitivity way higher than our Earth actually shows.
Werner says:
I would not use that last chart again. It assumes a climate sensitivity way higher than our Earth actually shows.
You’re right, I should have been more suspicious when Gates posted it.
And as you point out, the real world is busy falsifying the whole CO2=AGW conjecture. Global warming stopped, so something is wrong with it. Something major.
dbstealey February 12, 2016 at 8:35 pm
Bellman says:
Note that in the above graph the CO2 concentration never goes above 300ppm, even when the temperatures were 2 – 4C warmer than now.
Why do you only go back 400K years ago? That’s convenient for your argument. But let’s go back farther; let’s look at the big picture:
The more we look at the claims that CO2 controls global temperature, the weaker that claim becomes. At this point, it’s merely a belief.
CO2 has risen by only one (1) part in 10,000 — over a century. That is what the alarmist contingent is hanging its hat on. That is the entire basis for the “carbon” scare. But as we see, CO2 has been more than fifteen times higher in the past, and without ever causing runaway global warming. Or any verified warming, for that matter.
More stealey nonsense with ‘charts’, 500 Myears ago when that graph shows 8000 ppm CO2 the temperature was 14ºC above present! Notice the major drop in CO2 accompanying the development of land plants, then the Permian glaciations!
Hey, Phil. is fixated on me! He keeps bird-dogging my comments from the anonymity of the peanut gallery. Back in your kennel, Phil. Good boy.
I keep pointing out the obvious, but A.C. Phil still doesn’t get it: that isn’t my chart. But it does make the point that CO2 is not the ‘control knob’ of the climate.
The A.C. cherry-picked one point in time to try and make his point (8000 ppm CO2 the temperature was 14ºC). Fail. As we see, there is no very long term correlation between CO2 and T:
http://www.biocab.org/Geological_Timescale.jpg
The alarmist crowd keeps posting overlay charts because they can’t find a chart that shows CO2 causing any global warming. That explains their constant deflection. Overlay charts do not show causation, all they show is coincidence.
Because that was the chart you posted.
Which is a rise in CO2 of over 30%. I’d be pretty worried if the CO in my room rose by one part in 10,000.
It was pretty hot 500 million years ago
But the obvious issue with these comparisons is that lots of other things change over these time scales – including the sun getting warmer, changes in earths orbit, and continental drift – which makes any direct comparison difficult.
dbstealey February 13, 2016 at 8:30 am
Hey, it’s the Anonymous Coward who’s fixated on me!
In your dreams! Firstly I post here under my name so I’m not anonymous, however if you choose to define ‘anonymity’ as not using one’s full name then of the four names you’ve used to post here two are anonymous and one was a pseudonym!
I keep pointing out the obvious, but A.C. Phil still doesn’t get it: that isn’t my chart. But it does make the point that CO2 is not the ‘control knob’ of the climate.
Never claimed it was ‘your’ chart, just the one you linked to.
The A.C. cherry-picked one point in time to try and make his point (8000 ppm CO2 the temperature was 14ºC). Fail.
That was your ‘cherry pick”, you said:
“But as we see, CO2 has been more than fifteen times higher in the past, and without ever causing runaway global warming. Or any verified warming, for that matter.
So looking at the high point you chose, 8000ppm, it’s coincident with the highest temperature, 14ºC above present. Yet according to you CO2 that high has never caused any verified warming, you do know what ‘ever’ means don’t you?
Back to the kennel puppy, you can’t hang with the big dogs.
Firstly I post here under my name so I’m not anonymous…
That is not an honest answer. “Phil” is as anonymous as any other first name.
dbstealey February 15, 2016 at 10:32 am
“Phil” is as anonymous as any other first name.
Like DBS, D Boehm and Smokey I guess?
“Phil.”,
Many years ago when Anthony started referring to anonymous cowards who hide behind screen names, I got the message and began using my real name. Unlike you…
“Many years ago”, as I recall it was August 2012, coincidentally ‘Smokey’ stopped posting here just after he accidentally linked to DBstealey’s gravatar! You returned to post anonymously as D Boehm but having been outed you were recognized and you ended the subterfuge and posted as DBoehm Stealey and eventually as dbstealey.
Ah. The anonymous coward is being critical of someone who heard that term, and didn’t want to be associated with it.
And don’t flatter yourself, “”Phil””, no one ‘outed’ me. It was voluntary. If I didn’t want to be myself I’d just pick a new screen name. Maybe “Phil.”…
dbstealey February 16, 2016 at 1:48 pm
Ah. The anonymous coward is being critical of someone who heard that term, and didn’t want to be associated with it.
Well you were happy enough for at least 6 years, since the phrase was in use here since at least 2006 and you posted as Smokey until 2012.
And don’t flatter yourself, “”Phil””, no one ‘outed’ me. It was voluntary. If I didn’t want to be myself I’d just pick a new screen name. Maybe “Phil.”…
As I pointed out you outed yourself by the mistaken link with your gravatar and immediately stopped posting as Smokey, you tried picking a screen name but it didn’t work because everyone knew it was you.
…you outed yourself…
Correctomundo, “Phil”, but…
…by the mistaken link with your gravatar…
Wrong-O, “Phil”.
At the time, I didn’t even know what a gravatar was. I’m not on facebook, either.
I can keep this up as long as you can.
You can go back to cheating the taxpayers now.
LOLOL!!
Anonymous coward “Phil” is keeping logs of my comments! He’s my entourage!
Get a life, puppy. ☺
Running away with your tail between your legs puppy, you got caught out in your lies again.
No need to keep a log, it only takes about 5mins to find it.
LOLOL!!
Since when have I ever run away? And from an anonymous coward like you?? That’s just your projection talking.
But I do love it that you’re spending your work time frantically researching my old comments. It’s good for my ego knowing I have an entourage of (1) one…
…who has to use my own insults. ☺
Anonymous “Phil”, one thing I never do is lie, so that must be your ‘projection’ talking again. I make the occasional misteak, but lie? It’s not in my nature.
Go on back to cheating the taxpayers, that’s what you’re good at.
[Stop the bun fight, both of you. -mod]
Bellman,
CO is not CO2. This is a science site. But I suppose that’s the best argument you can come up with, because the planet certainly isn’t supporting your CO2=CAGW conjecture.
Correct, but it does illustrate that a phrase like has no relevance.
The charts you were discussing earlier show that temperature increases proportional to the logarithm of the CO2 increase, nothing to do with the proportion of CO2 in the atmosphere.
Bellman,
You don’t like the 1 part in 10,000 because it shows just how insignificant the change has been.
You’re the guy who says a tiny rise in CO is dangerous; conflating CO with CO2. Now you’re claiming that 1 part in 10,000 is not a valid metric. Pick only the facts you like…
The Earth’s surface is in a warming trend, somewhat as predicted.
The stratosphere is in a cooling trend, as predicted.
So would not there be a “Goldilocks Layer” in between, with no trend at all?
Could that Goldilocks Layer be the middle troposphere? So “No warming there, forever.”
The earth’s surface is not in a warming trend, as predicted.
Were the AGW hypothesis valid, the planet would have steadily warmed since CO2 took off after WWII. That is precisely what has not happened, all the while CO2 has risen monotonously. from 1945 to 1977, the world cooled dramatically. Then from 1978 to c. 1996, it warmed slightly, Then, from 1997 or so onward, GASTA has stayed flat or again cooled, but slightly. Thus, there is no correlation between steadily increasing CO2 and temperature. Earth has cooled, warmed and stayed the same during the past 70 years of steeply climbing CO2, but only for about 20 of those years was the rising gas associated with warming. By pure accident.
Unless there were factors that effected temperatures in addition to CO2.
Or even facts that affected temperature…
☺
Bellman says:
…a phrase like CO2 has risen by only one (1) part in 10,000 — over a century. has no relevance.
Sure, just pick the facts that you like, and reject the facts you don’t like.
Next, after giving some thought to Wernere’s comment, I think I see the problem. Everyone who puts together the log charts is in agreement; the effect is non-linear. In that respect, the charts all look the same, no matter who produces them.
The problem arises when they arbitrarily assign values to each bar. That’s because there is no agreement regarding the climate sensitivity number, which goes from 3ºC – 6+ºC, depending on who you ask, down to 3ºC, 2ºC, <1ºC, ±0.5ºC, and 0.0ºC (F. Miscolczi). And some argue that CO2 has a cooling effect.
So the sensitivity numbers are meaningless at this point (but if we had verifiable, testable measurements of AGW, we would start to get a handle on the sensitivity number, or at least narrow the range).
But since we don’t know the climate’s sensitivity to CO2, what we are left with is the chart itself. Everyone is in agreement with that part, since all the charts show the same thing: almost all the global warming occurred within the first few dozen ppm.
So we can discard all the fractional degrees at this point. They are nothing but speculation. Anyone can pick the numbers they want. That’s no good. Get rid of the numbers, they only generate pointless arguments.
We are left with real world observations, which indicate that the sensitivity at current CO2 concentrations must be very low: for almost twenty years there has been no global warming despite a large rise in CO2.
What do you think, Werner? Logically consistent?
It is, but only if you think CO2 causes some warming at all.
But as you say
He might not even agree with that.
Then you say
There is some evidence for that for Antarctica.
See:
http://onlinelibrary.wiley.com/doi/10.1002/2015GL066749/full
“We investigated this in detail and show that for central Antarctica an increase in CO2 concentration leads to an increased long-wave energy loss to space, which cools the Earth-atmosphere system. These findings for central Antarctica are in contrast to the general warming effect of increasing CO2.”
Is this cooling also logarithmic?? I have no clue! I just know it is bad and our fault.
It’s probably not logarithmic, the logarithmic response in the lower atmosphere is due to spectral broadening, whereas at the altitudes where emissions from CO2 to space cause cooling the temperature and pressure gives significantly less broadening.
…a phrase like CO2 has risen by only one (1) part in 10,000 — over a century. has no relevance.
Sure, just pick the facts that you like, and reject the facts you don’t like.
The rest of your comment explains exactly why the 1 part on 10,000 is irrelevant. The effect of CO2 is logarithmic, that is for every doubling of CO2 there is expected to be a constant change in temperature. This is the case regardless of what starting point for CO2 you use.
Incidentally, if you think the rise is insignificant, does that also mean that the increased CO2 could not have been responsible for increasing plant growth?
That’s what I’ve been trying to say, all those charts are only showing what would be expected to happen under a given sensitivity. You seemed to be arguing that because you had a chart showing would happen with a sensitivity of 0.3C then that proved the sensitivity was 0.3C.
Note that apart from Miscolczi none of those stated sensitivities is as low as the 0.3C you were claiming.
I’m still not sure I follow your point. More warming would result from rising CO2 from 0 to 300ppm, than from going from 300 to 600ppm, but so what? What matters is how much warming would result from that increase, and that’s just a function of the sensitivity. If by some good fortune the sensitivity is 0.3C, doubling CO2 would result in a rise of 0.3C. If it’s 1C temperatures rise by 1C, if it’s 3C temperatures rise by 3C.
Bellman February 15, 2016 at 8:23 am
Note that apart from Miscolczi none of those stated sensitivities is as low as the 0.3C you were claiming.
“But since we don’t know the climate’s sensitivity to CO2, what we are left with is the chart itself. Everyone is in agreement with that part, since all the charts show the same thing: almost all the global warming occurred within the first few dozen ppm.”
I’m still not sure I follow your point. More warming would result from rising CO2 from 0 to 300ppm, than from going from 300 to 600ppm, but so what? What matters is how much warming would result from that increase, and that’s just a function of the sensitivity. If by some good fortune the sensitivity is 0.3C, doubling CO2 would result in a rise of 0.3C. If it’s 1C temperatures rise by 1C, if it’s 3C temperatures rise by 3C.
In fact using stealey’s last chart the first 20ppm caused 13º increase and another 12º came from the increase to 320 ppm.
“almost all the warming takes place within the first few dozen ppm”, I guess it depends on what ‘few’ means?
Since there has been NO warming for the past 18+ years, sensitivity must be very low.
First, the warming that is supposed to put an end to the pause is only El Nino warming. El Ninos and La Ninas normally alternate because they are part of a giant wave motion from side to side in the Pacific.Whatever warming El Nino brings is the La Nina takes it right back.There are exceptions of course like the El Nino Modoki but by and large El Nino warming is not permanent.
Second, you want to know “…where the surface warming of the past 19 years has come from.” The answer is in this book by Peter Langdon Ward:
“What Really Causes Global Warming? Greenhouse Gases or Ozone Depletion?”
It’s not the greenhouse gases, he says. His Figure 3.3 on page 37 is extremely persuasive of his argument. There are numerous other edxcellent graphs in the book, well planned and skilfully explained. You don’t have to agree with his thesis to profit from his artwork.If there is a typo or two you can step over them. The one most noticeable to me was the switch of wavelengths between visible red and blue colors. I am not finished with this book yet and will have more to say about it later.
Bellman says:
The effect of CO2 is logarithmic…
Anonymous ‘Phil.’ doesn’t agree with that, he says spectral broadening explains it. Also, I have never asserted that CO2 causes warming. I’ve always said that ‘I think’ it does. And I do. The problem is, there are no corroborating measurements. So the CO2=AGW belief is still just a conjecture. Certainly the real world is not acting as if CO2 causes global warming. There’s no difference in the rising temperature steps from recently, or from before the Industrial Revolution. Occam’s Razor, the Null Hypothesis, and the Scientific Method all lean against that conjecture.
Next, ‘Phil’ says:
…I guess it depends on what ‘few’ means?
No, it depends on what “almost all” means. Maybe a better term would be “most” of the warming happens within the first few dozen ppm. Also, there is no agreement on the climate sensitivity number, as I wrote. There’s no ‘consensus’, see? So the best course of action is to disregard the numbers under the bars on those charts. I gave a very good reson for that, too.
Spectral broadening is what causes the effect to be logarithmic, in astronomy it’s referred to as the ‘curve of growth’, look it up. As for ‘a few dozen’, for your graph of 20 ppm increments, just over three dozen is a doubling of the 20 ppm value, just over 6 dozen is another doubling and just over 13 dozen is another doubling……….
Monckton: “If one excludes the data after October 2015, which are temporarily influenced by the current el Niño spike in global temperatures…”
One might exclude the temporary influence of the 1997/98 el Nino to be consistent. How about starting and ending in an ENSO neutral year? That still fails to remove the influence of nearby ENSO event years, but is an improvement.
Of course, the more data, the more statistically sound. 25 years is a good minimum. 30 is better. When considering the uncertainty for the last 18-19 years in satellite data, it could be rapidly warming or cooling, or flat-lining, within the 95% confidence interval. Clearly not enough data to tell.
I just noticed that Bellman wrote:
That’s what I’ve been trying to say, all those charts are only showing what would be expected to happen under a given sensitivity.
OK then, we agree on that. Let’s just eliminate the fractional degrees below the chart bars. They’re only opinions anyway.
The relevant point is that most of the warming has already happened. That’s why even with the recent large rise in CO2, there’s been no global warming for many years.
I think there is AGW; I’ve never said anything else. But it has to be pretty minuscule, or the added CO2 would have pushed up global T. As the great Willis Eschenbach says, CO2 is only a 3rd order forcing, which is swamped by 2nd order forcings. Those, in turn, are swamped by 1st order forcings.
So the “carbon” scare is a false alarm. I’m perfectly willing to change my mind about that. But it would require measurements quantifying AGW, and as of now, there aren’t any. Because the effect is just too tiny.