From the UNIVERSITY OF OTAGO and the “one tree doesn’t work anymore” department:

Uncertainties in tree-ring-based climate reconstructions probed
Current approaches to reconstructing past climate by using tree-ring data need to be improved on so that they can better take uncertainty into account, new research led out of New Zealand’s University of Otago suggests.
Tree growth rings are commonly used as climate proxies because they can be well-dated and the width of each ring is influenced by the climatic conditions of the year it grew in.
In a paper appearing in the Journal of the American Statistical Association, statistics and tree ring researchers from Otago, the US and UK examined the statistical methods and procedures commonly used to reconstruct historic climate variables from tree-ring data.
The research was led by Dr Matthew Schofield of Otago’s Department of Mathematics and Statistics. His co-authors on the paper are departmental colleague Professor Richard Barker, Professor Andrew Gelman of Columbia University, Director of the Tree Ring Lab at Columbia Professor Ed Cook, and Emeritus Professor Keith Briffa of the University of East Anglia, UK.
Dr Schofield says that their approach was to explore two areas where currently used approaches may not adequately account for these uncertainties. The first area involves the pre-processing of tree-ring data to remove non-climate related factors believed to be largely unrelated to climate effects on tree growth. Such factors include tree age, as the older a tree gets the less wide its rings tend to grow.
“This is convenient to do and the resulting tree-ring ‘chronologies’ are treated as relating to only the climate variables of interest. However, it assumes perfect removal of the non-climatic effects from the tree-ring data and ignores any uncertainty in removing this information,” Dr Schofield says.

The second area of uncertainty the researchers studied involves the particular modelling assumptions used in order to reconstruct climate from tree rings. Many of the assumptions are default choices, often chosen for convenience or manageability.
“This has made it difficult to evaluate how sensitive reconstructions are to alternate modelling assumptions,” he says.
To test this sensitivity, the researchers developed a unified statistical modelling approach using Bayesian inference that simultaneously accounts for non-climatic and climatic variability.
The team reconstructed summer temperature in Northern Sweden between 1496 and 1912 from ring measurements of 121 Scots Pine trees.
They found that competing models fit the Scots Pine data equally well but still led to substantially different predictions of historical temperature due to the differing assumptions underlying each model.
While the periods of relatively warmer and cooler temperatures were robust between models, the magnitude of the resulting temperatures was highly dependent on the model being used.
This suggests that there is less certainty than implied by a reconstruction developed using any one set of assumptions.
###
Since the press release didn’t link to the paper or give the title, I’ve located it and reproduced it below.
A Model-Based Approach to Climate Reconstruction Using Tree-Ring Data
http://www.tandfonline.com/doi/abs/10.1080/01621459.2015.1110524
Abstract
Quantifying long-term historical climate is fundamental to understanding recent climate change. Most instrumentally recorded climate data are only available for the past 200 years, s o proxy observations from natural archives are often considered. We describe a model-based approach to reconstructing climate defined in terms of raw tree-ring measurement data that simultaneously accounts for non-climatic and climatic variability. In this approach we specify a joint model for the tree-ring data and climate variable that we fit using Bayesian inference. We consider a range of prior densities and compare the modeling approach to current methodology using an example case of Scots pine from Torneträsk, Sweden to reconstruct growing season temperature. We describe how current approaches translate into particular model assumptions. We explore how changes to various components in the model-based approach affect the resulting reconstruction. We show that minor changes in model specification can have little effect on model fit but lead to large changes in the predictions. In particular, the periods of relatively warmer and cooler temperatures are robust between models, but the magnitude of the resulting temperatures are highly model dependent. Such sensitivity may not be apparent with traditional approaches because the underlying statistical model is often hidden or poorly described.
The full paper is here (open access, my local backup here::Schofield-cook-briffa-modeling-treering-uncertainty (PDF)) and the supplementary information is here:.uasa_a_1110524_sm7673 (PDF)
At the end of the paper they say this, which is worth reading:
Message for the paleoclimate community
We have demonstrated model-based approaches for tree-ring based reconstructions that are able to incorporate the assumptions of traditional approaches as special cases. The modeling framework allows us to relax assumptions long used out of necessity, giving flexibility to our model choices. Using the Scots pine data from Tornetr¨ask we show how modeling choices matter. Alternative models fitting the data equally well can lead to substantially different predictions. These results do not necessarily mean that existing reconstructions are incorrect. If the assumptions underlying the reconstruction is a close approximation of reality, the resulting prediction and associated uncertainty will likely be appropriate (up to the problems associated with the two-step procedures used). However, if we are unsure whether the assumptions are correct and there are other assumptions equally plausible a-priori, we will have unrecognized uncertainty in the predictions. We believe that such uncertainty should be acknowledged when using standardized data and default models. As an example consider the predictions from model mb ts con for Abisko, Sweden. If we believe the assumptions underlying model mb ts con then there is a 95% probability that summer mean temperature in 1599 was between 8.1 ◦C and 12.0 ◦C as suggested by the central credible interval (Figure 4(a)). However, if we adopt the assumptions underlying model mb ts spl pl we would believe that the summer mean temperature in 1599 may have been much colder than 8.1 ◦C with a 95% credible interval between 4.1 ◦C and 7.8 ◦C. In practice, unless the data are able to discriminate between these assumptions (which they were not able to do here as shown in Section 6), there is more uncertainty about the summer mean temperature in 1599 than that found in any one model considered. We believe that such model uncertainty needs to be recognized by the community as an important source of uncertainty associated with predictions of historical climate. The use of default methods makes evaluation of such uncertainty difficult.

Question. What do you get when you cross a bad surface temperature station with a bad tree proxy? Answer…..
A. Paper mache science models
B. Sticks for hockey
or C. None of the above for purposes of science
As someone who grows a wide range of trees I am not even a little convinced you can get useful temp data out of treerings. There is a wide range of variables to grow a tree well. Even just the lay of the land the tree is growing in can have a massive difference in outcome. as well as spacing. You have a bunch of crammed trees and one with space, the one that has more space will grow much better and look like the outlier when most of the other trees would have been as vibrant if they also had adequate room (light, competition for nutrient and water etc) So even if the assumptions you pick end up fitting with reality you will almost certainly be building un forseen biases into your methodology when you take those assumptions and apply it to a set of trees from a different era or area. (or species etc etc) Trees also appear to take time to “bounce back” from the extremes. not as relevant with all species in all areas but a places like the high desert where I live trees will grow slower even if in optimum conditions for a few years after SPRING dry periods. They really want that water specifically in spring here. A few weeks off even if it ends up very wet will leave the trees in a much slower growing state. Which means you could have what was overall a wet year with the rains being sparse at a key time in the year make the records look like it was cool for several years in a row when it might have been unusually warm and even wet the whole time. I highly doubt you could ever quantify all these variables when we only have the trees themselves in many cases as a record where a wide range of variables can show up as the same data.
This goes the other way as well. You can have good spring water and a marginal year overall and the high desert trees will be doing very well. Im not sure how this could be a measurement for temp at all when it wont even tell you how much water it got, main factor being water in a very specific time frame. couple that with how differently trees grow based on their spacing and Id be only slightly less likely to believe you have magic powers then an accurate temp line out of tree rings.
randy,
While I can’t speak for everyone involved, I want the most accurate (and precise) results possible. That qualifier at the end is key. Something else I want is results based on multiple lines of evidence, which is even more key.
I commend you on your gardening prowess, something which I lack in spades. It so happens my freshman biology prof was a botanist by trade, and he’d probably turn over in his grave if he knew how much of his flora-centric lectures I’ve forgotten, or that I couldn’t keep a plant alive if my own life depended on it. One thing I did retain is that plants are sensitive to many other environmental factors than temperature. I don’t wish to overtly offend here when being mildly rude should suffice, but I think it’s preposterous to imply that dendroclimatologists know less than an avid arborist and an ex-biology student who grew up to be a database programmer instead. Just sayin’.
Magic would be pretty much the only resort, and I don’t think it would work very well. You presume no other information, which is curious. Have you actually read MBH98?
http://www.meteo.psu.edu/holocene/public_html/shared/articles/mbh98.pdf
Any works since then?
True, but again you make presumptions about methods which aren’t well-founded. Schofield et al. here make a far more informed critique than either you or I have, and do find that choice of assumptions and model affect results. Unlike you, they do not conclude, “holy cow, this crap is completely useless!”
No, that last point does not put the whole field to bed for me. Data are data, so if I have a proxy which only tells me three months out of the year, that’s still three months I wouldn’t otherwise have. We do have better off-season proxies, ice cores come to mind, and for what it’s worth, they’re quite popular with dbstealey (he really likes Alley (2000) for some reason). They, however suffer from poor spatial and temporal resolution as compared to tree rings, which give very nice annual resolution and are found across much more of the landscape than ice, which tends to melt annually where trees grow.
It would be nice to have all the data we want, at whatever arbitrarily high precision and resolution we could reasonably (or unreasonably) demand, but we don’t. In the scenario where indicators are sparse and — relative to modern instrumentation — imprecise, chucking aside every proxy which doesn’t meet our exacting standards pretty much winds up with us having nothing to go on at all.
Individually, all proxies are relatively weak indicators. In concert, their consilience allows stronger conclusions. You really need to read MBH98. It’s not hard to notice that it ain’t all about treemometers. I daresay one would have to deliberately attempt to miss that fact.
I’ve not ever read a paleoclimate paper that does not contain estimated uncertainties, no matter what mix of proxies were used. They often say their conclusions are “robust” but that does not mean “totally accurate”.
Next time you catch a dendro researcher testifying to Congress, “I think we should look at the tree data, they’re the best data we have”, then you can shove that under my nose and let me smell the hubris. Then I might actually agree with you that it smells like BS.
The only thing tree rings can tell is how beneficial the climate was for the type of trees investigated.
If a good climate or bad climate is the same for humans is not known. And it is not at all defined what a good climate for humans is, so it is all up to some creative peoble to to make up their own assumptions, and they all end up in that it is worse than we thaught, because that’s what makes headlines.
Where are the papers that scientifically defines what influences the variation in tree rings?
I have not seen them, but they may exist.
Svend, I’m sure everyone involved in tree ring analysis is well aware of the possible variables that affect growth, of which there must be a great many. Unfortunately, it seems confirmation bias tends to sway both research direction (in this case as temperature proxies) and of course any findings or conclusions.
As far as I recall, (as it is from many years ago) – initial tree ring works were primarily for dating and cross matching pieces of timber from archeological digs? (but I may be wrong?). Wasn’t the objective to have crossover tree ring measurements from ‘current’ or known ‘cut’ aged trees, overlaid with gradually older and older trees from the same region so that eventually a long but local ‘sequence’ of annual tree ring growth could be used as a template to date older timbers? In any event, I don’t recall them initially being used as actual proxies for anything ‘directly’, other than obvious periods when growth was good or was stunted (as you say)! The assumption of temperature, rainfall, soil erosion, whatever, type effects appears to have been an ‘added’ bonus to tree ring analysis, despite the numerous possible combinations of variables they may actually display.
I too would like to see the science behind the proxy derivations – but based on what I have seen to date, it seems mostly on assumptions and statistical modeling! Then again, even the surface datasets are proxies in ‘real’ scale terms, and of course, are subjected to rigourous (sorry, perhaps tortuous?) statistical treatment!
Kev-in-Uk
Yes.
Archeologically, the tree rings were (still are!) absolutely invaluable in dating the objects buried at the same levels (or below) the wood relics “dated” by their tree rings. Dendrochronology, as mentioned above and below by others earlier. It’s very accurate on a year-by-year basis.
Also, Once a tree ring sequence can be dated, then its carbon 14 decay sequence can be calibrated for many years of carbon rings. Once that is done, then any wood item from nearly any “recent” archaeological (human-built) dig can be used to date the items around the wooden remnant. (You don’t need a wood item with visible and unique “tree rings” you only need a small part of the wood itself.) Now, carbon 14 decays rapidly, so they can’t go too far back with it, but it is a very important start. And a bridge to other technologies.
It would be hard to convince me that tree rings can be used for anything other than getting a rough idea of what the growing season was at the time they were formed.
The idea that you can narrow it down to temperature (as opposed to growing conditions) is a stretch and the idea that you can get any kind of useful accuracy out of them is (IMHO) absurd.
Models are not reality …. Models are not Theory …. Models are simplistic metaphors which may or may not be directionally useful.
The idea of a treemometer is faintly ridiculous. Tree rings typically vary from one side of a tree to the other. Which side is the thermometer?
Even when comparisons can be made, the correlation is much greater to CO2:
@dbstealey
that’s interesting – but how does anyone know (as in with a reasonable degree of certainty)? I mean, why/how has it been deduced that correlation to CO2 is better than to temperature? what about rainfall, sunlight, flooding, etc, etc. It kind of strikes me that unless you know the detailed climatic and geological conditions around a specific tree location (being analysed) you still have to make inferences about what the changes may mean?
If I take a medieval deciduous forest, for example, and then imagine that a bunch of Vikings moved in and stripped out all the Pine (birch/whatever ?) trees, leaving, say, the Oaks behind, surely that would have an effect on the remaining Oaks growth (more sunlight) – but unless you have detailed knowledge of the ‘local’ changes, you could (in a palaeo sense) assign those changes to CO2, rainfall, temperature or whatever – and you’d potentially be wrong? So how would you be able to know? Ok, so tis is an anthropogenic example, but you get the point. I get it that many proxies can be cross correlated, but local effects MUST be different and could be themselves cross related. So for example, Greenland presumably would have been logged when the Vikings got there, and the ring growth in some trees (left standing) would be shown to be good due to increased sunlight, etc- this therefore does not automatically reflect the MWP. So, even as a AGW skeptic (who accepts the MWP), I find that tree rings are difficult to accept as real proxies in any direct demonstrable sense. Dunno if I’ve explained it well enough – but anyway thats just my view…
Hi Kev-in-UK,
You asked:
…why/how has it been deduced that correlation to CO2 is better than to temperature?
My answer: I don’t know. The bar graph I posted has references to a lot of peer reviewed papers (at the bottom of each bar). I’ve not read them. I don’t put much stock in that methodology. Maybe it works. Like you, I think there are better proxies.
I was only trying to show that CO2 matters more than temperature. I agree with you that all those other variables matter, too. I’ve read comments here from readers who have observed that trees grow much faster when adjoining trees are removed, and similar situations. So yes, very local changes can make a big difference. Like you said, who knows what happened back then?
I think tree rings are only being discussed because they’ve been so mis-used as temperature proxies. Mann’s and Briffa’s treemometers purport to measure fractions of a degree nearly a thousand years ago. I have a very hard time taking that seriously.
When Mann put together his bogus hockey stick chart, he was attempting to erase the MWP and the LIA. Anyone who thinks that was honest in the least has no moral compass. And of course, falsus in uno, falsus in omnibus. They keep promoting the lie because it has brought them fame, fortune, expense paid holidays in choice locations, pats on the head as their university’s rainmaker, and all kinds of feel-good feedback.
They’re still being dishonest. I have no doubt they know it, too.
Great! There seems to be a growing “consensus” that the data underlying most of this science doesn’t past the smell test. It’s time to stop arguing around the fringes and go right for the heart of this thing.
1. They can’t measure the Earth’s temperature now.
2. They can’t claim that they can measure the temperature from 75 years ago.
3. They have no way of knowing that the “proxy data” has any meaning at all.
4. Feel free to substitute CO2 in the above. It is the same situation.
dbstealey,
I suppose it is if one insists that plant growth isn’t sensitive to temperature.
Alcohol and mercury have different thermal expansion coefficients, yet both have been successfully used in thermometers.
Even when comparisons can be made? You just got done saying that the idea of a treemometer is faintly ridiculous. And you top it off by implying that correlation is causation. You’re slipping, mate.
For sake of argument only, let’s suppose that temperature and CO2 are the only things which affect tree ring width from year to year. We find that CO2 and tree ring width correlate very well, something which is hardly surprising to people whose business it is studying plants. So we model that relationship, which gives us a prediction of tree ring width for a the level of CO2 in any given year, and subtract that from the actual observed width in that same year. We regress that residual against temperatures from a more accurate and precise source such as a “real” thermometer and use that correlation to build the final model of tree ring width as a function of CO2 and temperature combined. We’ll almost certainly end up with a residual error for predicted tree ring width in the final model, which is an indicator of uncertainty.
In the real world application, there are significantly more confounding factors to the temperature signal we’re looking for, which means we need to use a multi-variate statistical model to suss it out, of which there are many, and many of which were NOT pioneered by dendroclimatologists. What Matthew et al. are saying is that results are sensitive to which statistical model is used, which is another indication of uncertainty in the results.
None of this is either mysterious or particularly surprising. I agree with others here who have said in effect that it is good and proper science for the dendro community to be self-skeptical of the robustness of its own results as they have been here.
Gates,
Those are some of your sillier arguments.
dbstealey,
That’s one of your lamest “rebuttals”. But thanks for playing.
Gates,
I didn’t think it was necessary to explain, but I’m on the side of those who think ‘treemometers’ are about the least accurate temperature instruments in creation (treelines excluded). You’re on the other side of the argument, for the simple reason that you promote the Mannian narrative. I’ll leave it at that, because the winner of this particular argument is obvious to even the most casual observer.
Gates, I realize that you specialize in changing the subject rather than actually arguing for comprehension, but even by your low standards, the above post was pathetic.
Everyone recognizes that temperature affects tree growth. The issue is, as it has always been, the fact that there are many things that affect tree growth and it is impossible to tease temperature alone out of the data.
Your second point about thermal coefficients is totally unresponsive to the question. The question asked about growth rates, not thermal expansion. Such stupidity should be embarrassing, but it’s obvious that your devotion to your religion has rendered you incapable of such human emotions.
Third point, no he’s not moron. He’s just commenting that from time to time the gods of randomness line up and tree rings manage to match the temperature record. He said nothing about whether that match up was meaningful or just a temporary correlation.
That’s a fine case for arguing that tree rings roughly reflect the favorability of growing conditions, which include CO2 and warmth (among others). It is certainly not an argument that you can determine the historic temperature record to a tenth of a degree in a certain location.
It’s ridiculous on the face of it.
dbstealey,
Your premise that my comments were “silly” implies that I at least require an explanation.
I don’t categorically disagree with you on that point. They do have the advantage of discrete annual temporal resolution which cannot be said of other proxies, not even ice cores.
You’re on the other side of the argument, for the simple reason that you disparage the Mannian narrative. Zero-sum argument.
The more casual the better, apparently. Try again.
MarkW,
Maybe so …
Read this again: In the real world application, there are significantly more confounding factors to the temperature signal we’re looking for, which means we need to use a multi-variate statistical model to suss it out, of which there are many, and many of which were NOT pioneered by dendroclimatologists.
Difficult does not mean impossible.
Both thermal expansion coefficients of liquids (and/or metals) and tree-ring width are proxies used for estimating temperature. That’s the commonality. The difference is that an alcohol thermometer enjoys a much higher signal to noise ratio (fewer confounding factors), and is therefore a more precise instrument for measuring temperature. It could very well be that one side of the tree is a better proxy for temperature than the other when ring size is significantly different, but we may not know that from just observing that there’s a size differential from one side of the trunk to the other.
The direct response to Stealey’s question, “which side is the thermometer” could conceivably be answered by comparing both sides to the temperature reference and choosing the one which results in the least error. I’m sure there’s quite a bit more to it than that, but I think what I just described the most obvious step.
My daily dose of irony.
Everyone recognizes that temperature affects tree growth.
… or maybe not.
He said: Even when comparisons can be made, the correlation is much greater to CO2
Please don’t move the goalposts and then claim after the fact that I did.
“Difficult does not mean impossible.”
I expect it does in this case actually, assuming you want accurate results. I have grown trees of many species for decades now. I can list factors independent of temps that will have trees growing rather well in a given year or others that can stunt them for several years in a row. With no other data besides the tree rings how in the world could you tell which of many factors lead to good or poor growth? Magic? statistical analysis might make you believe you have good data, but you cant separate different variables that cause the same things from eachother just because you decided your model had merit.
What about the other 6-9 months of the year? In my area its 8-9 months a given ear with no tree growth, what then? spring and summer temps to NOT directly correlate to what fall and winter temps will be. This last point by itself should put the whole field to bed.
We dont have ANY data for 3/4 of the year and a dozen variables can alter the trend for the period we do have data but we totally got accurate results!!! pffft. MAGIC!!!
Gates,
My reply on 1/27 @12:24 above was concise and to the point. I’m not adding anything to it here, but I note that as usual you parse everything interminably.
Give it up. You lost. If you keep arguing it’s just because martyrs will die to be right.
Brandon
Real world vs BS, you are the great misdirector but you are just a bunch of BS in the end
Gates is at odds with everyone because he’s an oddball. I really don’t understand why he posts his endless, nitpicking, rambling, endless comments. He convinces no one of anything. It just looks like he’s trying to convince himself.
Brandon Gates:
You wrote saying to dbstealey
You had already had several explanations upthread including my own.
I cannot imagine why you claim that dbstealey should add to the explanations of why your daft comments were “silly” when you have ignored all the other explanations that detail why your comments were silly.
Richard
Thanks, Richard. But I think we’re dealing with a hopeless case of eco-religious true belief.
dbstealey,
Circular, and again so very ironic, anti-consensus boi.
Yes, that is quite evident.
You shouldn’t be so hard on yourself, DB. When you’re done with the playground taunting and have an actual argument to make, do let me know.
richardscourtney,
I read it. I thought it included a couple of decent points, the best one one of which (confounding factors) I explicitly acknowledge in my own posts.
However, along those lines, this was not one of your better statements: And the real situation is worse than the described random case because it is not reasonable to assume that temperature has so large an effect that it overwhelms all the other variables which affect growth of tree rings.
It’s not at all necessary to assume that temperature is the dominant effect on ring width for the proxy to be useful. It would be nice, as such a case would benefit the signal to noise ratio. As it is, the strongest conclusion I would make is that temperature being among the weaker correlates increases uncertainty of the resulting temperature reconstruction. This is essentially what Schofield et al. argue by appealing to experiment instead my rather limited perspective as a layperson:
They found that competing models fit the Scots Pine data equally well but still led to substantially different predictions of historical temperature due to the differing assumptions underlying each model.
While the periods of relatively warmer and cooler temperatures were robust between models, the magnitude of the resulting temperatures was highly dependent on the model being used.
This suggests that there is less certainty than implied by a reconstruction developed using any one set of assumptions.
THAT is a compelling argument against the expressed certainty of prior dendro studies, and I AM listening to it.
You on the other hand, end on a howler …
Simply, the fact that dendrochronology works is clear evidence that dendrothermology does not work.
… which is, like, the mother of all non sequiturs. It’s logically possible that dendroclimatology/dendrothermology is so uncertain as to be practically useless — here we have a paper making a good case for such a possiblility — but your above statement simply doesn’t follow from any of your stated premises. Since your final conclusion is fallacious, your entire argument must be wrong.
See, I can “prove” by non sequitur too. How well do you commend my effort?
Gates quotes me:
Simply, the fact that dendrochronology works is clear evidence that dendrothermology does not work.
In bold, too. The problem is, I never said that.
Gates also uses this old chestnut to try and keep his treemometer argument on life support::
Alcohol and mercury have different thermal expansion coefficients, yet both have been successfully used in thermometers.
So real thermometers are the same as treemometers? That’s the silliness I was referring to when I got Gates all spun up.
dbstealey,
I know, but Richard did, emphasis in the original. In the future, I’ll not double-up replies in a single post so as to avoid your somewhat understandable cornfusion.
dbstealey,
Don’t be silly.
Well I’m happy that you enjoy giving me a good chuckle. Let’s try word substitution:
dbstealey (original): Tree rings typically vary from one side of a tree to the other. Which side is the thermometer?
dbstealey (modified): Thermal expansion typically varies from one material to the another. Which one is the thermometer?
dbstealey (caricatured): If we evolved from monkeys, why are there still monkeys?
Transparent disingenuity isn’t your best color, I’m afraid.
My bottle of Courvoisier was a poor thermometer because of other factors.
I’ll drink to that.
[hic]
Brandon Gates:
Yes, in an above post I explained that
In common with all my posts, I provided those facts and the accompanying explanation in good faith. Your psychological projection is offensive: your posts not being in good faith does NOT mean others behave as you do.
And my explanation was clear. Its conclusion is the ONLY possible logical deduction.
A statement is NOT a non sequitur whenever you cannot copy kit from SkS.
Richard
richardscourtney,
No it isn’t the only possible logical deduction, but is a logical possibility. Not one to be discounted, to be sure; however multivariate statistical inference does not strictly require a signal to be the most powerful for it to be predictive. It should go without saying that the stronger a signal relative to others, the less uncertain its predictive ability. It IS necessary to be able to reasonably control for confounding factors in any multivariate analysis, especially when the desired variable has among the weakest signals of the others.
Your best avenue of attack here is on how well those confounding factors have been controlled for, not that they exist.
Red herrings and ad hominem arguments are another form of non sequitur fallacy. If you want to make this about people, not arguments, it behoves you to not establish such patterns.
If I recall correctly, and I may not as I am getting older, wasn’t it Briffa who originally wasn’t comfortable in the way they were using his data and stated as much. Wasn’t he ignored by Trenberth and Mann so they could go about with their AGW “proofs”?
That’s my recollection as well.
Paleoclimate temperature proxy screening for thermometer correlation (such as it is) should be done before deciding to use it, not after.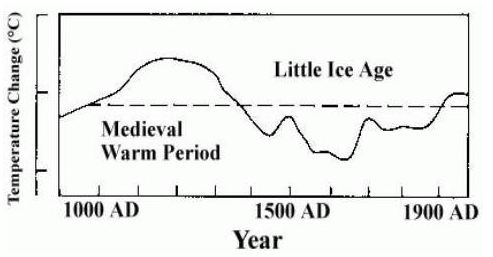 ?w=500
If say 90% of many random samples of a likely proxy show correlation then the proxy may be a valid, maybe.
Temperature proxy reconstructions purporting to show greater precision (not accuracy) than Lamb is false precision IMHO.
Forgive the mangled syntax.
Chris Hanley,
I agree with that.
I don’t agree with that, and I don’t think you would either if you consistently applied that rule to all physical sciences. Surely you would not argue that we should only accept the precision AND accuracy for the gravitational constant implied by Cavendish’s experiments with an apparatus that is relatively crude compared to modern estimates using other more precise and accurate methods and equipment? Would you prefer the Copernicus model for planetary motion to Kepler? For high gravity/high velocity orbital situations, would you prefer Netwon’s laws of motion to Einstein’s general relativity?
Was readable for me. Forgive me if I have misunderstood.
Precision: When it predicts yes, how often is it correct?
Gates has admitted up thread that he comments here just create havoc and disrupt the discussion. Why don’t you all just ignore him?
I’ve heard this argument about the Newtonian v Relativity before and it is starting to annoy me.
Firstly, Newtonian gravitation works beautifully, specifically because it is wrong! And Newton himself expressed concern about the problem of gravity acting instantaneously across infinite distance. Relativity of course, requires gravity to propagate no faster than light.
Even for orbital calculations involving the Earth and Sun this issue is real and intractable. The Sun is 8 minutes away at the speed of gravity but Newtonian orbital calculations that do take the lag into account decay and become unstable. The Einsteinian calculations involving the warping of space/time are complex but work out to a reasonably close approximation of the answer obtained by assuming instantaneous action at a distance. And it is not because it is a small error, it is because large factors almost cancel out in the relativity calculations.
The point is that Newtonian gravitation is a better tool for calculating the real than it is for modelling it. And this distinction, fine though it may be, is very important!
Bill Partin,
That’s some pretty creative reading. You wouldn’t perchance be willing to provide an actual quote?
Depends on whom you ask, prevailing theme is that my “disinformation” needs to be rebutted so that nobody is “fooled” by it. Sort of an insult to other people’s intelligence if you ask me, but then again I’m not exactly above having a similar attitude. In fact, I rather expect Stealey to wander by at any moment and tell me I’m projecting again. It’s so funny when he does that.
You’re projecting again. ¯\_(ツ)_/¯
Scott Wilmot Bennett,
Par for this course. Having used that analogy recently on a different thread I thought to leave it out and let the other ones stand, but it’s a personal fav.
Imagine Michael Mann saying that about treemometers.
Newton was highly intelligent. Had he and Einstein come in reverse historical order, I don’t have much doubt each would have filled the others’ shoes quite admirably.
If you say so. Every analogy does have its breaking point. You’ve quite whistled past it already, but are now entering territory which suggests even fundamentally broken models can still be useful. Not really sure you want to go there.
At risk of going completely OT, this actually interests me and I don’t mind exploring it since it’s quite likely I don’t properly understand some key limitation of general relativity. It would help me to start very simply, so: suppose a perfectly spherical cow with the mass of the Sun, homogeneous density, no rotation about any axis, and a NASA weather satellite on a non-intersecting trajectory. Gravity is the only relevant force between these two bodies.
I say Netwon fails more as the sat gets deeper into the gravity well because his formulae don’t properly account for space/time distortion. I also say that Einstein doesn’t fail because the scenario I propose implies a constant gravitational field, and we therefore don’t have to account for any lag time in the propagation of gravity.
I also don’t think in cases where we do have to account for lag time — say, a gravity “slingshot” scenario involving a massive central object, much smaller planets and teeny space probe — necessarily confounds general relativity either, but Newton would be in even worse shape than the first scenario.
Agree/disagree with either/both/none?
My analogy is not meant to knock Newton. Einstein did once allegedly sort of say that all models should be simple as possible, but no simpler. When the simpler model works better for a particular application, I don’t think Einstein would have a problem with it. My understanding is that NASA uses Newton for LEO, Einstein for interplanetary.
There might be a climate modelling moral to that argument as well, but I could also be straining analogies past breaking.
The interesting statement about this paper is that it freely (and correctly) admits that a best estimate of historical temperature has a (almost) 4°C spread — a FOUR degree Celsius range — useless for comparing modern temps to past temps, s it is three times the size of the total estimated difference between the coolest temps of the Little Ice Age and the warmest temps claimed for 2015.
Lots of folks here are making the general claim that tree rings are not good proxies for temperature. Here is one inescapable conclusion: these folks have never looked at any of the better examples of trees tracking temperature, and most likely have never looked at any of the pertinent data at all.
Matt Skaggs
An accusation. Not accurate nor complete, but it is an accusation.
How ’bout you show the ONE Yamal tree core sample chosen from that entire forested peninsula, and duplicate the analysis for us in toto to show us exactly how that one tree ring can be considered accurate and complete.
Duplication, after all, is the key to “scientific” thought and proof. See,
Here is one inescapable conclusion: EVERY ONE of these folks
have neverhas looked in detail at ALLlooked at any ofthe better examples oftrees trackingtemperature proxies worldwide from the year 900 through 2100, andmost likely have never looked at any of the pertinent data at allhave found NO correlation nor collaboration with ANY tree ring thermometers at all.I would also say similar, that those that think they are accurate thermometers probably never grew that many trees. Certainly not in a marginal area. Where I live an early frost will stunt growth overall for the year regardless of overall temps. Actually will be hindered the next year as well. Could be a wet year overall but without good water in early spring your trees wont grow well that year. Did a population of nitrogen fixing plants move into the area for part of the trees life? what about soil biota? I started playing with this variable recently in my work, can make a huge difference. Even if we have trees in line with temps over a given area, this simply tells me no other factors over road temps in that particular area and period. How can I say that with assurance? reread the above. I can list a whole range of other variables that also would greatly affect growth having zero to do with overall temps. Surely you dont suggest they can tell which variables caused good or poor growth years based on a single variable, tree ring width. It isnt magic it is statistical analysis.
Most of the folks here appreciate just how much the growth of a tree is dependent on other things apart from temperature, but thanks, to you and a few others, for the extra knowledge on how bad a proxy it is.
But wait !! The Earth is flat !! sarc…It is truly sad how many people listen to this fool !
http://www.theguardian.com/music/2016/jan/26/flat-earth-rapper-bob-neil-degrasse-tyson-diss-track
Now we know where Obama voters come from !! Sigh !
Naomi Oreskes (currently of Harvard and previously of UCSD) must be having a bad karma month. She stridently preaches for climate scientists to be much less conservative and less restrained in their study findings; she want aggressive claims of significant and harmful global warming from fossil fuels She wants them to more be a lot more bold and risk taking in their words and acts about how it is shockingly worse than we previously thought and concluded. She wants ramping up of on the edge activism by previously conservative scientists who found some global warming from fossil fuels. But recently a few scientists are doing the opposite of what she preaches.
A few days ago we saw Mann climb down to a very slightly more conservative approach to calculate probabilities of how much warming by anthropogenic fossil fuel burning there has been. He found less probability than the media reported last year. That was very un-Orestes-like behavior for Mann.
Now we have Briffa and his associates finding significant inherent previously unreported statistical uncertainties in models producing paleoclimate studies. Their findings have significant implications that GCMs endorsed by the IPCC suffer the same. That was very un-Oreskes-like.
Remember December 2015 had some bad karma for Oreskes. Publically Oreskes was frantically ranting against Hansen that he was endorsing plentiful energy via nuclear when Oreskes wanted bold and non-conservative advocacy for a society with green renewable to replace existing fossil source which really meant she wanted a lot less energy available for the planet’s sake. Hansen was very un-Orestes-like.
Poor Oreskes, seems like a bad karma domino effect is possibly in progress. She really gives the perception of being a frantically irrational inciter of invalid thinking on the subject science focused on climate.
John
The long Glibbering Climb Down continues.
CAGW/CC/GCD.
Oh sorry, our scientists mislead us.
It used to be chicken or sheep entrails, now it is Dendrochronology
Dendrochronology is OK.
It tells you when.
But it doesn’t tell you hot, cold or wet
‘Most instrumentally recorded climate data are only available for the past 200 years’
There is no such thing as “climate data.” We have weather data.
The growing season in Northern Sweden is very short. Whatever tree rings tell you, it only refers to maybe a quarter of a year each.
Scots pines live 500+ years ?!?!
Being somewhat old as I am and have planted many trees over my life time.I have news for these tree researchers. It has been my experience that trees have good and bad years, totally independent from temperature, it is the rain fall they get, good rain big ring. Idiots all.
Having spent a lot of time on these issues, in my opinion, this article totally failed to discuss the most interesting statistical issues in developing tree ring chronologies from measurement data – though not for the reasons that concern commenters above.
Andrew Gelman, one of the coauthors, is a very competent and serious statistician and it is extremely disappointing that he did not recognize that the development of tree ring chronologies is related to mixed effects/random effects – a point on which I’ve commented on many occasions at Climate Audit. Random effects are a technique that is well known to the wider statistical community and Gelman himself and it would have been extremely interesting to see an insightful commentary.
Had Briffa and dendro coauthors understood the problem, then Gelman could undoubtedly have made an more insightful contribution. Definitely an opportunity missed.
My above comment relates to chronologies. The main interest in the article is the connection between a chronology and a temperature reconstruction, where uncertainties have traditionally been wildly underestimated by the dendro community, who have typically used standard errors in an overfitted calibration period to estimate uncertainty. Schofield et al sensibly point to the very large differences between equally plausible reconstructions as representative of the true uncertainty. Unsurprisingly, this sort of point has long been made at Climate Audit and it’s gratifying to see its belated recognition by statistical specialists.
Liked the thinking in this paper until reaching equation (3). Climate variable apparently assumed independent normal rv’s. Having made the good point that techniques being used do not take adequate account of climate variation, not a terribly good idea then to use a very poor model for climate time series. At the very least, some autocorrelation, surely?
Come on now! It is better than reading tea leaves. …… I mean isn’t it ?
Chic Bowdrie,
I’m tired of scrolling to find the reply button, so this response posted out of sequence.
Yes. I thought we’d already agreed on that so your comment confused me. No worries, I confuse LW and SW at times myself.
Thermalization to a LW non-emitter like N2 or O2. In the 1D model, when collisions cause a photon to get burped back out of a CO2 (or H2O, CH4 or other “GHG”) it has a 50/50 chance of going up or down. Both mechanism have the effect of reducing radiative loss to space. Think of it this way: what if the entire atmosphere was a “window” like we see in the 8-9 and 10-13 micron bands?
So funny, you just asked me to think about the same thing I asked you to think about. I have thought about it, and the rough estimate goes like this. With no atmosphere, the full 341 W/m^2 at TOA in the K&T cartoon would hit the surface, 30% would be reflected away due to albedo, leaving 238.7 W/m^2 absorbed SW. It follows then that at (pseudo-)equilibrium, outgoing LW would be the same at the surface. Plugging into Stefan–Boltzmann:
Yes I get it that none of the evidence I’ve presented — or that you’ve found on your own — meets your personal standard of “proof” ….
… so, ok, “prove” it to me like you want me to substantiate my own case for you.
Yes, at TOA and at steady state equilibrium, outgoing LW should exactly match incoming SW. Nobody whom I think properly understands the Official IPCC (TM) definition of radiative forcing disputes this.
I tire of qualifying adjectives. Its stated uncertainty is +/- 0.4 W/m^2.
Show your work?
Read what I wrote again — they’re BOTH increasing. According to theory, GHG warming should cause minima to rise faster than maxima, so if I take a “mean” from the min/max, I may very well be introducing a cooling, not warming, bias.
Here’s the plot:
http://mesonet.agron.iastate.edu/onsite/features/2009/07/090731.gif
Isn’t that interesting. I wouldn’t be able to give an answer just staring at the plot. I’m pretty sure someone like Gavin Schmidt would say something like, “yes, that’s why we create monthly climatologies over a 30 year baseline for computing anomalies”.
I do know where to look to test some stuff: http://www.esrl.noaa.gov/gmd/grad/surfrad/
Sub-hourly data for all kinds of fun things, including up/down SW and LW flux, relative humidity, wind speed, barometric pressure, etc., in addition to air temperature. I already have data for 4 stations through most of 2015. You’ve just given me the perfect excuse to dust it off and do some “experiments” I hadn’t already thought of, for which you have my most sincere thanks.
No argument, Chic, but I protest that your arguments are getting somewhat lopsided again: the satellites don’t even give us a min/max for any given location. At best you get several scans per day over roughly the same regions, especially near the poles but not so much in the tropics. Don’t get me wrong: I think it’s important data to be gathering — but the Gold Standard of temperature estimates? No, I don’t think that’s obviously defensible.
Me too, and I think it’s because we’re talking past each other.
I completely agree with that and was already there.
Again, I agree. My argument is: IF calibration doesn’t drift, and all we care about is the trend, precision matters more. I’m not disagreeing with you about all else, just making a … well, possibly overly-pendantic … additional point.
Exactly. Like I said, the absolute temperature does not matter when what we care most about is the trend — or in this case, non-macro-climatic biases to the trend.
NO kidding! I said nothing about biases not affecting trends, nor anything about ALL biases getting ironed out automagically by anomaly calculations and/or pairwise homogenization algorithms.
Well … we already do. I wasn’t talking about that, because I read wrongly …
… your actual argument, for which I apologize. So as far as surface station data go, USCRN is one such effort. I’m sure there are others I don’t have at my fingertips. A Dutch/German scientist of my (blogging circuit) acquaintance — whose name it is somewhat verboten to mention here — blogs about such experiments, as well as surface station homogenization in general. Makes for interesting reading if you’re so inclined.
Unfortunately, I don’t share your optimism on that point for the general case, but might very well be true of you. “Why” I don’t think so in general is a short essay (which for me means half a book), and this post is already way too long (even after editing out over 3/4 what I originally wrote). Cheers.
Brandon,
Good idea to move the thread down.
I want to summarize the state of our arguments with a view to winding them down. The first half is dealing with understanding the basic atmospheric physics. It has been helpful to me to review for myself and learn where you are coming from. I’d like to continue with that a bit more, although it is off topic for this thread.
The other discussion we’re having concerns the OP on uncertainty which we’ve managed to segue into whether or not surface measurements are more accurate than satellite measurements. Then we got off on the precision vs. accuracy argument. I’m done with the latter, but I’m interested in finishing the other tangent, our discussion of bias.
I think we both understand the absorption emission process. But here you’re missing the big picture. Neither mechanism reduces radiative loss to space. Incoming equals outgoing. Either mechanism warms the surface by providing an insulation or resistance compared to no atmosphere. The question remains whether increasing CO2 has any more effect than it already has.
Assuming that’s a std dev, it is coefficient of variation of 67%. That’s a lot of uncertainty. But considering how relatively few measurements of ocean temperatures are made, I wonder how it comes out that low.
0.0013/4 = 0.00325 K/yr estimate for satellite lower troposphpere warming trend.
0.0017 * 2 = 0.0034 K/yr estimate for sea surface warming trend.
0.00325/0.0034 = 1.0 meaning sea surface and atmosphere could be in near equilibrium warming at the same rate.
If both are increasing, you are right. For now, don’t conflate the reason for the difference with the measurements detecting it. That way we are looking at trends to see what they say. IOW, if the high and low are both truly increasing and the low is truly increasing faster, that is not a bias being introduced by the measurements.
As I said, I’m not yet knowledgeable enough to assert that sats are better in spite of your kind efforts to educate me. I’m just trying to sort out how to judge and for that I thank you.
At the risk of being equally pedantic and unnecessarily furthering this argument, if we knew there were no drifts, there would be nothing to argue about.
Something bothers me about that, but let me end with this:
Surface measurements use high-low averages. High-low averages generally result in warmer than true daily temperatures. If the bias introduced by these high-low averages increases with time, then the resulting trends calculated from those daily averages are warmly biased. Satellite methodology may or may not introduce bias into daily temperature readings. If satellite daily temperatures were not biased, then trends calculated from those satellite measurements would be accurate and unbiased. Surface measurement trends greater than satellite measurement trends may or may not be correct depending on whether surface high-low average temperature bias increases with time and whether satellite measurements are equally biased.