Guest essay by Ed Hoskins
Summary: By 2014 European Union countries had invested approximately €1 trillion, €1000,000,000,000, in large scale Renewable Energy installations.
This has provided a nameplate electrical generating capacity of about 216 Gigawatts, nominally about ~22% of the total European generation needs of about 1000 Gigawatts.
The actual measured output by 2014 from data supplied by the Renewables Industry has been 38 Gigawatts or 3.8% of Europe’s electricity requirement, at a capacity factor of ~18% overall.
However Renewable Energy production is dependent on the seasons, local weather conditions and the rotation of the earth, day and night.
So the Renewable Energy contribution to the electricity supply grid is inevitably erratic, intermittent and non-dispatchable. It is therefore much less useful than dispatchable sources of electricity, which can be engaged whenever necessary to match demand and maintain grid stability. That 3.8% Renewable Energy contribution to the grid is often not available when needed and obversely its mandatory use can cause major grid disruption if the Renewable Energy contribution is suddenly over abundant.
Accounting for capacity factors the capital cost of these Renewable Energy installations has been about €29billion / Gigawatt. That capital cost should be compared with conventional gas-fired electricity generation costing about €1billion / Gigawatt.
The whole 1000 Gigawatt fleet of European electricity generation installations could have been replaced with lower capital cost Gas-fired installations for the €1trillion of capital costs already expended on Renewable Energy in Europe.
In spite of their being virtually no costs for fuel, Renewable Energy installations can still cost up to 1.5 – 2.5 times as much to operate and maintain as conventional Gas Fired plant.
When the capacity percentages are taken into account, the capital costs can be 15 – 50 times greater than Gas Fired plant.
Data Sources
Recent publications with data up to the end of 2014 have been used here. These organisations are either neutral towards Renewable Energy (US EIA) or actively promote it (EurObservER).
- US EIA electricity_generation.pdf 2015 Table 1
- EurObservER-Wind-Energy-Barometer-2015-EN-2.pdf
- EurObservER-Photovoltaic-Barometer-2015-EN.pdf
These publications give an up to date indication of the current state of comparative data for the capital and running costs of different means of Energy generation, both Renewable and Fossil fuel based as well as Renewable Energy costs in Europe . These illustrated notes are derived from the combination of these two up to date data sources.
The US EIA data provides a useful yardstick for comparative costing and level of investment committed. The comparative measure of US$ / Megawatt hour is used. The US$ and the Euro are close to parity and used interchangeably here for cost estimation.

Major European installations
This note concentrates on the seven European Nations with significant commitments to Renewable Energy. They account for more than 80% of European renewable investment. Denmark is included in this analysis because of its preeminent position as a developer and supplier of Wind Power technology.

The following diagram shows the percentages of contribution for both solar and wind power in Europe. The preponderance of PV Solar power in Germany at 44% of the total european installation is very clear.
Comparable Electrical Generation effectiveness
The EurObservER data give the current base of Renewable Energy installations measured in Megawatts and annual output by country in Gigawatt hours and also the actual installed level by three types of generation:
- Onshore Wind Power
- Offshore Wind Power
- Grid connected Solar PV
The annual output in Gigawatt hours can be reduced to actual equivalent productive generation by dividing the output GWhr value by 8760, (365 * 24). This value is then used to assess capacity by comparing the actual generated output in Gigawatts with the nameplate value of the renewable installed generating sets.
The EurObservER data does not distinguish the output generated by Onshore and Offshore Wind Power but groups the outputs for both Wind Power types. In general one would expect Offshore Wind Power to be rather more productive than Onshore installations even though Offshore has more onerous operating and maintenance expenditures at in excess of 30% capacity for offshore installations as opposed to about 20% for onshore Wind Power installations.
As the current EurObservER data does not distinguish between the generated outputs of Onshore and Offshore Wind Power, an overall Wind Power capacity figure of about 21% results from their data.
The aggregate (Wind Power and PV Solar) productive capacities for the six European Nations are shown below and compared to conventional generating technologies.

The variations of efficiency between the seven European Nations shown above between arises as a result of:
- their level of commitment to Solar energy as opposed to Wind Power: Overall in Europe Wind Power has a capacity percentage of ~22% as opposed to Solar energy of only ~12%
- their latitude, Solar power being significantly less effective in Northern Europe.
Accordingly German Renewable installations perform at only ~13% overall. They are by far the least performant in Europe because of their heavy commitment to Solar Energy at Northern latitudes. Germany is followed by Italy with a more Southerly position but still with a heavy commitment to Solar Power.
Overall in Europe Renewable Energy is about 5 times less efficient (Energy Produced / Nameplate Capacity) than when fossil fuels are used, i.e. a capacity percentage of about 18% overall as opposed to some 85%.
The scale of Renewable installations and approximate capital costs
The EurObservER data from 2014 is charted below showing the nameplate installations of different forms of Renewable Energy

And the actual Electrical output generated according to the EurObservER data is shown below.

It is estimated that 1 Gigawatt of gas-fired generating capacity costs about €1000,000,000 and the proportional capital costs derived from the EIA data is used to estimate the approximate capital costs of the European Renewable installations. Accordingly the distribution of estimated capital investment totalling more than €1 trillion is shown below.

These prices are estimated using the EurObservER reported nameplate capacity combined with the EIA differential values for capital costs. No account is taken of the detrimental capacity factors applicable to Renewable Energy installations, i.e. operating at about 1/5 of rated nameplate capacity.
National commitments to Renewable Energy installations in Europe
The comparative commitments to Renewable Energy according to the data across Europe is shown as Megawatts installed / million head of population below.
Unsurprisingly Germany and Denmark are pre-eminent, whereas the UK and France have only achieved about a quarter of their levels of penetration. In France which already has the lowest CO2 emissions levels/head of population in the developed world (substantially less (~60%) than China) because of its commitment to Nuclear electrical generation, the installation of Renewable Energy (Wind Power and Solar) in France would seem to be particularly costly and pointless.

The full gamut of European national commitments to renewable Energy in terms of Megawatts of nameplate generating capacity per million head of population is shown below.
Scoring cost effectiveness in Operation
The US EIA data makes comparisons in terms of $ / Megawatt hour. These data have been combined with capacity data derived from the EurObservER reports, i.e. 21.8% for Wind Power overall and 12.1% for Solar Power.
For comparative purposes these $/MW hr values are normalised comparing them to the EIA Gas-Fired generation cost and the readjusted to account for the capacity factors recorded. A fuel cost for Gas firing is about 50% more than than that for Coal.
This results in normalised comparative scores for both the Capital cost and Operation and Maintenance costs. Using the EIA base data the Operation and Maintenance costs are marginally more for Onshore Wind and about double for both Offshore Wind and Solar Power. On the other hand the capital cost scores range from 14 times onshore wind to almost 50 times for Solar energy.

When the capital and running costs are combined on the EIA basis, Renewable Energy comparative cost scores are 4 times higher for onshore wind and up to 12 times greater for both Offshore wind and rather more for Solar Power. Coal and nuclear power are shown as the a useful comparison.

Conclusions
To date about € trillion, (€1000,000,000,000), has been spent on the installation of Renewable Energy technologies for electricity generation in Europe.
By Government and EU diktat, this expenditure has been extracted by extra charges imposed on utility bills throughout Europe. Viewed as taxation this is very regressive form: it imposes more burdens on poorer people whilst leaving wealthier people who are able to pay less affected. It is also invisible in Government accounts as a tax income at all, as it is an industry price imposition on consumers.
These regressive “Green taxes” have already lead to significant fuel poverty throughout Europe.
Increased energy costs are also impacting on European industries with many major corporations seeking more congenial manufacturing locations outside Europe to the detriment of the European economies.
As a means of producing useful electrical power Renewable Energy is proven here to be very expensive, not only because its poor ~20% capacity factor but also because it is much less useful to the electrical grid because of its non-dispatchbliliy and inevitable intermittancy.
It is also questionable whether these Renewable Energy industries, when viewed “from cradle to grave”, including manufacturing, site works, installation, connection and demolition costs, does in fact reduce CO2 emissions to any significant extent overall. The CO2 saved may never exceed the CO2 emissions generated to erect the total installation. At t a maximum the use of Renewable Wins and Solar technologies only amounts to about a 4% saving in CO2 emissions in comparison to using Gas-fired power generation,
The USA has made significant CO2 emissions reductions over the past few decades by replacing Coal Fired generation with Gas Fired electricity generation with the feedstock provided by the fracking revolution. It is estimated that using natural gas for electricity generation as opposed coal burning saves about 30% of CO2 emissions. This outcome of this effect has been assessed to have been more effective means of CO2 emissions reduction than all actions worldwide arising from the Kyoto protocol.
The Renewable Energy industry could not exist without the Government mandated subsidies and preferential tariffs on which it depends.
Without Government subsidies and consumption mandates the Renewable Energy industry is not a viable business proposition.
Viewed from the point of view of the viability of a nation’s electrical supply grid, Renewable Energy would never be part of the generating mix without its Government mandate, Government subsidies and Government interference.
As many commenters imply, it is probably naïve to think that government mandated renewable energy targets are for the public good, rather than just another example of furtherance of government control and associated opportunities for corruption through subsidy farming.
I would think that ‘time of day’ power rates or other pricing schemes based on supply and demand would be much more efficient overall. In that case we would likely see the first logical widespread (as opposed to remote sites) use of photovoltaics, namely used as cladding and roofing, supplying power for air conditioning much more in synchrony with the availability of sunshine, the cause of the A/C load in the first place. Thus, owners of factories, large retail spaces etc would produce PV power for their own needs shaving the peak demand (with the highest marginal costs to supply) from the local utility. Properly integrated into the building design, the PV collection systems would in themselves reduce the heat load on the building.
Ed Hoskins,
You wrote: “The US EIA data makes comparisons in terms of $ / Megawatt hour. These data have been combined with capacity data derived from the EurObservER reports, i.e. 21.8% for Wind Power overall and 12.1% for Solar Power.”
If the EIA data are $/MW-hr, then capacity factors have already been taken into account. So how do you combine those numbers with capacity data?
It sounds as if you have double counted.
“With every turn of their blade another subsidy paid,
A disguised redistribution of wealth;
The poor pay higher amounts to fund “green” bank accounts,
Enrichment through environmental stealth….”
http://rhymeafterrhyme.net/enrichment-through-environmental-stealth/
For €1 trillion you would think they would be able to develop commercial fusion technology.
Freeman Dyson’s opinion is that the reason we do not have viable fusion already is that it is funded by governments who have been continually backing the wrong horse. Alternative approaches to laser confinement and tokomac just do not get funded.
In the past I’ve been a big fusion proponent, but recently I have completely switched to thorium. Fusion may be a solution well into the future, but for now thorium would provide us with abundant, safe, reliable, cheap, CO2-free (as if it matters) electricity for centuries.
John,
I am afraid that I just don’t get thorium. It would seem to have all the problems of uranium, plus being harder to do. I see it claimed that it avoids proliferation problems, but you still need a fissionable isotope (U-233) and in any case power reactors are a poor choice for making fissionable isotopes.
The main advantage is the abundance of thorium, in comparison to uranium, and the fact that even Britain could be energy-independent.
R
ralfellis,
“The main advantage is the abundance of thorium, in comparison to uranium”.
Fair enough, but is there a big shortage of uranium? And the main tech for using thorium, molten salt reactors, could be used to burn “spent” uranium fuel, effectively increasing the energy supply from uranium by a factor of 20 or so. So if we don’t get a big breakthrough in solar or fusion, we might well need thorium down the road, but not in the near future.
The key is the molten salt reactor as it solves the weaknesses of PWRs. MSRs burn 99% of its fuel and leaves magnitudes less waste. MSRs being low pressure can’t blow up, don’t need 170 atmosphere plumbing and molten core passively drains into safety tanks; so no need for triple redundant cooling and power systems. With their high thermal heat many industrial processes will benefit. http://www.energyfromthorium.com http://www.egeneration.org
Walt D.,
“Freeman Dyson’s opinion is that the reason we do not have viable fusion already …”
I’d be very interested in that; can you provide a reference or a link?
Back when I was a grad student (more than 3 decades ago) I attended a seminar in which the speaker made a strong case that heavy ion beams were a much better choice than lasers for inertial confinement, but that all the funding went to lasers because of potential weapons applications of very high power lasers.
The Molten Salt Reactor is what Fusion wished it could be, easy to build, 50 year old technology, can’t make bombs and should be 30-40% the cost and half the time to build due to no Pressure dome needed. Should be easy to build on assembly lines like Boeing 777s.
How about publishing a condensed summary of the major points that can be conveyed to our representatives so they can see and understand these “green” energy problems. All they ever see is the media hyping wind and solar.
I don’t know the present state of Xcel’s renewable portfolio, but the last I did know they would figure a capacity factor of one-sixth for purposes of scheduling transmission. One-sixth compares well with the result (18%) of this study. People would like to compare renewables directly to nuclear and fossil fuels, but the huge difference in capacity factor alone makes the comparison difficult for the layman, or people with even less capability, politicians, to comprehend.
Ed Hawkins,
The EIA’s LCOE allowance for transmission cost for renewables seems to low to me. I suspect it is an allowance for the cost of connecting to the existing grid, not the full cost of the additional investments required to manage the intermittent generation. This OECD/NEA report “System effects in low-carbon electricity systems gives the system costs for onshore wind, at 30% penetration, as about US$30/MWh (i.e. 50% of the wind LCOE) for the UK (see Figure ES2): https://www.oecd-nea.org/ndd/reports/2012/system-effects-exec-sum.pdf
Can you comment on what seems t me to be a very significant understatement of the system costs that should be attributed to renewable energy when they become a significant component of total electricity generation?
You need to read How to Fool Americans @ur momisugly https://dddusmma.wordpress.com/2015/06/12/how-to-fool-americans/
That article explains most of the tricks but not all of them. They still use 40 years “life” for a fossil or Nuclear power plant, and ignore that Coal plants that are more than 60 years old are still making a profit after adding all of the Government (Kill Coal) mandates. Most Nuclear will go 60 years and some are looking at 80 years! Those two facts drastically cuts the REAL cost of coal and nuclear below the imaginary propaganda spread by the EIA.
Just to clarify, my question is about the system costs, not the LCOE of the generator technologies in this case.
Cost of 38 MW; 1 $trillion. Cost of “saving the planet”; priceless.
Greeniescam; Who’s in your wallet?
If it is all about “Saving the planet” – Priceless — THEN it would be ZERO CO2 Nuclear which requires ZERO Fossil Fuel backup. Even a high school kid knows that you do not throw half water and half gas on a fire. If CO2 is the real problem Nat Gas only reduces the emissions of Electrical power CO2 emissions by a little more than 50%, Less when load following Unreliable Wind and Solar. Electricity has to be CHEAP to power a major portion of the automobiles, and the kill the coal kill the nuclear attitude is making it more expensive, Get the true facts, not the propaganda. The facts are on the net – but don’t use Google, they drop them to the 10th or twentieth page
Funny, isn’t it, if green energy is so beneficial, as it can make so much money as and industry (i.e., profit) AND deliver non-Earth destroying energy…why are so few people (Algore, come on down!) making so much money, with so little progress being delivered?
Its almost as if…nah, couldn’t be…
“Green energy” … tilting at windmills.
Nah Max, The errant knight was attacking the windmills because they were evil giants bent on destroying the people. He was old school honor bound to stop them! We’ll should not let the greens spoil the good name of thenoble knight our dear Man from LaMancha
Your point is well taken.
As the old joke goes when some fellow is asked how he intends to deal with the fact that he is losing $2 on every widget his business sells he responds, “We’re going to make it up in volume”.
Remember that electricity only accounts for a fraction of total energy consumption.
In the EU last year, wind/solar/bio managed to contribute just 7% of total primary energy.
https://notalotofpeopleknowthat.wordpress.com/2015/06/28/the-bp-energy-review/
BTW – it is also worth noting that, for all their supposed green credentials, in Germany coal still accounts for 25% of primary energy, compared to 16% in the UK,
https://notalotofpeopleknowthat.wordpress.com/2015/07/30/coal-statistics-for-2014/
And it is mostly brown coal – the very worst for pollution. And because Germany’s nuclear plants are all being closed, they are having to use more and more coal.
http://www.theguardian.com/environment/2015/jul/07/brown-coal-wins-a-reprieve-in-germanys-transition-to-a-green-future
What do you mean ‘the very worst for pollution’? Brown coal (which may be black or brown) can be burned cleanly [in] anything designed to burn brown coal. The new twenty-something power plants under construction right now in Germany are all optimised to burn lignite (brown coal).
The “worst pollution” from a coal plant is an old one that has no scrubbers or precipitators. Back in the day coal burners didn’t do a very good job of combustion all the fuel. The fans also blew a lot of the ash into the air. Those days are long gone.
Great idea, lets make investors rich with taxpayer backed guaranteed returns on investment and make energy more expensive for consumers.
And people wonder why the consistently tepid global economy since the financial melt-down. Can’t imagine making energy more expensive could have anything to do with it.
It might make more sense to just burn the money directly as an energy source.
And a few years ago, in Zimbabwe, you could do EXACTLY that!
Russ, I tried several times to buy a ZW$25,000,000,000 note from a few tourists but no one would part with one. Even for real money. I later found out they issued notes worth a much as ZW$10,000,000,000,000.
Just imagine all of the good use that €1,000,000,000,000 could go towards.
Why is hydro-electric not included?
From the US EIA reference (electricity_generation.pdf , 2015):
As people always point out when these levelized cost comparisons are made, assuming a wind turbine will be in service 30 years has never been confirmed in actual practice. There a plenty of thermal (coal, gas, nuclear) plants operating past 30 years old, and of course hydro dams last longer than that (Hoover Dam was opened in 1936 — next year it will have been operating for 80 years). But you can’t find a single wind turbine of 250KW or greater 30 years old and still producing power.
I’ve seen various figures on the proper service lifetime for wind turbines and I have no firm opinion on which one is the most appropriate, but 30 years is off by approximately a factor of 2. So all those charts that show onshore wind is almost as good as combined-cycle gas turbine are total strangers to reality.
ALLAN WATT
I agree with you entirely as per this study The levelized cost comparisons are all wrong and fail to show the true cost of wind turbine option.
Wear and Tear Hits Wind Farm Output and Economic Lifetime
Posted on December 20, 2012 by Lochgelly in Environment with 2 Comments on Wear and Tear Hits Wind Farm Output and Economic Lifetime
The Renewable Energy Foundation today published a new study, The Performance of Wind Farms in the United Kingdom and Denmark, showing that the economic life of onshore wind turbines is between 10 and 15 years, not the 20 to 25 years projected by the wind industry itself, and used for government projections.
The work has been conducted by one of the UK’s leading energy & environmental economists, Professor Gordon Hughes of the University of Edinburgh, and has been anonymously peer-reviewed. This ground breaking study applies rigorous statistical analysis to years of actual wind farm performance data from wind farms in both the UK and in Denmark.
The results show that after allowing for variations in wind speed and site characteristics the average load factor of wind farms declines substantially as they get older, probably due to wear and tear. By 10 years of age the contribution of an average UK wind farm to meeting electricity demand has declined by a third.
This decline in performance means that it is rarely economic to operate wind farms for more than 12 to 15 years. After this period they must be replaced with new machines, a finding that has profound consequences for investors and government alike.
[Comment deleted. commenter using fake identity, deleted per WUWT policy –mod]
I stand corrected.
Well there’s your answer. Stop buying commercially produced wind turbines and get a bunch of volunteers together to design and build them, and the darned things will last. (“I have the strength of ten for my heart is pure”).
Has anybody provided this information to the various government agencies who continue to subsidize commercially produced wind turbines? Sounds like we could get a break.
This is not going to work in the “EU”. There are so many regulations, traps and catches of the ’22’-type the Überkommissars in Brussels and the national regulators have put together that such a solution is not going to be. This solution delivers common-sense-engineered equipment. Unfortunately, common sense is a ‘no-go’ in the overgrowing and stifling bureaucracy of the EU. No way to get it approved. They’d rather fork out subsidies by the trillion than allowing common sense.
Another one of your disingenuous comments. That turbine has only been ‘operating’ for 36 years. They started to build it in 1975. It didn’t start working until 1978.
Over the years it has managed a capacity factor of ~6%. How’s that for inefficiency?
There is no information about how many repairs/upgrades it has had; so, Joel D Jackson, please post a link showing it has never been repaired/upgraded.
(Comment deleted. commenter using fake identity, deleted per WUWT policy –mod)
The same thing is true of thermal plants — recent ones haven’t been in operation long enough to say for certain they will last 30 years, except that we’ve been building thermal plants for long enough to have a pretty good idea of their service lifetimes because most of the technology involved is mature. We’ve been building at least some wind turbines for more than 30 years, as you point out, but very few (ok, greater than none) of them have lasted that long.
It’s quite possible current production turbines will last 30 years; you’d have to to a detailed examination of what has changed in turbine construction from the earlier units and how those changes are expected to improve service lifetime. You’d also have to look at failure rates on 10 and 20 year old turbines.
I don’t believe the EIA did any of these things; they just applied the same capital recovery period to all technologies.
I did an analysis a few years back which showed that an attempt to switch to 100% wind energy by 2050 on the basis of a fixed yearly expenditure (allowing for inflation) would likely not achieve its goal, at least not unless a massive increase in funding occurred over and above the original cost estimate. The issue is that allowing for a 20-year life, by 2030 none of the original turbines installed before 2010 will be serviceable. By 2050, all turbines installed before 2030 will need replacing, and many will have been replaced twice. If you work out what happens from that point on, you see that maintenance and replacement costs eventually soak-up all of your funding, and your rate of increase flatlines.
Of course if the actual service life turns out to be 15 years then the picture becomes substantially worse, with some turbines due for a third replacement by 2055.
What a crock, Joel. You know damn well that many US nuclear plants are seeing their licenses extended for more than 20 years beyond their original planned decommissioning dates.
http://www.nrc.gov/reactors/operating/licensing/renewal/applications.html
And your “early” closures are due to political BS pushed by econuts like yourself. Now give us some hard data on the demonstrated field lifetime of wind turbines.
Joel, I’m not sure your cheaper replacement holds true because replacements are usually bigger. In any case, how often would a part for a 2010 car fit a 1990 model? Designs change over time, and 20 years is a long time in a design cycle. The odds of a new nacelle fitting atop a 20yo tower are not good.
Just so people can make a comparison with a really reliable renewable energy technology:
http://cobalt.ca/ragged-chutes/
This is a water powered air Compressor that has been running for 105 years. Big scale renewables. There is one in Ohio that is about 1400 HP.
They are called a ‘trompe’ in France but really called a ‘Taylor Hydraulic Compressor’ after Dr Taylor of Montreal.
Thank you for the link, Joel. Nice machine. However, as an engineer, reading through this link (have to admit I’m lazy and didn’t click on any other links), one of my first thoughts is: So what? A machine has been put up, 40 years ago. It is still working. It has a rated capacity. I don’t see any charts showing how much real energy has come off of it. As a turbine, part of the energy that comes off is shunted back into the turbine, to sustain the field coil. What is happening to the net energy that remains? Is it powering equipment, is it charging a battery? What is happening during times when the wind is not blowing, or is blowing too hard. Even though it is nice to see something mechanical, which through maintenance and repair has remained in a working condition, I have to ask what the bottom line is on this project. What useful energy has come out, compared to the amount of energy used to keep it going? What work is it doing, and how beneficial is that work?
something else to add to the mix:
25 July: Yorkshire Post: David Davis: Hold firms liable for blowing an ill wind
(David Davis is the Conservative MP for Haltemprice and Howden who tabled a Bill in Parliament this week on the wind farm industry)
My Parliamentary Bill takes no side in that debate. It is narrowly defined to one aspect of public interest; it requires the operators of wind farms, who are in receipt of £797m of public subsidy a year, to organise their affairs so that they are able to meet the costs of any nuisance imposed on people living near them.
In 1995 the World Health Organisation recommended that to prevent sleep interruption low frequency noise should not exceed 30 decibels. However, in 1996, the Government’s Energy Technology Support Unit – ETSU – set the noise limit for wind turbines at 43 decibels. That is an enormous difference; on the logarithmic decibel scale it is approximately double the WHO limit. We still use those standards today.
In the last five years no planning application was refused on noise-related grounds, but there have been 600 noise-related incidents arising from wind farm operations. The majority of complaints arise as a result of amplitude modulation, which is the loud, continuous thumping or swishing noise regularly described by those living near wind farms.
Numerous studies have identified that sleep is disturbed on a regular basis even at distances over one kilometre away from turbines, yet under the ETSU standards turbines can be installed just 600 metres away from residential property. The wind farm companies are acutely aware of this, and all the more so since a member of the public, Jane Davis, sued a wind farm near her home for noise nuisance. The matter was settled out of court, and there is a gagging order preventing us from knowing the details, but the settlement is rumoured to have been in the region of £2m…
Since this case, some dubious measures have been taken by the industry to obstruct perfectly legitimate claims for nuisance. The use of shell companies in the wind industry seems to be the commonest trick. The parent company provides a loan to a specially-created subsidiary to set up the wind farm, then leaves it in control of operations…
The subsidiary is left as a financial shell, with very few liquid assets and total liabilities greater than total assets. That makes it impossible to bring litigation against a wind farm, simply because there is nothing to win from them. Even liquidating them would generate no cash…
http://www.yorkshirepost.co.uk/news/debate/columnists/david-davis-hold-firms-liable-for-blowing-an-ill-wind-1-7376535
Excellent research & presentation Ed.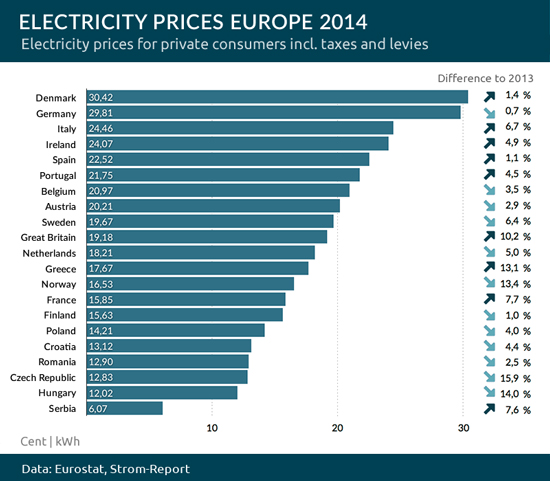
The proof-of-the-pudding is in the eating, they say.
Here’s a comparison of European electricity prices for 2014:
Another point I have often made is that the trillion spent on so-called renewables would almost certainly have paid for getting fusion working by now. The cost of the most expensive fusion project in the world (ITER) is only slightly over one percent of that amount, but under present funding will not be online until 2027. With a hundred similar projects for the same outlay, the odds of NONE working are pretty slim. And, only one has to work, then it’s game over for the subsidy guzzlers.Also, game over for the terrorists funded by oil.
Clean, cheap, reliable fusion power is about 20 years out. So it was claimed in the 1960’s, the 1970’s, the 1980’s, etc., You get the picture. People predicting fusion power have the same track record as Paul Ehrlich, which is zero for many.
I know fusion sounds great, but to date we haven’t managed to sustain a fusion reaction for even one second, and last time I checked we also haven’t been able to get more power out than has gone in. I really doubt fusion power is going to be here in 20 years, and I don’t think that spending another one or two trillion dollars will change that.
Meanwhile, I am quite confident that we can get significant improvements on fission designs for a lot less money.
Incorrect. A fusion reaction has been sustained for many minutes in a teenager’s garage lab. Check out the Farnsworth Fusor. The issue is that existing fusion devices are not breakeven; the power they take is more than the power they give out, that is even if you compare simple heat output with electricity in.
These things scale rapidly with size (which is why the Sun works even though it uses a very inefficient reaction) and a production-scale reactor the size of a typical powerplant would likely break even. Though, the same is true of fission; you can’t do much that’s useful with a couple of pellets of natural uranium oxide, you need a few tons.
Unless we build a production-scale reactor we shall never know if it’s feasible. The difference with fission was that the incentive to build a fullsize reactor was there because of war considerations. Once fission was shown to work, the financial gamble became much less and the money started flowing.
So little outcome obtained for so much expenditure given. They would not be wasting this much if it was their own money. They will keep spending until they run out of other people’s money. That may be quite soon now.
Joel D. Jackson on July 31,
2015 at 1:41 pm
Alan says: ” But you can’t find
a single wind turbine of
250KW or greater 30 years
old and still producing
power.”
…
How about 1 MW for 40 years?
..
http://
cleantechnica.com/2015/05/
21/oldest-operating-wind-
turbine-world-turning-40/
____
this big breakthrough before 40 ys: how many followers –
1000, 100, 1 ?
The challenge is to calculate the unit costs of electricity for a specific wind farm and understand how consumers pay, and how the investor gets a return. In Australia there is a large 420 MW wind generator near Macarthur in Victoria with 140 turbines each 3MW. It reportedly cost A$1 billion three years ago.
Assume 25 year life, that means a depreciation charge of A$40 million per year.
Assume 5% annual operating costs to cover maintenance and land leasing costs, that’s A$50 million per year.
If the investors want an 8% return on investment, that’s A$90 million per year. (ignores tax impacts).
That equates to a total of A$180 million per year to be recovered in prices.
If average utilization of nameplate capacity is 25%, this generator produces 920 GWhr per year.
To cover costs, that equates to an average electricity cost of 9.8 cents/kWhr.
To also include the return on investment, the average price required is 19.6 cents/kWhr.
In Australia, the current wholesale electricity price paid to all generators is 4 cents/kWhr. Under the Renewable Energy Target government legislation, electricity retailers are required to buy large generation certificates from wind generators and that currently provides them with an additional 4 cents/kWhr. So they get about 8 cents that just about covers their costs depending on average utilization, but nowhere near enough to generate a return on investment.
Are they receiving additional tax benefits or subsidized capital in order to make this a viable investment?
Small scale household solar investors receive about 6 cents as a feed in tariff.
What I know is that retail electricity prices in Australia continue to rise by 8% per year as investments in the network to support a growing distributed and unreliable solar/wind input as well as the renewable subsidies force up costs.
It’s tough to swallow in the short term but, in the long term, this kind of investment madness is self-correcting. Eventually the over-hyped sales story for renewables will run into the inconvenient truth of actual cost and performance. But it takes a while for reality to reach political brains. When it does, saner heads prevail and the fantasies and subsidies evaporate. In some countries (e.g. the UK) it is already happening.
Arming political representatives with a condensed talking points that highlight the reality definitely helps, as does updating the data and conclusions on a regular basis. After all, facts are stubborn things.
We’re already seeing this happen; the UK government has just announced an end to onshore wind subsides. The reaction from the Greens has been to mount a massive activism campaign in an attempt to mobilise the British public against the subsidy cuts. Unfortunately a lot of people are still gullible enough to join the bandwagon imagining they are fighting a worthy cause rather than lining the pockets of investors, and if their numbers become too large that might intimidate the government into an about-face. Which is why we need to remain vigilant against these kinds of tactics until the subsidies actually have ceased.
I attended one of their publicity events just to see what form they take, and most of the stuff just seems to be panicky hyperbole. They have more or less stopped putting out facts or figures, probably because most of the ones they did put out were quickly demolished as inaccurate by members of their audience.