Guest Post by Bob Tisdale
As you are well aware, there is a very basic difference between the updates to the NOAA and UAH global temperature datasets: the NOAA update increased the warming rate of their product during the slowdown in global surface warming, while the UAH update decreased the warming rate of their lower troposphere dataset in that timeframe. We’ll discuss another basic difference between those updates in this post.
Some people, Tamino (a.k.a. Grant Foster) for example, believe my discussions of the recent changes to the NOAA and UAH global temperature products show bias on my part. He says I use insulting language when discussing the NOAA changes but that I choose flattering words for the changes to the UAH data. Tamino closes his post with, speaking of me:
The obvious conclusion is that when revision goes the way he wants it’s “much corrected” and “enhanced” but when it goes the way he doesn’t want, it’s “unjustifiable” and “overcooked.”
Thanks, Tamino, for the opportunity to present once more why I have stated (and will continue to state in the future) that the new NOAA ERSST.v4-based data are unjustifiably overcooked.
IT’S VERY EASY TO SEE THAT NOAA CAN’T JUSTIFY THEIR ADJUSTMENTS DURING THE HIATUS (HIATUS BEING NOAA’S CHOICE OF WORDS)
The biggest changes to the NOAA NCEI (formerly NCDC) data took place in the sea surface temperature portion (the change from the ERSST.v3b to the ERSST.v4 datasets) of their combined land and ocean surface temperature dataset. See Karl et al. (2015) Possible artifacts of data biases in the recent global surface warming hiatus (paywalled). NOAA used the night marine air temperature dataset (HADNMAT2) from the UK Met office as a reference for their new ERSST.v4 dataset. But the short-term warming rate of the new NOAA ERSST.v4 data during the global warming slowdown is much higher than the HADNMAT2 data. See Figure 1, which was first presented in my open letter to Tom Karl. That graph serves as the basis for my statements (1) that the recent update to the NOAA sea surface temperature data cannot be justified by the dataset that was used a reference for those adjustments, and, in turn, (2) that the NOAA adjustments are overcooked.
 Figure 1
Bottom line for the NOAA adjustments: I can support with data my statements about the NOAA ERSST.v4 sea surface temperature-based global temperature products being unjustifiably overcooked.
WHAT ABOUT THE TREND-LOWERING CHANGES TO THE UAH LOWER TROPOSPHERE TEMPERATURE DATA?
The changes to the UAH lower troposphere temperature data brought their short-term trends down into line with the product from RSS. Simple. Nothing controversial. The short-term trends of the UAH data are NOT lower than the RSS data. In fact, the UAH lower troposphere temperature data show slightly less cooling (not more) than the RSS data. See Figures 2 and 3.

Figure 2
# # #

Figure 3
(Figures 2 and 3 are Figures 7 and 8 from the most recent global surface temperature update, without the three surface temperature products.)
Bottom line for the UAH changes: unlike with the NOAA data, we can’t say the changes to the UAH data are unjustified because they are so similar to those of RSS, and, as a result, we also cannot say the UAH data are overcooked…or undercooked, depending on your point of view.
ADDITIONAL READING
We discussed the unjustifiable and overcooked changes to the new NOAA sea surface temperature data in the posts:
- NOAA/NCDC’s new ‘pause-buster’ paper: a laughable attempt to create warming by adjusting past data
- More Curiosities about NOAA’s New “Pause Busting” Sea Surface Temperature Dataset
- Open Letter to Tom Karl of NOAA/NCEI Regarding “Hiatus Busting” Paper
And because GISS has recently switched to the new NOAA ERSST.v4 data, see:
The Three Faces of the GISS Land-Ocean Temperature Index (LOTI)
I discussed the update of the UAH lower troposphere temperature data in the post:
New UAH Lower Troposphere Temperature Data Show No Global Warming for More Than 18 Years
CLOSING
I opened the post with a fundamental difference between the NOAA and UAH changes to their global temperature products: the NOAA update increased the warming rate of their product since 1998, while the UAH update decreased the warming rate of their dataset. The other fundamental difference: The changes to the UAH dataset can obviously be justified, while the changes to the NOAA data obviously cannot be.
Refering to another topic in Tamino’s post, I wonder if Tamino would prefer the term “hiatus busting” instead of “pause busting”, considering that Karl et al (2015) used the term hiatus, not pause, in the title of their paper Possible artifacts of data biases in the recent global surface warming hiatus. Mmm, probably not, because Tamino uses the same misdirection as NOAA did in Karl et al.
Again, thanks, Tamino, for the opportunity to once again illustrate how NOAA unjustifiably overcooked their adjustments to their ERSST.v4-based data. It has always been a pleasure responding to you. Welcome back.
We need to remember as well that UAH V5.6 increased the warming trend from V5.5. To an large extent V6.0 just takes us back to V5.5.
Of course, what Tamino needs to do is show how the UAH change is wrong, just as Bob has done with NOAA. I wonder why he can’t?
“Tamino needs to do is show how the UAH change is wrong, just as Bob has done with NOAA. I wonder why he can’t”
As far as I can tell, Tamino accepts both not one over the other. But he normally concerns himself with the surface record when he is talking about the surface.
They can not both be correct. The divergence is simply to great. The satellite response to El Nino is far more sensitive normally then the surface for fundamental physics reasons, but now the surface is showing greater sensitivity then the satellites. The surface is using a record level of homogenization.
The question is do either UAH or RSS show any year close to as warm as 1998? The answer is no, they do not. Both show 2014 as nowhere near 1998, and both show 1998 as the “warmest year ever” to quote the CAGW phrase.
Both UAH and RSS are ballpark .3 degrees below 1998, both show 2010 and other years as warmer then 2014. Schmitt proclaimed a what, 34% chance that 2014 was the hottest year ever based on .03 degrees. By that measure there is a 100 percent chance that RSS and UAH prove that 2014 and 2015 are not the warmest year ever; not even close.
As I pointed out above (July 20, 2015 at 7:25 pm) the UAH changes alter the product so it no longer covers the same region of the atmosphere as RSS TLT or UAH Version 5.5, I have yet to see an explanation from Spencer why they did that.
Which one uses or is thinking about using tree rings?
Bob Tisdale and also anyone when we -on both sides of the discussion look at data, methods conjecture are we bumping into the following?
“Heisenberg’s Uncertainty Principle”
and no, I can’t say I fully understand it.
michael
Heisenberg’s Uncertainty Principle arises as to measure the tiny things in the quantum sphere, that we must actively interact with them by the use of large and blunt tools. Such that if there are two properties, and we measure one with a large hammer, it necessarily changes the state of the other. And so we’re out of sorts for measuring all things, with infinite accuracy, at the same time.
When people ruminate other the data involved, however, it’s very easy to get into what we may as well call Heisenberg’s Confirmation Principle. We have a habit of seeing the same data set and then claiming of it that it supports just our preconception; thus confirming the validity of our preconceptions. If this is a concern to you then find your preferred conclusion, then find the strongest arguments against that conclusion. If the arguments are legit, then your preferred conclusion cannot be supported; and must be discarded. If the strongest arguments cannot throw down your preferred conclusion, then it gets messy. But the rule of thumb and short answer is, your preferred conclusion isn’t ‘proven’ or ‘supported’ at all by this exercise, it’s still simply a preference.
All things are subject to interpretation whichever interpretation prevails at a given time is a function of power and not truth.
Friedrich Nietzsche
Read more at http://www.brainyquote.com/quotes/quotes/f/friedrichn109379.html#zg63oDPpQaky8hxH.99
Locking in Antarctica. Ice growth slows down.
http://www.cpc.ncep.noaa.gov/products/precip/CWlink/blocking/real_time_sh/500gz_anomalies_sh.gif
http://www.bartol.udel.edu/~pyle/thespnplot2.gif
Our current satellite technology is at least 20-30 years old. While it is fairly accurate, isn’t there something better that could be sent into orbit? Shouldn’t the end of the world be enough of a reason to try and get a better set of data? I would certainly suspect better technology exists. So, why hasn’t it been employed?
Only one answer I can think of off hand. The folks that control the money do not want better data.
The satellite data is checked thousands of times against the most accurate thermometers we have in weather balloons.
NASA (earth science program) is the source for developing improved instruments for NOAA’s later operational use.
Lamar Smith, chair of House Science committee, bragged about cutting NASA’s earth science bugdet 40% at the latest Heartland conference.
You’re right. The folks that control the money do not want better data.
So the “fundamental” criterion for whether a change is good or bad is whether or not its simple linear regression line over a small subset of the data resembles that of another data set?
This has to be one of the weakest arguments against the Karl et al changes that I have read on this site. (and there has been some stiff competition)
No, the criterion is whether a change in trend is towards cooling (good) or warming (bad).
Aran, well said (better than I did).
I already explained, that is a gross mischarterization of the message in this post.
Has Grant Foster ever been right about anything at all? At what point should one ignore people who have been serially wrong? It would be interesting to plug new data into his pause-explaining paper to see how it looks today.
Have you ever play poker all night and it was getting late and you pushed a connector stone bluff on the river with a flush, straight, full house and straight flush showing on the board with nothing in your hand? Then you go all in. that is cagw right now.
and then the skeptics with the good hands fold instead of playing their advantage…
Given completely unsupportable changes that the NOAA had put into it’s database, I don’t see how anything short of insulting words would be appropriate.
I recommend an unheard of adjustment to the surface record…The C.B adjustment. (Confirmation Bias.)
https://chiefio.wordpress.com/2010/12/13/the-rewritten-past/
Phil Jones, 1985, about the temperature decline after the 1930´ies:
“No satisfactory explanation for this cooling exists, and the cooling itself is perplexing because it is contrary to the trend expected from increasing atmospheric CO2 concentration. Changing Solar Activity and/or changes in explosive volcanic activity has been suggested as causes… but we suspect it may be an internal fluctuation possibly resulting from a change in North Atlantic deep water production rate.”
==============================
“So, Jones said in 1985 that: “the cooling itself is perplexing” – but why not say so today? And why don’t we see a “perplexing” cooling after 1940 in the IPCC graphic today? And furthermore, back in the early 1980´ies Jones appears to accept data as is at least to such an extent that he is considering how nature has produced these “perplexing” cooling data – like a real scientist should. (EM Smith)
===============================
bob, why are you only showing data post-1998? NMAT2 and ERSSTv4 agree very closely over the full UAH / RSS record (1979-present)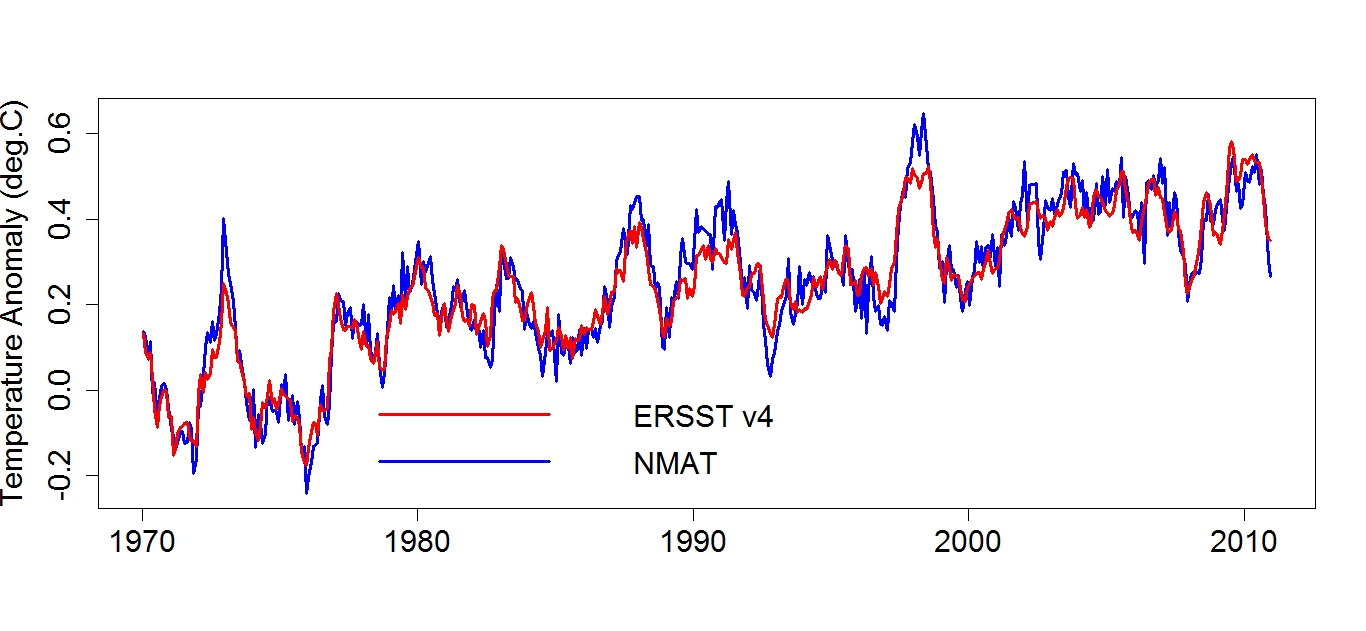
What about the other adjustments to the UAH data set?
Didn’t Kerl et al have a statistical significance of 0.10 or 10%?
Damn – Karl and it’s in the supplementary material.
Yes. When was the last time we saw accepting 0.10?
Dear Bob T: Thank you so much for digging into these things!!!! Extremely important.
K.R. Frank