By Christopher Monckton of Brenchley
I propose to raise a question about the Earth’s energy budget that has perplexed me for some years. Since further evidence in relation to my long-standing question is to hand, it is worth asking for answers from the expert community at WUWT.
A.E. Housman, in his immortal parody of the elegiac bromides often perpetrated by the choruses in the stage-plays of classical Greece, gives this line as an example:
I only ask because I want to know.
This sentiment is not as fatuous as it seems at first blush. Another chorus might say:
I ask because I want to make a point.
I begin by saying:
You say I aim to score a point. Not so:
I only ask because I want to know.
Last time I raised the question, in another blog, more heat than light was generated because the proprietrix had erroneously assumed that T / 4F, a differential essential to my argument, was too simple to be a correct form of the first derivative ΔT / ΔF of the fundamental equation (1) of radiative transfer:
![]() , | Stefan-Boltzmann equation (1)
, | Stefan-Boltzmann equation (1)
where F is radiative flux density in W m–2, ε is emissivity constant at unity, the Stefan-Boltzmann constant σ is 5.67 x 10⁻⁸ W m–2 K–4, and T is temperature in Kelvin. To avert similar misunderstandings (which I have found to be widespread), here is a demonstration that T / 4F, simple though it be, is indeed the first derivative ΔT / ΔF of Eq. (1):
![]() . (2)
. (2)
Like any budget, the Earth’s energy budget is supposed to balance. If there is an imbalance, a change in mean temperature will restore equilibrium.
My question relates to one of many curious features of the following energy-budget diagrams for the Earth:


Energy budget diagrams from (top left to bottom right) Kiehl & Trenberth (1997), Trenberth et al. (2008), IPCC (2013), Stephens et al. (2012), and NASA (2015).
Now for the curiosity:

“Consensus”: surface radiation FS falls on the interval [390, 398] W m–2.
There is a “consensus” that the radiative flux density leaving the Earth’s surface is 390-398 W m–2. The “consensus” would not be so happy if it saw the implications.
When I first saw FS = 390 W m–2 in Kiehl & Trenberth (1997), I deduced it was derived from observed global mean surface temperature 288 K using Eq. (1), assuming surface emissivity εS = 1. Similarly, TS = 289.5 K gives 398 W m–2.
The surface flux density cannot be reliably measured. So did the “consensus” use Eq. (1) to reach the flux densities shown in the five diagrams? Yes. Kiehl & Trenberth (1997) wrote: “Emission from the surface is assumed to follow Planck’s function, assuming a surface emissivity of 1.” Planck’s function gives flux density at a particular wavelength. Eq. (1) integrates that function across all wavelengths.
Here (at last) is my question. Does not the use of Eq. (1) to determine the relationship between TS and FS at the surface necessarily imply that the Planck climate-sensitivity parameter λ0,S applicable to the surface (where the coefficient 7/6 ballparks allowance for the Hölder inequality) is given by
![]() = 0.215 K W–1 m2 ? (3)
= 0.215 K W–1 m2 ? (3)
The implications for climate sensitivity are profound. For the official method of determining λ0 is to apply Eq. (1) to the characteristic-emission altitude (~300 mb), where incoming and outgoing radiative fluxes are by definition equal, so that Eq. (4) gives incoming and hence outgoing radiative flux FE:
![]() = 239.4 W m–2 (4)
= 239.4 W m–2 (4)
where FE is the product of the ratio πr2/4πr2 of the surface area of the disk the Earth presents to the Sun to that of the rotating sphere; total solar irradiance S = 1366 W m–2; and (1 – α), where α = 0.3 is the Earth’s albedo. Then, from (1), mean effective temperature TE at the characteristic emission altitude is given by Eq. (5):
 = 254.8 K. (5)
The characteristic emission altitude is ~5 km above ground level. Since mean surface temperature is 288 K and the mean tropospheric lapse rate is ~6.5 K km–1, Earth’s effective radiating temperature TE = 288 – 5(6.5) = 255 K, in agreement with Eq. (5). The Planck parameter λ0,E at that altitude is then given by (6):
![]() = 0.310 K W–1 m2. (6)
= 0.310 K W–1 m2. (6)
Equilibrium climate sensitivity to a CO2 doubling is given by (7):
 , (7)
, (7)
where the numerator of the fraction is the CO2 radiative forcing, and f = 1.5 is the IPCC’s current best estimate of the temperature-feedback sum to equilibrium.
Where λ0,E = 0.313, equilibrium climate sensitivity is 2.2 K, down from the 3.3 K in IPCC (2007) because IPCC (2013) cut the feedback sum f from 2 to 1.5 W m–2 K–1 (though it did not reveal that climate sensitivity must then fall by a third).
However, if Eq. (1) is applied at the surface, the value λ0,S of the Planck sensitivity parameter is 0.215 (Eq. 3), and equilibrium climate sensitivity falls to only 1.2 K.
If f is no greater than zero, as a growing body of papers finds (see e.g. Lindzen & Choi, 2009, 2011; Spencer & Braswell, 2010, 2011), climate sensitivity falls again to just 0.8 K.
If f is net-negative, sensitivity falls still further. Monckton of Brenchley, 2015 (click “Most Read Articles” at www.scibull.com) suggest that the thermostasis of the climate over the past 810,000 years and the incompatibility of high net-positive feedback with the Bode system-gain relation indicate a net-negative feedback sum on the interval –0.64 [–1.60, +0.32] W m–2 K–1. In that event, applying Eq. (1) at the surface gives climate sensitivity on the interval 0.7 [0.6, 0.9] K.
Two conclusions are possible. Either one ought not to use Eq. (1) at the surface, reserving it for the characteristic emission altitude, in which event the value for surface flux density FS may well be incorrect and no one has any idea of what the Earth’s energy budget is, and still less of an idea whether there is any surface “radiative imbalance” at all, or the flux density at the Earth’s surface is correctly determined from observed global mean surface temperature by Eq. (1), as all five sources cited above determined it, in which event sensitivity is harmlessly low even under the IPCC’s current assumption of strongly net-positive temperature feedbacks.
Table 1 summarizes the effect on equilibrium climate sensitivity of assuming that Eq. (1) defines the relationship between global mean surface temperature TS and mean outgoing surface radiative flux density FS.
| Climate sensitivities to a CO2 doubling | |||||
| Source | Altitude | λ0 | f | ΔTS,100 | ΔTS,∞ |
| AR5 (2013) upper bound | 300 mb | 0.310 K W–1 m2 | +2.40 W m–2 K–1 | 2.3 K | 4.5 K |
| AR4 (2007) central estimate | 300 mb | 0.310 K W–1 m2 | +2.05 W m–2 K–1 | 1.6 K | 3.3 K |
| AR5 implicit central estimate | 300 mb | 0.310 K W–1 m2 | +1.50 W m–2 K–1 | 1.1 K | 2.2 K |
| AR5 lower bound | 300 mb | 0.310 K W–1 m2 | +0.75 W m–2 K–1 | 0.8 K | 1.5 K |
| M of B (2015) upper bound | 300 mb | 0.310 K W–1 m2 | +0.32 W m–2 K–1 | 0.7 K | 1.3 K |
| AR5 central estimate | 1013 mb | 0.215 K W–1 m2 | +1.50 W m–2 K–1 | 0.6 K | 1.2 K |
| M of B central estimate | 300 mb | 0.310 K W–1 m2 | –0.64 W m–2 K–1 | 0.5 K | 1.0 K |
| M of B upper bound | 1013 mb | 0.215 K W–1 m2 | +0.32 W m–2 K–1 | 0.5 K | 0.9 K |
| M of B lower bound | 300 mb | 0.310 K W–1 m2 | –1.60 W m–2 K–1 | 0.4 K | 0.8 K |
| M of B central estimate | 1013 mb | 0.215 K W–1 m2 | –0.64 W m–2 K–1 | 0.4 K | 0.7 K |
| Lindzen & Choi (2011) | 300 mb | 0.310 K W–1 m2 | –1.80 W m–2 K–1 | 0.4 K | 0.7 K |
| Spencer & Braswell (2011) | 300 mb | 0.310 K W–1 m2 | –1.80 W m–2 K–1 | 0.4 K | 0.7 K |
| M of B lower bound | 1013 mb | 0.215 K W–1 m2 | –1.60 W m–2 K–1 | 0.3 K | 0.6 K |
Table 1. 100-year (ΔTS,100) and equilibrium (ΔTS,∞) climate sensitivities to a doubling of CO2 concentration, applying Eq. (1) at the characteristic-emission altitude (300 mb) and, boldfaced, at the surface (1013 mb).
It is worth noting that, even before taking any account of the “consensus’” use of Eq. (1) to govern the relationship between TS and FS, the reduction in the feedback sum f between IPCC’s 2007 and 2013 assessment reports mandates a corresponding reduction in its central estimate of climate sensitivity from 3.3 to 2.2 K, of which only half, or about 1 K, would be expected to occur within a century of a CO2 doubling. The remainder would make itself slowly and harmlessly manifest over the next 1000-3000 years (Solomon et al., 2009).
Given that the Great Pause has endured for 18 years 6 months, the probability that there is no global warming in the pipeline as a result of our past sins of emission is increasing (Monckton of Brenchley et al., 2013). All warming that was likely to occur from emissions to date has already made itself manifest. Therefore, perhaps we start with a clean slate. Professor Murry Salby has estimated that, after the exhaustion of all affordably recoverable fossil fuels at the end of the present century, an increase of no more than 50% on today’s CO2 concentration – from 0.4 to 0.6 mmol mol–1 – will have been achieved.
In that event, replace Table 1 with Table 2:
| Climate sensitivities to a 50% CO2 concentration growth | |||||
| Source | Altitude | λ0 | f | ΔTS,100 | ΔTS,∞ |
| AR5 (2013) upper bound | 300 mb | 0.310 K W–1 m2 | +2.40 W m–2 K–1 | 1.3 K | 2.6 K |
| AR4 (2007) central estimate | 300 mb | 0.310 K W–1 m2 | +2.05 W m–2 K–1 | 0.9 K | 1.8 K |
| AR5 implicit central estimate | 300 mb | 0.310 K W–1 m2 | +1.50 W m–2 K–1 | 0.6 K | 1.3 K |
| AR5 lower bound | 300 mb | 0.310 K W–1 m2 | +0.75 W m–2 K–1 | 0.4 K | 0.9 K |
| M of B (2015) upper bound | 300 mb | 0.310 K W–1 m2 | +0.32 W m–2 K–1 | 0.4 K | 0.7 K |
| AR5 central estimate | 1013 mb | 0.215 K W–1 m2 | +1.50 W m–2 K–1 | 0.3 K | 0.7 K |
| M of B central estimate | 300 mb | 0.310 K W–1 m2 | –0.64 W m–2 K–1 | 0.3 K | 0.6 K |
| M of B upper bound | 1013 mb | 0.215 K W–1 m2 | +0.32 W m–2 K–1 | 0.3 K | 0.5 K |
| M of B lower bound | 300 mb | 0.310 K W–1 m2 | –1.60 W m–2 K–1 | 0.2 K | 0.4 K |
| M of B central estimate | 1013 mb | 0.215 K W–1 m2 | –0.64 W m–2 K–1 | 0.2 K | 0.4 K |
| Lindzen & Choi (2011) | 300 mb | 0.310 K W–1 m2 | –1.80 W m–2 K–1 | 0.2 K | 0.4 K |
| Spencer & Braswell (2011) | 300 mb | 0.310 K W–1 m2 | –1.80 W m–2 K–1 | 0.2 K | 0.4 K |
| M of B lower bound | 1013 mb | 0.215 K W–1 m2 | –1.60 W m–2 K–1 | 0.2 K | 0.3 K |
Table 2. 100-year (ΔTS,100) and equilibrium (ΔTS,∞) climate sensitivities to a 50% increase in CO2 concentration, applying Eq. (1) at the characteristic-emission altitude (300 mb) and, boldfaced, at the surface (1013 mb).
Once allowance has been made not only for the IPCC’s reduction of the feedback sum f from 2.05 to 1.5 W m–2 K–1 and the application of Eq. (1) to the relationship between TS and FS but also for the probability that f is not strongly positive, for the possibility that a 50% increase in CO2 concentration is all that can occur before fossil-fuel exhaustion, for the IPCC’s estimate that only half of equilibrium sensitivity will occur within the century after the CO2 increase, and for the fact that the CO2 increase will not be complete until the end of this century, it is difficult, and arguably impossible, to maintain that Man can cause a dangerous warming of the planet by 2100.
Indeed, even one ignores all of the considerations in the above paragraph except the first, the IPCC’s implicit central estimate of global warming this century would amount to only 1.1 K, just within the arbitrary 2-K-since-1750 limit, and any remaining warming would come through so slowly as to be harmless. It is no longer legitimate – if ever it was – to maintain that there is any need to fear runaway warming.
Quid vobis videtur?
Oh good lord!
1) This is a clever example of hanging fools by their own petards. Congratulations!
2) Since “Quid vobis videtur” is often mistranlsated as “what do you think” let me point out that what it really means is something more like “What insights do you have [about the issue at hand] and “insight” originally meant “answers from God”, and therefore offer one: Yes.
3) More seriously, what you illustrate here is part of the problem with these global models: over abstraction and over-simplification reflecting an over grown thumb-nail sketch of how climate works. These kinds of things are perfectly reasonable if your computer is an IBM 7030 and you’re converting lunch napkin notes to a first run card deck – but adding fifty years of grad student tinkering does not turn this into science.
So, yes, the system is now internally inconsistent and I rather think you have a good point here, but the bigger point is that the math is now influenced by models that look very sciency but are actually somewhat simple minded.
To improve on this, imagine dividing the entire system inwards from about 300 miles up down to the core into small blocks (say 1E6 cubic meters or less); finding a way to estimate the energy content of each block, and then tracking the energy movement into, and out of, each one. That would work – and is almost possible. The stuff we do today? doesn’t.
The world’s population will continue to increase.
They will need to be fed.
The only natural way to produce food is a single chemical reaction called PHOTOSYNTHESIS.
Photosynthesis requires sunlight, H2O and most importantly CO2.
We MUST make sure there is sufficient atmospheric CO2 to feed the world, but at the moment it is still perilously low.
We have all assumed that the Sun light “not” reaching the Earth’s surface is reflected into space. What if it is “not” reflected, but warms the upper atmosphere????? Ozone layer etc..
We need to reanalyze all variables!!!!
jlurtz,
“We have all assumed that the Sun light “not” reaching the Earth’s surface is reflected into space. ”
Well, perhaps you assume that but the climate scientists don’t. Look at the diagrams: 79 W/m^2 “solar absorbed by atmosphere” (from the IPCC diagram). Most of that is due to near IR water vapor absorption in the troposphere. A bit (about 5 W/m^2, I think) is absorption of UV in the stratosphere.
Monckton of Brenchley: “the scientific method works by people asking questions rather than assuming religiously that what has been handed down to them from on high is written on tablets of stone.”
Lord Monckton should take his own advice to heart and avoid dogmatism such as he exhibited upthread; I and many others (including, albeit imperfectly, Gerard Roe) have explained that what the feedback quantity is not set in stone; it depends on the level of abstraction. Lord Monckton’s choice is largely harmless in the contexts in which I have seen him use it, but, as others have observed, it can lead to unphysical results at some timescales.
Monckton of Brenchley: “To the few (such as Mr Born) who sneer because I ask questions”
I do not “sneer” at asking questions, particularly that one; it took me the better part of a quarter hour to figure out the answer myself.
But, since Lord Monckton had previously disputed my explanation of the forcing measure on which Dr. Spencer’s response was implicitly based, I thought it might help to elaborate; Lord Monckton’s difficulty may have been rooted in the same misunderstanding that he betrayed in disputing my forcing explanation.
Trying thus to help another to understand something is not “sneering” or “adopting a high-handed, arrogant tone.”
Joe Born,
“Trying thus to help another to understand something is not “sneering” or “adopting a high-handed, arrogant tone.””
Exactly. Especially when that person claims he “only asks because he wants to know”.
Mr Born, as trlls do, repeats a point he has already made upthread. My reply upthread answers him.
“Jlurtz Wrote:
We have all assumed that the Sun light “not” reaching the Earth’s surface is reflected into space. What if it is “not” reflected, but warms the upper atmosphere????? Ozone layer etc..”
That is exactly what happens:
http://www.physicalgeography.net/fundamentals/images/atmslayers.gif
Most people aren’t aware that O2 and O3 are potent green house gasses that just happen to absorb heat around the temperature that the earth emits.
http://www.ces.fau.edu/ces/nasa/images/Energy/GHGAbsoprtionSpectrum-690×776.jpg
Interesting as O2 and N2 are usually considered as ‘transparent’ to infra red radiation. What is the source of this chart and do you have the absorption spectrum for N2 in a similar format?
Bernard
The most abundant gases in our atmosphere do not significantly absorb or emit in the mid-infrared region; although Nitrogen, the most abundant atmospheric gas does absorbs weakly between 4 and 5 micron and Oxygen has a weak absorption band between 6 and 7 micron (and a relatively strong absorption line around 0.7 micron). Apart from these exceptions, the major constituents of our atmosphere, Nitrogen and Oxygen, are transparent to infrared radiation and do not contribute to the ‘Greenhouse Effect’.
CO2isLife’s diagram is an adaption of a Wikipedia entry (which wasn’t ideal in the first place). By grouping O2 and O3 together It has misled CO2isLife to think that the absorption at 10micron is due to oxygen; it isn’t, it is due entirely to ozone.
Also, labelling the infrared region above 10 microns as ‘microwave’ is not supportable.
The separation between incoming solar and outgoing infrared is quite distinct and I think this diagram shows it better.
http://s11.postimg.org/qt4vzvq2b/Sun_Earth_Comparison.png
The main greenhouse gas absorbers are shown here, somewhat clearer because ozone has been isolated.
http://s14.postimg.org/eq1gbemht/Absorption_by_Atmospheric_Gases.png
The major greenhouse gas not shown above is water vapour which, if present, forms an absorption continuum spanning many wavelengths.
“water vapour which, if present”
Pleas specify when and where it isn’t present in the troposphere.
“Bernard Lodge wrote:
What is the source of this chart and do you have the absorption spectrum for N2 in a similar format?”
You won’t believe this one, the source of that chart is NASA. Clearly their client scientists don’t understand the very charts that they publish to support their Global Warming nonsense.
http://www.ces.fau.edu/nasa/module-2/how-greenhouse-effect-works.php
N2 isn’t a greenhouse gas because of its structure. O2 technically isn’t a greenhouse gas either, but counts because it becomes O3.
http://www.atmos.washington.edu/~davidc/ATMS211/Lecture14-handout-PDF.pdf
tty
The atmosphere typically contains 0 to 4 % water vapour. It is effectively zero in arid parts of the world, such as deserts, and in cold parts of the world (where it is frozen out).
You can see this in spectral measurements of downward long wave radiation. Here is one taken in Canada, in February. By matching the wavelengths coming from the atmosphere with the sort of absorption plots shown above, you can identify which gases are radiating.
The first thing to notice is that there is no water vapour contribution, otherwise it would obscure the signature of the other gases.
Notice also the amount of radiation in the 15 micron band, a clear fingerprint of CO2 ‘back-radiation’.
Did you want an experiment to show it was CO2? How about the diagram above?
co2islife wrote: “You won’t believe this one, the source of that chart is NASA. Clearly their client scientists don’t understand the very charts that they publish to support their Global Warming nonsense.”
Wow. Careless of them. But the graph is technically correct (the O2 absorption is the part below about 240 nm) so I doubt they don’t understand it. More likely, they recycled a graph created for a different purpose (one that included a discussion of the absorption of incoming radiation) and did not think about how easily it could be misinterpreted, since, after all, it is perfectly clear to them.
N2 and O2 are transparent to infra-red radiation.
There’s a good reason for that. The infra-rad absorption is possible only for a molecules vibration modes which are low energy. N2 and O2 have only a single vibration mode which is the two atoms getting further apart and closer together, as if connected by a spring. But this mode gives a stiff spring which gives energies in the ultra-violet – higher energy than visible light.
By contrast molecules with three atoms such as H2O, O3 and CO2 have a mode whereby the angle between the three atoms can vary, and the “spring” restoring force on this is much weaker, meaning the minimum vibrational energy is much lower. This allows absorption and emission in the infra-red – a lower energy than incoming sunlight.
The O2 component of “O2 and O3” in the diagram above will thus not be absorbing and re-emitting at the infra-red frequencies, so has no greenhouse effect. Similarly N2. The greenhouse effect from “O2 and O3” above is solely from O3 – ozone.
Climate Pete wrote: “N2 and O2 have only a single vibration mode which is the two atoms getting further apart and closer together, as if connected by a spring. But this mode gives a stiff spring which gives energies in the ultra-violet – higher energy than visible light.”
Uh, no. The vibrational frequencies of N2 and O2 are smack dab in the middle of other vibrational frequencies. They can be observed by means of Raman spectroscopy. They do not absorb or emit at those frequencies because the change in length of the bond produces no change in dipole moment, so they can not interact with an electromagnetic field by absorbing or emitting a photon.
Did I miss the part about the sun not facing any given spot on Earth 24 hours a day ?
I do not know.
Did you?
96% of the total LWIR absorbed by CO2 is in the range 12.5microns to 16.5microns.
R Stevenson wrote:
“96% of the total LWIR absorbed by CO2 is in the range 12.5microns to 16.5microns.”
Yep, but most importantly when you translate that to black body heat, that range is largely in the – degree range. The CO2 peak of 15 microns represents a black body heat of -80 degree C.
Here is a calculator to calculate out the temperature of the other values:
http://www.spectralcalc.com/blackbody_calculator/blackbody.php
Interesting link you gave earlier re-your absorption graph. They do have a NASA logo on their page but appear to be an educational group consisting mostly of research students. I have sent them an email.
Do not be confused by the ‘peak wavelength’ (By the way, you can calculate that yourself from Wien’s Law, just divide the temperature into 3000 for an approximate peak wavelength).
All blackbodies emit over an infinite range of wavelengths. Their spectrum of emission is given by Planck’s Law. A blackbody at 300K (typical Earth temperature) will emit in a spectrum like this.
http://s15.postimg.org/srv2tbq6z/plank_300_K.png
Notice that there is a considerable amount of energy in the CO2 absorption band (assuming 12.5 to 16.5 microns – coloured red) even though the ‘peak’ is at 9.7 microns. About 20% of the total energy is emitted in this band.
In dry air (deserts, polar regions) LWIR in the range 12.5 to 16.5 microns is absorbed to extinction after 3600 m of traverse at present 380 ppm CO2 levels. Increasing CO2 would shorten the traverse but would not absorb further energy. In regions where water vapour is present (typically 2000ppm) the distance to extinction is much shorter; LWIR in the range 12 to 25 microns being absorbed in 200 m. Rising and falling CO2 and water vapour levels neither lead to corresponding changes in radiant energy absorption nor a correlation to global warming.
co2islife,
You wrote: “Yep, but most importantly when you translate that to black body heat, that range is largely in the – degree range. The CO2 peak of 15 microns represents a black body heat of -80 degree C.”
I just went to the link you provided and found that at 300 K the peak emission is at a wave number of 588/cm. That corresponds to 17.0 micrometers. But I chose units of wave number, not wavelength and the location of the peak depends on the choice of units. Although you can compute T from the location of the peak, the location of the peak does not “represent” temperature.
The physically meaningful way to relate temperature and wavelength comes from statistical mechanics. For vibrations, the relation is
h*c/lambda = k*T
where h is Planck’s constant, c is speed of light, lambda is wavelength, and k is Boltzmann’s constant. For 15 microns, T = 961 K.
p.s.: If I could make this private I would do so since my intent is only to be helpful. If you want to sound like you know what you are talking about say “temperature” not “heat”.
In dry air (deserts, polar regions) LWIR in the range 12.5 to 16.5 microns is absorbed to extinction after 3600 m of traverse at present 380 ppm CO2 levels. Increasing CO2 would shorten the traverse but would not absorb further energy. In regions where water vapour is present (typically 2000ppm) the distance to extinction is much shorter; LWIR in the range 12 to 25 microns being absorbed in 200 m. Rising and falling CO2 and water vapour levels neither lead to corresponding changes in radiant energy absorption nor a correlation to global warming.
These photons have to work their way out from the core of the Sun to the surface – citation badastromy.
Ian, you won’t insinuate adding CO2 equals earth atmosphere to the core of the sun, won’t you.
Just asking, Hans
Black-body radiation is only observed given a surface for an isothermal object having a thickness much greater than optical absorption depths for frequencies of interest. There is no such surface in the atmosphere! Atmospheric emission spectra essentially mirror absorption spectra as shown by the atmospheric limb REFIR-PAD balloon measurements of Palchetti et al., Atmos. Chem. Phys. 6, 5025 (2006). The derivation for radiation from an isothermal layer of variable thickness is a basic exercise using the Einstein coefficients.
http://quondam.hostoi.com/Black_Body_Radiation.pdf
R Stevenson
June 29, 2015 at 1:44 am
96% of the total LWIR absorbed by CO2 is in the range 12.5microns to 16.5microns.
Reply This is for black body radiation at 20 C (293 K) with peak intensity at 9.8microns. Also 86% of the total LWIR absorbed by water vapour is in the range 12microns to 25microns.
Thanks Mike B, Mike A and CO2is life for your replies.
It seems that everyone agrees that O2, and N2 do have a propensity to absorb/emit IR radiation at some particular ‘peak’ wavelengths. Lots of comments also use words like ‘weakly’ or ‘mostly transparent’ or other words implying that it is ‘not much’.
I think everyone also agrees that all matter absorbs/emits IR radiation according to its temperature. This means that O2 and H2 are capable of absorbing/emiting IR radiation at *all* IR wavelengths. What wavelength they do actually emit/absorb at depends on the temperature of the gases.
Does anyone know how much IR radiation comes from atmospheric O2 and H2 because of their temperatures?
The IPCC energy budget diagram only has a down-welling IR category for ‘greenhouse gasses’. This seems to omit the contributions from O2 and N2 due to their ‘peak’ wavelengths above and due to their ‘temperature driven’ emissions. Given that N2 and O2 are 99% of the atmosphere, these might add up to be a big number. I have not seen any quantification of the N2 and O2 contribution to IR atmospheric back-radiation – does it exist?
By the way, I would include O3 with O2 because it is not part of the fossil fuel discussion which makes it part of the ‘natural’ effect.
I know this is a bit out of context but this is a question that I wanted to ask our WUWT community for a while: We know that CO2 is plant food, the planet is greening. Let’s assume we burn all the coal, oil and gas there is, CO2 would rise some more, probably below 1000 ppm, which is about optimum for plant growth. The greening means also that the carbon sinks are increasing. What will happen when human CO2 emissions stop? How fast would the now larger carbon sinks consume the CO2 and could it drop below 200 ppm or will it slowly fall toward pre-industrial levels? We now have the benefit of increased CO2 levels to grow more food, but what after CO2 is declining? We can’t put needed CO2 into the atmosphere forever. Or we have to extract CO2 from sources such as calcium carbonate, for example, but massively, to replenish the atmospheric CO2.
? good application for nuke plants? desalinate seawater, liberate CO2, make hydrogen , make electricity, make water vapor — a five bagger
The problem is that CO2 is not the only thing plants need to grow. They need to absorb water and minerals from their roots. If CO2 causes warming then the water may not be present (drought), and some plants cannot absorb minerals as well with high CO2 levels.
Some of these processes also weaken the plant, making it more susceptible to disease and pests. Further, in temperate climes the pests are generally kept in check because they are killed by winter cold. If temperatures rise then they survive winter to cause a nuisance the rest of the year. The dengue mosquito in the USA is one case in point – its range is expanding – although this threatens humans rather than plants. Another pest affecting humans is a brain-eating amoeba which is feeling distinctly more at home in USA ponds than it used to.
Climate Pete:
No, “the problem is” that you refuse to accept reality.
Additional atmospheric CO2 concentration increases plant growth. This is why the Earth is ‘greening’ and why horticulturists pump CO2 into their greenhouses.
Richard
In answer to Stephan’s interesting question, once we’ve burned all the fossil fuels we can continue to liberate CO2 to atmosphere for the benefit of plants by burning limestone, which is the principal ultimate CO2 sink.
I was going to say the same, Sir.
And we do burn plenty of it (limestone) already, when we make, among other things, concrete
Of course, if there is indeed a supply of abiotic methane under the crust of the Earth, it may be a very long time before we need to heat rocks to keep plants from starving.
Limestone is calcined on an industrial scale in rotary kilns to produce quicklime and thhen slaked to produce hydrated lime – was marketed by ICI as Limbux
If the mean temp of the surface of the Earth is about 288K; and the mean temp of the effective radiating layer is about 255K; and if the density is greater (water, air, soil, etc) at the surface than at the effective radiating layer, and if some of the energy at the surface is carried to the effective radiating layer by dry and wet (with latent heat) thermals, then it is quite possible that the surface will warm (in response to increased CO2) less than 1C, the effective radiating layer will warm about 2C, and the unweighted average through the atmosphere will be about 1.5C.
With that possibility, and with all of the non-equilibrium processes in the Earth climate system, the calculation of a single “climate sensitivity” is not necessarily very informative.
A most interesting suggestion from Matthew Marler, which is not inconsistent with the notion that one might apply a separate SB-derived climate-sensitivity parameter for each successive layer of the atmosphere, determined from that layer’s temperature. In that event, one would indeed use the SB equation at the surface, which would give a surface equilibrium sensitivity of 1.2 K per CO2 doubling, assuming a feedback sum 1.55. In effect, the temperature obtaining at each pressure altitude would regulate the amount of heat retained at that pressure altitude, regardless of whether it arrived by radiative or non-radiative transports, from above or below.
The overall system sensitivity would still be determined at the characteristic-emission altitude, but the possibility does exist that the change in temperature at the surface could be smaller than that which the use of the CEA Planck parameter conventionally mandates. One would need to do some math to see whether one would preserve a near-linear temperature lapse-rate under such a regime, and, if so, how the lapse rate would change with temperature.
http://www.theozonehole.com/images/atmprofile.jpg
Matthew,
What you are suggesting doesn’t work. At present the radiative layer is, on average, 5km above the surface – where the temperature is approximately 255K. For convection the rate of decline of temperature with height in the troposphere is roughly constant (because it depends primarily on pressure and height) – so same temperature drop from the surface irrespective of temperature. More CO2 would mean a slower infrared energy flow upwards, so would increase the temperature drop from the surface rather than decrease it.
So to increase the temperature of the effective radiating layer by 2C the surface has to warm by at least 2C. 1C just doesn’t work for either of these two mechanisms. The only possible mechanism would be hydrological cycle effects. Needless to say, if this was the case then it would have to cause more drought over certain latitudes of land to provide the increased latent heat released in the effective radiative layer.
Don’t let the facts get in the way of your theorizing, eh?
CO2 has increased, and temps are flat.
Perhaps what you said is needless to say because it is untrue, therefore there is no need to say it.
Warming means the net heat imbalance at the top of the atmosphere which does not depend on weather.
Where this heat imbalance goes – whether into surface warming or warming of the deep oceans – is entirely dependent on random weather events such as El Nino / La Nina.
You can use RSS temperatures as evidence that “CO2 has increased, and temps are flat.”, although the RSS figures include only a small element of surface temperatures.
However, what is also true (and not inconsistent with your statement either) is that “CO2 has increased and the net imbalance of heat flows at the top of the atmosphere has increased with it”.
The physics says the net heat imbalance only stops when the surface and all the atmosphere warms up to reach a new equilibrium.
ClimatePete: The only possible mechanism would be hydrological cycle effects. Needless to say, if this was the case then it would have to cause more drought over certain latitudes of land to provide the increased latent heat released in the effective radiative layer.
I think that you need to consider the changes to both dry and wet thermals (hydrological cycles). Romps et al estimated a change in the mechanical energy (CAPE) rate of transfer that would accompany a surface temperature increase, and I used that in my “surface sensitivity calculation”. Estimates of the change in the rate of the hydrological cycle (changes in rainfall) vary from 3%/C to 7%/C (O’Gorman cited in my post) which implies a change in the rate of transfer of latent heat from the surface to the cloud condensation layer. Thus, an increase in the rate of latent heat transfer (thorough the increase in the rate of the hydrological cycle) does not imply an increase in drought frequency, extent, or duration.
So energy goes into the effective radiating layer by 3 mechanisms, but is radiated to space by a single mechanism. Add to that the difference in the mass density between the surface and the effective radiating layer, and it is quite possible for the energy transport rate from the surface caused by a 1C increase in surface temperature to cause a higher increase in temperature at the effective radiating level.
In calculating the sensitivity at the surface, the changes in 3 transport mechanism must be considered. If in addition the increase in ocean surface temperature increases the size of the “iris effect”, then the changes in the radiation energy transfer rate are not simply summarize, but the increase in the net transfer rate from surface to upper atmosphere will probably be underestimated.
Here is a graph to make the point I was trying to make above. Sorry, I used heat instead of temperature…ooops. Temperature is the metric of how hot something is or average heat, heat is the cumulative measure of the kinetic energy.
Here is the SB Chart demonstrating that a black body of -85 degree C has a peak wavelength of 15 microns. By the time the chart gets to 10 microns, the radiation/absorption is down to near 50% of the peak. That wavelength however is also absorbed by H2O which is far more prevalent.
http://www.spectralcalc.com/blackbody_calculator/plots/guest1311087559.png
Here is the SB Graph of the earth’s average temperature, or about 18 degree C. As you can see, the earth’s radiation largely avoids the bands absorbed by CO2. Also, to warm the earth you have to trap heat of a temperature greater than the earth’s 18 degree C. Simply absorbing 18 degree C heat of temperature will simply maintain the temperature.
http://www.spectralcalc.com/blackbody_calculator/plots/guest1870814792.png
Anyway, all these discussions are moot, the oceans are warming. Can someone please explain how atmospheric CO2 can possibly warm the oceans. If we can’t explain how CO2 can warm the oceans, all this talk of CO2 is pure nonsense. What is warming the oceans is clearly what is warming the atmosphere…unless heat no longer rises in the atmosphere, and travel from hot to cold.
co2islife : “Can someone please explain how atmospheric CO2 can possibly warm the oceans.”
It is called the Greenhouse Effect. Not a great name, but widely used. It is not hard to find descriptions of how it works. You might start with Wikipedia.
I suppose your real problem is a failure to understand something fundamental, but I can not guess what that might be based on what you wrote.
Sorry, but at wavelengths of around 15 um, where CO2 has its strongest absorption line, water strongly absorbs. The penetration length is 10^-5 m, so it will warm up the first millimeter of the surface water. However, keep in mind that at 15 um and the narrow window, there is little energy in it, compared to the incident solar radiation, which by the way excludes this band because it got absorbed by the atmospheric CO2. It would be a nice exercise to calculate this energy balance, it may be negative due to the fact that the solar radiation has been stripped of the wavelengths at which CO2 absorbs! If there is a positive net balance, it is probably really small, only contributes to the top 1 mm of the ocean water at most, which may result in a tiny higher evaporation rate…
Here is the water absorption curve:
https://www.google.com/url?sa=i&rct=j&q=&esrc=s&source=images&cd=&cad=rja&uact=8&ved=0CAcQjRw&url=https%3A%2F%2Fen.wikipedia.org%2Fwiki%2FElectromagnetic_absorption_by_water&ei=criSVa6SN8vYtQXy0YX4Aw&bvm=bv.96783405,d.b2w&psig=AFQjCNEpQqA6eGuQc9Aec1xfGunvNGv4MQ&ust=1435765228134217
Regards, Stephan
Stephan,
OK, that is a question that can be answered.
Yes, the IR only penetrates into the top mm or so of the water. Where does the energy go then? Does the surface of the water get extremely hot? No, so most of the energy goes somewhere other than emission. Evaporation? Some, but the water molecules can not diffuse away from the surface fast enough for that to provide more than a small fraction of the heat flux. So what is left is that the heat gets transferred deeper into the water by convection (the surface of the ocean is highly turbulent) and conduction. Both processes are much faster in liquid than in air. So the water below the surface is warmed.
I put water in a pot, put the pot on my stove, turn on the stove. Much less than 1 mm thickness of the water is in contact with the pot, but the water gets hot.
co2islife: “Can someone please explain how atmospheric CO2 can possibly warm the oceans.”
sunshine warms the oceans. They cool by at least 3 mechanisms, one of which is radiation to the upper atmosphere and to space. Increased CO2 slows the radiation rate by absosbing radiation in the wavelengths characteristic of ocean surface temperature, resulting in a higher temperature. There is no completely adequate analogy for this effect: “greenshouse”, “blanket”, etc. all fai.
Well, it is all interesting, but when the additional CO2 between 1750 and 2011 imbalanced the global heat flux by a pitiful 2 W/m^2, it is also all academic and moot.
If you did the sums assuming the entire 2W/m^2 went into warming the atmosphere and surface then you would get a very nasty shock indeed. “Pitiful” is not the adjective you would then use to describe 2W/m^2.
As an example, less than 0.5 W/m^2 warms the oceans by 0.02 degrees C per decade. Also a “pitiful” figure. But the oceans can take around 1700 times the heat that the atmosphere does to warm the same degree. If all that heat (unlikely) were to warm the atmosphere then it would go up by 34 degrees C per decade 10% (still unlikely) would be 3.4 degrees per decade. 1% (plausible) is 0.34 degrees per decade or 3.4 degrees per century, and is certainly not “pitiful” warming.
The exact percentage varies with the random weather.
So 2W/m^2 is far from moot and pitiful.
“Can someone please explain how atmospheric CO2 can possibly warm the oceans. ”
That is a serious question. Can anyone explain how atmospheric CO2 can warm the oceans? Can anyone explain how the atmosphere with 1/2000 to 1/4000 the heat of the oceans warm them? How in the world can the oceans be warming and we are blaming CO2 for the warming atmosphere when we can’t explain how CO2 can warm the radiator of the earth, the oceans?
If the oceans are warming it’s from solar radiation, geothermal heat flux through the ocean floor, and volcanic activity. The oceans cover 70% of the earth, average 4,000 meters deep, and IPCC has no idea what’s happening below 2,000 meters.
“If the oceans are warming it’s from solar radiation, geothermal heat flux through the ocean floor, and volcanic activity. ”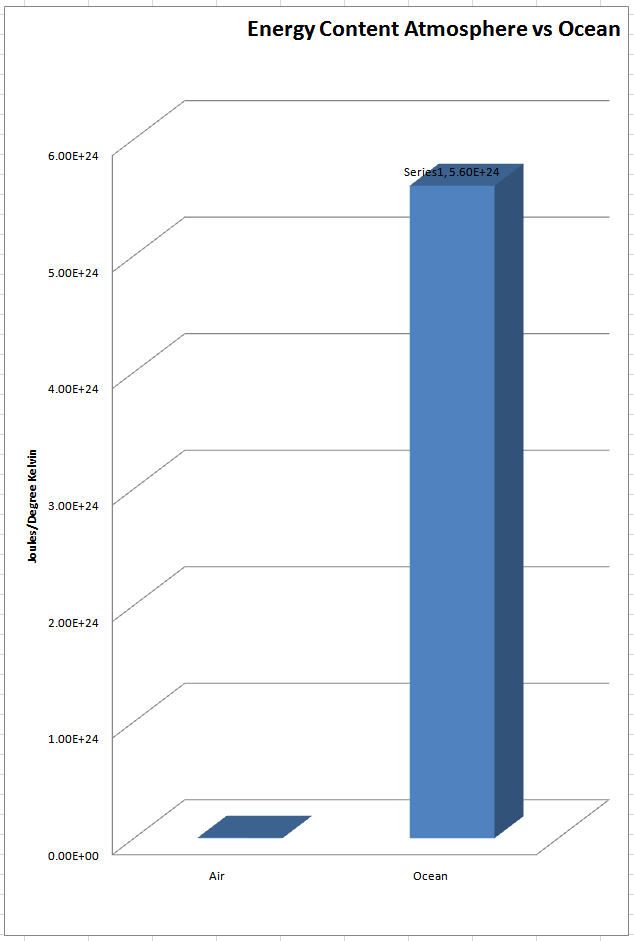

Yep, but what does that have to do with atmospheric CO2? How does CO2 cause volcanic activity? How does CO2 warm the oceans? IR radiation does not penetrate the oceans, especially IR at 15 microns.
http://www.seagrant.umn.edu/newsletter/2012/07/images/graphic_lightpenetration.jpg
Once again, the whole problem faced by the Warmists is that the oceans are warming. Common sense would lead one to believe that what is warming the oceans is also warming the atmosphere, just like the air above a boiling pot is warmed by the boiling water.
Basically the entire AGW argument boils down to the nonsensical belief that you can effectively warm a bath tub of water using a candle placed above the water…and that candle emits light that can’t penetrate the water.
Here are the numbers:
Heat capacity of ocean water: 3993 J/kg/K
Heat capacity of air: 1005 J/kg/K
The atmosphere has a mass of about 5×10¹⁸ kg
The total mass of the hydrosphere is about 1,400,000,000,000,000,000 metric tons (1.5×10¹⁸ short tons) or 1.4×10²¹ kg,
Basically it takes 4x more heat to warm a kg of water than air, and there are a whole lot more kg of water than air.
Putting those numbers into graphical form you get this game over chart for the Warmists.
This image pretty much destroys any logical explanation of atmospheric CO2 causing the oceans to warm.
http://wattsupwiththat.files.wordpress.com/2011/04/atmosphere-vs-ocean-heat-capacity.jpg?w=720
a more detailed discussion can be found here:
http://wattsupwiththat.com/2011/04/06/energy-content-the-heat-is-on-atmosphere-vs-ocean/
Here is another article on the topic:
http://scholarsandrogues.com/2013/05/09/csfe-heat-capacity-air-ocean/
Digging up data for this post also discovered that NOAA shows that ocean heat has been increasing:
Unfortunately I couldn’t find a NOAA chart for Atmospheric Heat. Strangely I wasn’t able to find any graphics of atmospheric heat content but plenty of them about the oceans. If you can find one please respond to this post with a link to the image.
Lastly, I stumbled upon this jewel. It looks like while the Warmist have been claiming ocean acidification due to CO2, It looks like NOAA claims that while we have been greatly increasing our CO2 production over the past 20 years+, the CO2 ocean flux has basically remained unchanged. Imagine that, more CO2 doesn’t result in more CO2 going into the oceans according to NOAA.
http://www.oco.noaa.gov/_images/Graphics/Air-SeaCO2FluxTrend_500x367.png
This jewel demonstrates that cooler water absorbs CO2 warmer water out-gasses CO2…imagine that, Henry’s Law actually explains reality. So once again, the sun warms the oceans, the warmer oceans release CO2, just like a warm can of Coke releases more CO2 bubbles than a cold can.
http://cwcgom.aoml.noaa.gov/erddap/griddap/aomlcarbonfluxes.graph
The more you look behind the curtain of Global Warming the less there is to find. The “science” of global warming is a paper tiger, an emperor with no clothes and it is no wonder they want to cut off debate, just like the Wizard of Oz used to curtain to hide his fraud.
Once again, anyone interested in protecting/restoring the integrety of science and academia should demand Congress establish an impartial agency to verify the validity of the conclusion reached by research used to form public policy. The same scientific riggers used by the FDA to verify drug company research needs to be applied to the publicly funded researchers as well. We need to hold these “researchers” accountable. This global warming hoax is the Tobacco hoax on steroids. We don’t have the press, academia and government being the watch-dogs in this case, we have the press, academia and the government as the perpetrators of this fraud.
How can the deep oceans possibly absorb heat?
The above diagram shows a combination of 161 W/m^2 of sunlight and 398 W/m^2 of infrared (IR) radiation hitting the surface of land and sea. How can this possibly result in deep ocean warming to depths of 2000m? Sunlight can penetrate a little, but not too far, and infra-red mostly gives up after 100m.
However, the ocean surface layer clearly can be heated by this total of 559 W/m^2 of sunlight + IR.
The surface layer gets hotter, and some of it evaporates, cooling it a little. It gets hotter again and again there is evaporation.
After a while there has been quite a bit of evaporation and the surface layer is also warmer than the water below.
Surely warmer water is less dense than cooler water? So how could it descend.
Ah, we’ve forgotten the evaporation bit. The evaporation is eliminating water, but the ocean is salty, so the evaporation is also concentrating the salt.
At the same temperature, more salty water is more dense than less salty water. In fact, if the difference in salinity is high enough, warm more-salty water can be more dense than cooler less-salty water.
So the heat can descend into the deep oceans because of the additional salinity of the warm water caused by surface evaporation concentrating the salt in the water.
http://aquarius.umaine.edu/images/ed_mixing_sinking.png
As a specific example, water at 15 degrees C and salinity 35.6 PSU has a density of 1.0265 g/cc. Water at 10 degrees C and salinity of 33.7 PSU has a density of 1.0260 g/cc – less dense. So the hotter water will descend because it has higher salinity and is more dense.
And that is how heat from the ocean surface can find itself transferred to the deep ocean, displacing cooler but less salty water which is then forced to rise.
Three Legged Stool of CAGW: 1) Anthropogenic 2) Radiative Forcing 3) GCMs
Leg the 2nd
Radiative forcing of CO2 warming the atmosphere, oceans, etc.
If the solar constant is 1,366 +/- 0.5 W/m^2 why is ToA 340 (+10.7/- 11.2)1 W/m^2 as shown on the plethora of popular heat balances/budgets? Collect an assortment of these global energy budgets/balances graphics. The variations between some of these is unsettling. Some use W/m^2, some use calories/m^2, some show simple %s, some a combination. So much for consensus. What they all seem to have in common is some kind of perpetual motion heat loop with back radiation ranging from 333 to 340.3 W/m^2 without a defined source. BTW additional RF due to CO2 1750-2011, about 2 W/m^2 spherical, 0.6%.
Consider the earth/atmosphere as a disc.
Radius of earth is 6,371 km, effective height of atmosphere 15.8 km, total radius 6,387 km.
Area of 6,387 km disc: PI()*r^2 = 1.28E14 m^2
Solar Constant……………1,366 W/m^2
Total power delivered: 1,366 W/m^2 * 1.28E14 m^2 = 1.74E17 W
Consider the earth/atmosphere as a sphere.
Surface area of 6,387 km sphere: 4*PI()*r^2 = 5.13E14 m^2
Total power above spread over spherical surface: 1.74E17/5.13E14 = 339.8 W/m^2
One fourth. How about that! What a coincidence! However, the total power remains the same.
1,366 * 1.28E14 = 339.8 * 5.13E14 = 1.74E17 W
Big power flow times small area = lesser power flow over bigger area. Same same.
(Watt is a power unit, i.e. energy over time. I’m going English units now.)
In 24 hours the entire globe rotates through the ToA W/m^2 flux. Disc, sphere, same total result. Total power flow over 24 hours at 3.41 Btu/h per W delivers heat load of:
1.74E17 W * 3.41 Btu/h /W * 24 h = 1.43E19 Btu/day
Suppose this heat load were absorbed entirely by the air.
Mass of atmosphere: 1.13E+19 lb
Sensible heat capacity of air: 0.24 Btu/lb-°F
Daily temperature rise: 1.43E19 Btu/day/ (0.24*1.13E19) = 5.25 °F / day
Additional temperature due to RF of CO2: 0.03 °F, 0.6%.
Obviously the atmospheric temperature is not increasing 5.25 °F per day (1,916 °F per year). There are absorbtions, reflections, upwellers, downwellers, LWIR, SWIR, losses during the night, clouds, clear, yadda, yadda.
Suppose this heat load were absorbed entirely by the oceans.
Mass of ocean: 3.09E21 lb
Sensible heat capacity: 1.0 Btu/lb °F
Daily temperature rise: 1.43E19 Btu/day / (1.0 * 3.09E21 lb) = 0.00462 °F / day (1.69 °F per year)
How would anybody notice?
Suppose this heat load were absorbed entirely by evaporation from the surface of the ocean w/ no temperature change. How much of the ocean’s water would have to evaporate?
Latent heat capacity: 970 Btu/lb
Amount of water required: 1.43E19 Btu/day / 970 Btu/lb = 1.47E+16 lb/day
Portion of ocean evaporated: 1.47E16 lb/day / 3.09E21 lb = 4.76 ppm/day (1,737 ppm, 0.174%, per year)
More clouds, rain, snow, etc.
The point of this exercise is to illustrate and compare the enormous difference in heat handling capabilities between the atmosphere and the water vapor cycle. Oceans, clouds and water vapor soak up heat several orders of magnitude greater than GHGs put it out. CO2’s RF of 2 W/m^2 is inconsequential in comparison, completely lost in the natural ebb and flow of atmospheric heat. More clouds, rain, snow, no temperature rise.
Second leg disrupted.
Footnote 1: Journal of Geophysical Research, Vol 83, No C4, 4/20/78, Ellis, Harr, Levitus, Oort
Radiative forcing and energy movement between oceans, clouds and water vapour are not comparable because over an extended period of time radiative forcing is always in the same direction, while the energy flows into and out of the others average to zero.
Hence the longer things go on the more marked the impact of radiative forcing will be. As it stands, one second of incoming sunlight is the same energy as three minutes of RF (at 2 W/m^2)
This is in response to :
Nicholas Schroeder said
Nicholas also said :
On the contrary, in the diagram above the downward infrared emissions due to GHGs are 342 W/m^2. which is the same order of magnitude as all the other major flows on the diagram. Incoming sunlight is very similar, outgoing solar plus infrared is very similar. Thermal and other emissions from the surface total 50% more. But 342 W/m^2 is a huge thermal flow, don’t you think, given that it would be zero if there were no greenhouse gases in the atmosphere?
That diagram doesn’t include any of the energy that is changed in form. Sunlight that hits plants and algae is converted to chemical energy, and much of that is sequester into deposits that later become oil. Much of that energy is used to oxidize things, and trigger other chemical reactions. Some of that energy is even converted to electrical/mechanical energy through the solar panels. The only way the incoming energy is equal to the outgoing energy is if there is no photosynthesis. Some of that energy is used to split a water molecule, and create sugars.
co2islife,
That’s very true. However, there are a few factors to consider.
Firstly photosynthesis works on sunlight only, so that excludes the 342 W/m^2 of downwelling IR.
Secondly the efficiency of photosynthesis is poor – 0.1 to 2% generally, but 7-8% for sugar cane (which is a very small proportion of total photosynthesis grown) according to https://en.wikipedia.org/wiki/Photosynthetic_efficiency#Typical_efficiencies
Thirdly, land use changes are roughly neutral. That means energy is absorbed in summer by plants, then approximately the same energy is released in winter as leaves drop and rot.
And lastly the energy used by photosynthesis is minute. It’s only about 10x the human use of energy which is around 2.3 TW, making photosynthesis 23 TW = 2.3 x 10^13 W. Divide by the area of the earth which is 510 million square miles or 5.1 x 10^14 square metres, making it 0.045 W /m^2.
So photosynthesis is only 1/40th the size of the radiative forcing of 2W, and only 1/13th of the size of the smallest flow on the diagram – 0.6W imbalance on the left hand side.
So it’s very questionable that photosynthesis energy flows belong on the diagram as we are talking noise level here.
398-239=159 not 342. Are these some kind of breeder GHGs that emit more than they absorb? Maybe that’s why there are some sectors that object to this on 2nd law considerations.
IPCC has clouds at -20 W/m^2, ten times the cooling of CO2 heating
400 ppm is pretty darn close to zero. The GHE is due to water vapor, not GHGs. See Miatello et. al.
“400 ppm is pretty darn close to zero”
And yet ALL life on this planet depends on that near zero amount. So maybe size doesn’t matter.
Nicholas,
You are right to question GHG downwards IR of 342 W/m^2, because I was too hasty and it isn’t the downwelling GJG IR, but the total downwelling IR. But the analysis above of what the right answer is omits some flows.
The easiest way to look at it is that the non-IR flows up are 84 + 20 = 104 W and there is 79 W of sunlight deposited in the atmosphere for a total of 183W of non-IR energy deposited in the atmosphere. The IR flows from this are therefore going to be approx 92W up and 92W down.
So the thermal outgoing TOA IR from the ground alone is 239 – 92 = 147, and the thermal down surface IR due to the GHG effect alone is is 342 – 92 = 250 W/m^2.
The numbers now balance because 398W/m^2 IR from the surface ends up with 250 reflected back down from the GHG effect and 147 leaving at the TOA.
So the downwelling GHG IR radiation is only 250 W/m^2 and not 342 W/m^2. My apologies for being too quick first time.
According to “The greenhouse effect and carbon dioxide” Zhong and Haigh, 2013, the outgoing IR flux at the TOA would be 70.6 W/m^2 bigger with no water vapour in the atmosphere, and 25.5 W/m^2 bigger with no CO2 in the atmosphere, with all other constituents unchanged except the one mentioned.
See table 1 of http://onlinelibrary.wiley.com/doi/10.1002/wea.2072/full .
This means that the GH effect of CO2 is approximately one third that of water vapour. The difference is that CO2 levels and GH effect is determined by humans, whereas that of water vapour is approximately constant except for the $64m dollar question of whether temperature increases due to CO2 levels are amplified (and how much) by causing slightly more water vapour in the atmosphere with its corresponding GH effect too.
Way too much confusion over facts. I had to drop off during the discussion of whether O2 and N2 participate in photon absorption or emission. They don’t. It is not a fact that everything emits thermal radiation, and if it is not a fact, it cannot be a principle. O2 and N2 do not have any resonance bands for absorption/emission in the wavelengths we are talking about. (Nearly everything will transport heat by conduction, however.)
Another misconception is that there is some mysterious reservoir of heat in the atmosphere that is either being pumped or drained by absorption/emission. The absorption/emission process, when in equilibrium, is a net-neutral process. There is neither gain nor loss of normal heat (molecular kinetic energy). For every photon absorption that increases the energy of a “greenhouse gas” molecule, to share with the rest of the atmosphere, there is a corresponding spontaneous atmospheric heating of a dumb, unsuspecting “greenhouse gas” molecule that will result in a photon emission. (All thermal processes are stochastic at the molecular level.) The re-radiating molecules are just “pass-throughs.”
The best way to think of the re-radiation process is that it amounts to a scattering of photons in the affected IR band, with effectively half the scatter going up (and out) and half the scatter going down again. (Yes, there are some scattered horizontally, but they wind up being scattered up or down eventually.) The clear atmosphere is just a scattering filter. It gets heated or cooled by contact with the surface of the Earth, and its heat content is miniscule compared to terrestrial surfaces. (Clouds are different creatures, but they are driven by the thermodynamics of gaseous and liquid water.)
So Michael, you do understand that if a gas has a Temperature that is higher than zero K, that implies that the molecules of that gas are in constant collisions with each other. That is what “heat ” is; the energy of those purely mechanical kinetic energy collisions.
Since they can’t be all marshalled to only collide in certain directions, all of that KE can never be extracted to do mechanical work efficiently.
That is why “heat” (noun) is the garbage of the energy kingdom.
And it is during the interaction of two atoms or molecules in a thermal collision, that the electric charge distribution of the atom or molecule becomes distorted, so that a normally charge symmetric gas molecule like N2 or O2 or even an atomic gas like Argon, that in free flight has a zero electric dipole moment, will during a collision develop a non zero dipole moment, and also quadrupolar and other higher order electric moments, which according to Hertz / Maxwell are perfectly capable of radiating EM radiation during the collision.
If you don’t understand why this is so, just consider that the nucleus and the electron “cloud” of an atom both have the same but opposite electric charge, so both can generate the same Coulomb forces.
But virtually all of the KE and momentum of an atom or molecule in motion, is contained in the nucleus, which is typically about 3750 times more massive than the electrons.
The proton mass is 1836 times the electron mass, while the neutron mass is 1837 times the electron mass, so most light atoms have a 1:1 n-p ratio.
And accelerating electric charges DO radiate electro magnetic radiation continuously. Of course a charge acceleration is the same as a varying electric current. And you don’t actually have to have any copper wire antenna to have a varying electric current which can cause radiation.
So diatomic molecules can and do radiate EM thermal radiation when at a Temperature above zero K.
Now MODTRAN as far as I know calculates the molecular absorption spectra based on the known electronic structure of different molecules.
I’m not aware that it even calculates thermal radiation spectra which do not depend on specific molecular or atomic electron structure (quantum mechanics).
Now you can’t call the atmospheric gases O2 or N2 or Ar Black Body radiators, because a black body radiator is a body that completely absorbs ALL EM radiant energy from down to, but not including zero frequency, and up to but not including zero wavelength.
No such object or material exists or can exist, and in fact there is NO material that can absorb 100% of even a single frequency or wavelength, let alone all possible frequencies.
So atmospheric gases are far too low in molecular density to be optically opaque, compared to liquids or solids, but the still can and do radiate EM radiation down at the single atom or molecule level, when they collide with each other.
The time during which two molecules approaching each other to collide, can begin to “see” each other electrically (Coulomb forces), until the crush into each other and then part again, is an eternity compared to the time it takes to emit EM waves from the decelerating and accelerating electric charges in their electrons and in the nuclei.
So the atmospheric gases can radiate thermally, and the spectra depends on the Temperature, and not on the species of molecule.
So I don’t think you can use MODTRAN for that.
In any case, the extra-terrestrial LWIR spectral signature of the earth seems to have a thermal spectrum that is characteristic of the surface and near surface Temperature, rather than any stratospheric Temperature. And the atmospheric gas densities are highest near the surface, so that’s where I would expect the bulk of the atmospheric thermal radiation to come from.
I don’t buy that a planet needs a GHG containing atmosphere or else it will fry because it can’t radiatively cool the atmosphere.
g
The Stanford two mile long electron linear accelerator, exists precisely because accelerating electric charges DO radiate EM radiant energy continuously.
So if you try to accelerate electrons in a circular orbit, the continuous radiation losses eventually eat up all the energy you add per lap and you reach an energy limit.
Protons are 1836 times more massive than electrons so you can get a factor of 1836 times as much KE with protons.
Thanks for the condescension, George. I have three degrees in Aeronautics and Astronautics, specializing in gas physics. My day job used to be designing multi-megawatt infrared lasers that propagated through the atmosphere. O2 and N2 were perfectly transparent for our purposes. They are not dipole molecules and cannot execute a quantum transition allowing for the absorption or emission of a photon. At least not at energies lower than the ionization energy.
The sort of thing you are talking about is an “induced dipole,” resulting from the temporary distortion of electronic fields during a molecular collision. In the 1970s, Abraham Hertzberg of the University of Washington came up with a concept for a laser utilizing this concept, but subsequent experimental work showed that the effect was nil.
There is no known state transition where the rotational/vibrational energy associated with a GHG molecule absorbing a photon can be converted into the linear momentum associated with its kinetic temperature. A collision may induce the re-emission of a photon from an energized GHG molecule and while from a macroscopic point of view this is equivalent to an increase in linear momentum, they are quite different and only photons can participate in the radiant balance of the planet. Trenberth conflates these because otherwise, there is no wiggle room to support CAGW.
co2isnotevil
[Too much] CO2 is evil (based on your definition above) and here is why.
Every time a CO2 molecule collides with another molecule then the available energy is redistributed. The thermodynamics of this are well know, and say that all the available vibrational or translation modes get an energy of kT/2 on average. k is Boltzman’s constant and T is the temperature in K.
Modes include x, y and z direction velocities which are not quantised so always get their fair share. =kT/2.
Then all molecules (but not single atoms like Argon) can have rotational energy in at least two directions, but rotation about the axis joining the two atoms for a two-atom molecule do not get any energy at all.
And lastly we have internal molecular vibrational modes. For a two-atom molecule the only available mode is a stretching and shrinking of the bond, and the energies are generally too high to allow measurable activation of the vibration at normal surface temperatures. For a three-atom molecule (H20, CO2, O3, CH4) there are other vibrational modes available with lower energies which cause the IR spectrum given in figure 4a of http://onlinelibrary.wiley.com/doi/10.1002/wea.2072/full (Zhong and Haigh 2013 – The greenhouse effect and carbon dioxide). However, because the energy of these other vibrational modes are not kT/2 (at room temperature), they are not 100% populated. But they have a significant population unlike the 2-atom molecule modes.
For CO2 the vibrational energy can be converted to linear or rotational energy of that or another molecule. The time to spread energy evenly between the various modes which take kT/2 each depends on the collision rate, which increases with temperature and density. Close to the ground IR radiation absorbed into vibrational modes gets thermalised quickly (a microsecond), but high up it takes some time to do this, which is just proportional to temperature and pressure. Nevertheless, it does happen everywhere at timescales significant in talking about CO2 as a GHG.
See http://rabett.blogspot.co.uk/2010/11/its-turnstile.html
So CO2 vibrations caused by absorption of IR pass energy on to other modes faster than you can say boo to a goose, and are also populated by energy from them. Statistically 6% of CO2 molecules are activated at room temperature at any one point in time.
This stuff is just standard thermodynamics, by the way. The only complicated thing about it is the calculation or measurement of the energy required to activate the various vibrational modes – and generally the theory and measurement agree well.
Climate Pete,
You are also confused by the conflation of energy transported by photons and energy transported by matter. Redistributing energy from an energized GHG molecule can only happen upon the collision with a ground state GHG molecule, in which case the state of the colliding molecules can flip, however, this can not happen upon the collision with a non GHG molecule which has no resonant mode to exchange the required quantum of energy with. Ultimately, this energy of a state change will end up emitted by a GHG molecule as a photon, either spontaneously or consequential to a collision with a non GHG molecule.
If what you say is true, then the spectral characteristics of the energy emitted by the planet would have almost no energy in the various GHG absorption bands as all of the energy in those bands would be absorbed and converted into the kinetic energy of translational motion. Instead, we measure about half the energy there would have been had there been no GHG absorption which is clear evidence that the energy of absorbed photons stays with photons, half of which ultimately escape the planet and half of which are returned to the surface, warming it beyond what the post albedo solar input can do on its own. How can you explain the failure of this simple test of your hypothesis?
“Redistributing energy from an energized GHG molecule can only happen upon the collision with a ground state GHG molecule”
..
That is not true. If two energized GHG molecules collide, and one has a large amount of kinetic energy, it can impart a fraction of that energy on to the molecule it collides with.
Yes, but I’m considering that most GHG molecules in the atmosphere are quickly returned to the ground state by the collision with an N2/O2 molecule and that few, if any, are in high enough states of excitation where complex state exchanges are possible with other highly energized GHG molecules.
This is what I love about the field of “climate science.” They rush to a conclusion, the only conclusion, that being CO2 is the cause without ever even really trying to understand what is going on.
“IR does indeed warm water. Place a bowl of water under a heat lamp and see what happens.”
I don’t believe that is the case if you use an IR lamp with peak radiation of 15 microns emitting at the same energy level as the earth. About 25 W/M^2/micron
http://s11.postimg.org/qt4vzvq2b/Sun_Earth_Comparison.png
Here is a blog posting by one of the greatest climate scientists out there asking for answers.
Can Infrared Radiation Warm a Water Body?
April 21st, 2014 by Roy W. Spencer, Ph. D.
http://www.drroyspencer.com/2014/04/can-infrared-radiation-warm-a-water-body/
He starts his blog posting highlighting what I’ve been saying:
“I frequently see the assertion made that infrared (IR) radiation cannot warm a water body because IR only affects the skin (microns of water depth), whereas solar radiation is absorbed over water depths of meters to tens of meters.”
He concludes where I would have though a real science would have started…designing a simple experiment.
“I would like to hear what others know about this issue. I suspect it is something that would have to be investigated with a controlled experiment of some sort.”
I would like to see the results of this experiment. How difficult can be it to shine an IR light emitting 15 microns at the proper intensity directly onto a fish tank of water. My bet is that the temperature of the water won’t change one iota. More importantly is that even if it did warm, it wouldn’t be due to CO2. CO2 and H20 basically absorb the same wave lengths, and H20 is at a much higher concentration in the atmosphere, especially directly over water. In reality what is most likely happening, if in fact GHGs are the cause of the warming, it is due to the sun warming the oceans, increasing evaporation, and the H20 that is causing the warming, not CO2.
Figure 10 illustrates that a film of water thicker than 0.05 mm will absorb most
of the infrared radiation longer than two microns.
https://www.watlow.com/downloads/en/training/STL-RADM-89.pdf
It looks like 10 microns at high enough intensity may warm water, but we already know that. It most likely causes evaporation.
If far infrared rays of about 10㎛, equivalent to oscillatory wavelength range of water molecule, are irradiated, the resonance absorption occurs, leading to decrease of clusters and faster movement of water molecules. In other words, the water is activated.
http://www.supergreenuk.com/whyinfrared.html
An ordinary bottle of water at about 15 deg C radiates LWIR EM radiation at about 390 Wm^-2 just like the mean Temperature earth surface.
So that is what you need to use as a LWIR source to demonstrate the green house gas warming by CO2 or other GHG molecules.
A “heat” lamp or light bulb can be up to half the temperature of the solar surface, or ten times the earth surface Temperature. So it will have a total BB emittance of up to 10,000 times that of the earth surface, and its peak spectral radiant emittance can be up to 100,000 times that of the earth surface. And that emission is at wavelengths totally absorbed by microns of water.
So using any kind of heat lamp is a fraud. Use a battle of water; or even a Coke or Pepsi would do (chilled to 15 deg C.
You guys have missed the point. If the ocean water was not salty then there would be no mechanism to transmit heat to the depths of up to 2km at which the ARGO probes have measured an increase in temperature.
The water is heated at the surface. Evaporation (of which there is plenty) makes the surface water more salty because the water containing the salt evaporates but the salt does not, and more salty water is more dense. if it is salty enough, the warmer water can descend because it is more dense than colder water which also happens to be less salty. See here for a full description and chart of densities by temperature and salinity.