Guest Post by Bob Tisdale
Dr. Roy Spencer introduced the updated and much corrected UAH atmospheric temperature data in his blog post Version 6.0 of the UAH Temperature Dataset Released: New LT Trend = +0.11 C/decade. The new temperature anomaly data for the lower troposphere, mid troposphere and lower stratosphere are presently in beta form for comment. That is, they’re not official…yet. I suspect the update will not go over well with the catastrophic-anthropogenic-global-warming crowd. Links to the version 6.0 beta data are at the bottom of Roy’s post, which also contains a detailed discussion of the updates. So if you have questions, please ask them at Roy Spencer’s blog through the above link. This post is a simple data presentation.
The version 6.0 beta temperature anomaly data for the lower troposphere used in this post are here.
In this post, we’ll take a quick look at the new UAH version 6.0 beta lower troposphere temperature anomaly data, comparing it to:
- the current UAH version 5.6 data
- the RSS lower troposphere temperature data.
But first…
BASED ON LINEAR TRENDS, THE NEW UAH LOWER TROPOSPHERE TEMPERATURE DATA SHOW NO WARMING FOR 18+ YEARS, LIKE RSS
For Figure 1, I’ve extended the new UAH version 6.0 beta and the RSS lower troposphere temperature anomaly data as far back in time as they could go while showing no warming based on their linear trends. The new UAH data show no warming for 219 months, and for the RSS data, it’s 220 months.

Figure 1
A QUICK OVERVIEW OF LOWER TROPOSPHERE TEMPERATURE DATA
The following is a reprint of the initial discussion of lower troposphere temperature data from the monthly updates. The most recent update is here.
Special sensors (microwave sounding units) aboard satellites have orbited the Earth since the late 1970s, allowing scientists to calculate the temperatures of the atmosphere at various heights above sea level. The level nearest to the surface of the Earth is the lower troposphere. The lower troposphere temperature data include the altitudes of zero to about 12,500 meters, but are most heavily weighted to the altitudes of less than 3000 meters. See the left-hand cell of the illustration here. The lower troposphere temperature data are calculated from a series of satellites with overlapping operation periods, not from a single satellite. The monthly UAH lower troposphere temperature data is the product of the Earth System Science Center of the University of Alabama in Huntsville (UAH). UAH provides the data broken down into numerous subsets. See the webpage here [version 5.6 data]. The UAH lower troposphere temperature data are supported by Christy et al. (2000) MSU Tropospheric Temperatures: Dataset Construction and Radiosonde Comparisons. Additionally, Dr. Roy Spencer of UAH presents at his blog the monthly UAH TLT data updates a few days before the release at the UAH website. Those posts are also cross posted at WattsUpWithThat. UAH uses the base years of 1981-2010 for anomalies. The UAH lower troposphere temperature data are for the latitudes of 85S to 85N, which represent more than 99% of the surface of the globe.
UAH VERSION 5.6 VERSUS UAH VERSION 6.0 BETA
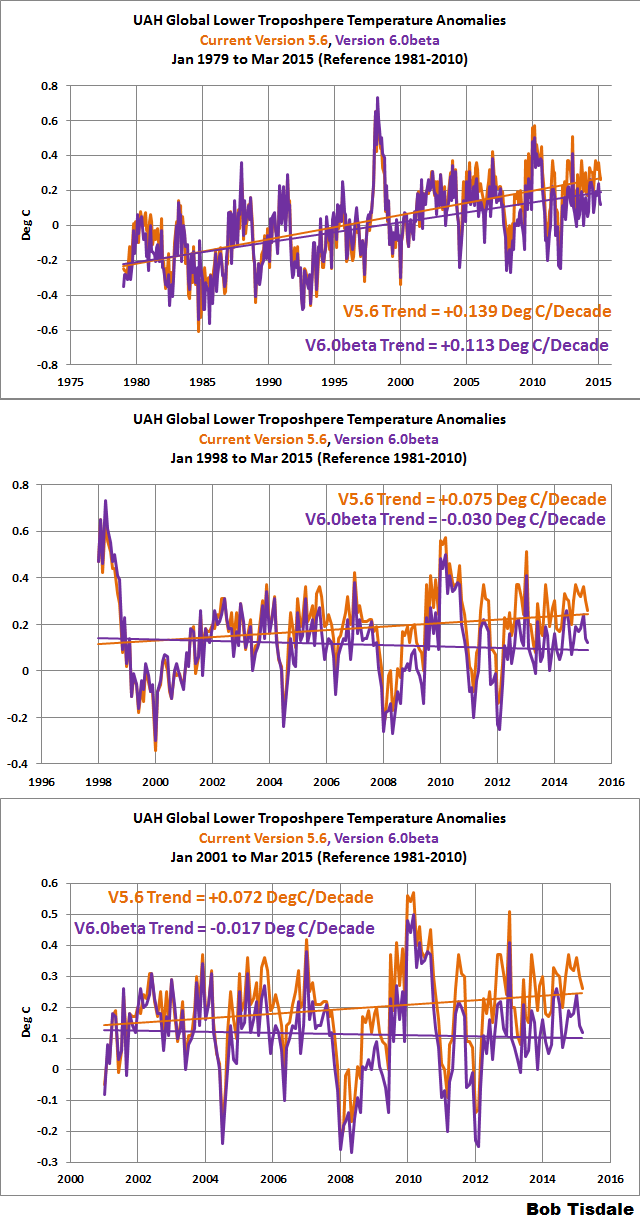
Figure 2 compares the current version 5.6 UAH lower troposphere temperature anomaly data to the recently released version 6.0 beta. The comparisons start in the Januarys of 1979, 1998 and 2001 and run through March 2015. The first full year of the UAH lower troposphere temperature data is 1979, while 1998 and 2001 are commonly used as start years during discussions of the recent slowdown in global surface and global lower troposphere temperatures. They are the same time periods we present in the monthly surface and lower troposphere temperature anomaly updates. See the most recent update here.

Figure 2
Since 1979, the new version (v6.0 beta) of the UAH lower troposphere temperature data show a noticeably lower warming rate than current version 5.6 data. For the periods starting in 1998 and 2001, the new beta version data show cooling of the lower troposphere based on the linear trends, while the current 5.6 version data show warming.
RSS VERSUS UAH VERSION 6.0 BETA
The warming rate since 1979 for the new UAH data is slightly less than (basically the same as) the lower troposphere temperature anomaly data from RSS. The shorter term cooling rates since 1998 and 2001 are also comparable. See the graphs in Figure 3.

Figure 3
CLOSING
The RSS lower troposphere temperature data used to be an outlier, showing much lower trends than the surface temperature data and the UAH lower troposphere data. That will no longer be the case with the new UAH version 6.0 data.
SOURCES
The UAH version 6.0 beta lower troposphere temperature anomaly data are here.
The UAH version 5.6 lower troposphere temperature anomaly data are here.
The RSS lower troposphere temperature anomaly data are here.
Will someone please tell me where “global warming” is happening, so that I can relocate there a.s.p.
I think it’s just the Arctic Circle, Alaska. But I haven’t checked. Everywhere else is pretty normal, I think.
It’s in warmunists’ koolaid-soaked, fevered brains, but I don’t think you want to go there.
I especially like the last graph because it starts in Jan 2001. No one can say the negative slope is because you started at a super El Nino year like 1998.
Ralph see comment above
http://wattsupwiththat.com/2015/04/29/new-uah-lower-troposphere-temperature-data-show-no-global-warming-for-more-than-18-years/#comment-1921149
also cooling trend on downslope from the 2003 peak of the millennial cycle at
http://www.woodfortrees.org/graph/rss/from:1980.1/plot/rss/from:1980.1/to:2003.6/trend/plot/rss/from:2003.6/trend
Each August since 1998, Beloit College in Beloit, Wis., has released the Beloit College Mindset List, providing a look at the cultural touchstones and experiences that have shaped the worldview of students entering colleges and universities in the fall.
I’m still waiting for the lack of warming to make it onto the Beloit College Mindset List with some statement like: This year’s freshman have been constantly bombarded with the concept of global warming throughout their lives even though there has been no warming since they were born.
https://www.beloit.edu/mindset/previouslists/
It’s too bad climate science is so tightly coupled to politics. Instead of debating people should be applauding efforts like this to make measurement systems more consistent and models more useful (http://wattsupwiththat.com/2015/04/28/bombshell-scripps-says-arctic-sea-ice-may-return-forecasts-based-on-simplified-arguments/).
New headline
Increases in CO2 cause ‘unnatural’ pause in temperature record.
Bob, using your link to v6.0 I checked to see that the 1981-2010 average of the global temps was 0.0 (as it is for the v5.6 dataset) and came up with -0.02. Doesn’t affect trends but might affect other things such as a comparison with RSS.
looks like he changes the past
You for one, would surely recognise changing the past, you and your Besty’s.
Unlike BEST and GISS. LOL
So UAH v6 now converges with RSS. That adds to the credibility and authority of both.
Well that, and the correlation to weather balloon and radiosonde data. So yes, more credibility.
What credibility does SST data have? Especially when there are no weather stations covering approximately 75% of the Earth, most noteably at the poles where the warming is theorized to take place.
This was an on-message ‘cut and paste’ comment stolen from further up the thread. Just testing if all my posts are consored or only those that are off-message.
Note to self: Make only on-message comments in future
[??? .mod]
VI,
Whatever you’re complaining about now may make sense to you, but it is nonsense to other readers.
Why is it that YOU are always supposedly being “censored”? Do you really think your comments are worth bothering with? Maybe the problem is between your head and your keyboard.
“Maybe the problem is between your head and your keyboard.’
Nope.. it problem is the starting point… not the communication point.
So you are promising never to post again? Cool.
Satellite temperatures have the POTENTIAL to be more reliable than surface datasets, but that doesn’t mean they actually are, at least yet. The raw data they produce needs a lot of processing and adjustment to come up with useable results. Sceptics ought to be just as sceptical of adjustments to UAH/RSS as they are to the adjustments to surface station data. With any RETROSPECTIVE adjustments the extrication of trends becomes questionable, and the adjustments need to be most rigorously justified.
Nevertheless, the convergence of UAH and RSS is rather impressive and I’d like to hear views from informed parties on the degree to which UAH and RSS results are independent, or not, and what differences there are in the methods each uses.
The basic factors affecting satellites are complicated, but consistently known and verified by the weather balloons, which are very PERCISE.
The factors affecting the surface record are far more inconsistent, with very IMPERCISE methodology for assessing constantly changing stations, on-site changes, ever changing methodology, lack of coverage in the early record, lost original data, homogenization ever increasing to the point that perfectly good readings are ignored and replaced by adjusted data, and questionable adjustments for UHI, all creating ample opportunity for confirmation bias and systemic errors. Additionally the satellites cover not only a much greater area of the atmosphere, but, due to the depth of the atmosphere the monitor, they cover a greater percentage then just the two dimensional area coverage.
Thanks, David.
I agree that the adjustments made to satellite data are of a very different nature, and that they have some degree of cross-referencing to the balloons, but Spencer and his team have changed the methodology overall, so that the trend is changed looking back.
Don’t get me wrong, I’m a fan of the satellites, but if you change the trend like that, you’ll have to answer Steve Mosher (comment above ‘looks like he changes the past’) and others. Their view is not just casual sniping. I happen to believe the BEST guys are absolutely straight about the surface temperatures, and they’ve come in for quite a lot of flak over their adjustments, so you have to expect a riposte or two.
That’s why I asked about the comparison between UAH and RSS methodology.
mothcatcher says: April 30, 2015 at 7:59 am :
” I happen to believe the BEST guys are absolutely straight about the surface temperatures, “
The majority of temperature measurements were done in or around human cities. With population growths from 1 billion to 7 billion do you believe that there was no increase in the UHI and thus in the measured temperatures from 1850 to 2000? And that had no influence to the data as BEST says? Really?
David, you say that weather balloons are very precise.
I’ll assume that the thermometers used on those weather balloon borne instruments are very precise (accurate).
I’ll even assume the less assurable; that the thermometer is actually reading the Temperature of the undisturbed atmosphere. that would be there if the weather balloon borne instrument wasn’t there.
So now I have a precise measurement of a single point in the atmosphere; and I’ll even assume that GPS and other means, will tell me to some high precision just exactly where that point is. (not that I think that is too important to know.)
So the only thing we don’t know, is what good such a single point measurement is, even though I might know from an atomic clock, exactly when the reading was taken. (not likely but I’ll take it).
The really big problem is, just how many such weather balloon borne instruments do I have flying at the same time, and just where are they all positioned.
It’s like I bored a hole 18 metres deep in South Africa, and the Cullinan Diamond came up in my core from that depth.
Can I assume that I just tapped into a complete spherical shell of type II-a diamond buried 18 meters below the surface, or is my single point sample, not indicative of anything useful to know ??
What the satellite systems are giving us, even if with less precision (which is not even necessarily true), is a rather decent global sampling of the variable Temperature profiles, which is a darn side more important than measurement precision.
Yes I need repeatability and stability, but proper sampling is far more important than single point accuracy or precision, which simply tells you that you know nothing, but you know it very precisely.
g
Lars –
I didn’t say they were RIGHT, just definitely not part of any conspiracy – even an unconscious one.
I think they’ve made a very good attempt to get it right, though, using genuinely-supportable analysis.
–
But I’m sure that looking at it from space is, in the end, going to be the right way to go. It should neutralise all the historical baggage of the surface measurements, UHI included. Whether we’ve reached that stage yet is what we are now discussing….
George, nobody is claiming that we can determine with any accuracy the temperature of the earth from the balloon readings.
The claim is that when the satellite and balloon readings overlap, they agree.
“PRECISE” as used above has two components. The first is that the reading itself is precise, the second is that we know precisely where the balloon is.
I found something interesting.
I think the first chart which is from surface data, and the first chart below it from figure 2, are a pretty good fit. I suspect the differences is I have some area’s of the planet that are not well sampled, but the gross shape looks pretty good.
What interesting is this is the difference between yesterday’s rising temp, and last night’s falling temp at each weather station, but it’s inverted, negative means it is cooling more than it warmed up, almost as if this was the energy from the surface that the satellite was detecting in the troposphere on it’s way out to space.
Sorry, but a bit daft today. Please explain again your first graph.
David A commented
The graph is the difference between how much yesterday’s temp went up (Max temp – min temp) that I subtract last nights falling temp (yesterday’s max temp – today’s min temp).
It is the same value as subtracting yesterday’s min temp from today’s min temp.
So now that you have the day to day change in min temp, I select stations that measured temps for at least 360 days. So for a single station if you sum these day to day changes and the temp didn’t change it should sum to zero. Now, take a region of (or all) stations, if they all sum to zero, the annual average would be zero, ie no change in temp.
What I’ve shown, with their own data, without adjusting anything, is that when you look at this it shows that on average for over 69 million daily records, it is slightly colder this morning than it was yesterday morning. And if the loss of night time cooling is the main way Co2 can effect surface temps, this proves that Co2 is not the cause on increasing temperatures, it cooled more than it warmed the prior day.
I found this a long time ago, and have been trying to find a strategy to reduce any error in this process, for instance I have 122 million samples, but the ones I did not include are stations that didn’t sample for a whole year, so say they didn’t have 2 months of cooling days (In NH Peak warming is in Spring, it has the largest positive change for a single day, and in the fall it has the largest loss in temp for a single day), so if you leave off 2 months of cooling, that station will show a warm bias. When I did this same process on all stations with more than 240 day’s per year, the results are pretty much the same, but there was an implied larger error (due to all of the missing measurements), and because one could argue that it was the error that caused the cooling, I’ve redone it so there is almost 0 missing data error (most 360 day stations are actually 365 or 366 days).
It also took me years to figure out how surface stations could all have a cooling trend, yet temps have gone up, until I realize the warming is not happening over land, it’s happening in the tropical oceans, and then that hot air mass moves over land base stations and cools down.
But if they show a cooling bias, there can not be a warming bias from co2.
Oh, I had to invert the data, which shows cooling spikes where UAH shows warming pulses, if my data is from the surface, and UAH is from space, I wonder if UAH is detecting the energy I see getting lost to space at night.
http://www.drroyspencer.com/wp-content/uploads/LT-trend-map-v6.02.jpg
Warmists said hot spots would be over the equator.
Probably near the oceans where the water vapour
was supposed to cause the feedback.
But some of these hot spots are over deserts.
The real fun begins now which is going to be a global temperature decline going forward(2015-2020 and beyond) not a rise. If this happens which is likely because all of the items which govern the climate(those being the PDO,AMO,ENSO SOLAR PRIMERY AND SECONDARY EFFECTS) will be phasing more and more toward a colder mode.
Actually this process started around the year 2005.
Gavin and Nick et al are going to have to start “adjusting” like crazy to maintain even the current zero trend.
Will be funny to watch, that’s for sure. 🙂
I’ve always thought that having a skeptic run the UAH and a “CO2 controls it” run the RSS was a good thing. They both are doing a real service to us all by keeping the data honest and accurate. Good work gentlemen. It is refreshing to see scientists keeping the data honest instead of fixing it to meet a political agenda. I tip my hat to both of you.
The satellite data is the data that is accurate and is showing the true picture of what global temperatures are doing. All the other data I do not consider. It is nothing more then a side show.
Fair enough.
But which is THE acuurate data set?
UAH or RSS? and why?
No, the other data is being collected which is good. Each provides a base to check the other against.
Obviously the sparsity of land/sea based measurement systems means that temp changes due to clouds can be missed, one hopes they average out but with the satellites there is no absolute guessing on this.
Real [raw] data should be used where possible, not just because it needs to be adjusted to fill in the gaps elsewhere then they back adjust the raw data to fit with the synthesized data.
I always thought RSS was the gold standard. Glad to see UAH now agrees.
It doesn’t though.
see
http://journals.ametsoc.org/doi/abs/10.1175/JCLI-D-13-00767.1
I note the sea ice data hasn’t been updated for quite some time. Cryosphere Today data is 11 days old, perhaps they should change their name?
And now the latest update from “Cryosphere Last Week”.
Soon to be renamed “Cryosphere Last Month”.
Here is something of interest. After all of the unprecedented hot temps reported in Australia over the last several years, it would appear that the winds of fortune have changed….http://www.weatherzone.com.au/news/record-april-low-temperatures-overnight-in-parts-of-northern-territory/285378
This morning I did some trend stuff on just the Australian UAH data. (trying to remember the numbers I got, its at home, I’m at work)
From 1979 to 1996, there was a very slight warming trend. +0.009ºC/decade (iirc)
Since [the] start of 1998, there has been basically a zero trend +0.0004ºC/decade (iirc)
The only warming was a small step of about 0.3ºC around 1998… just like in global RSS and UAH data.
Error.. those values are per year.
Still Australia warming since 1998 at 0.0004ºC/year…
How SCARY is that , hey !!!
Orbital decay has been around since the first satellite started circling the Earth.
http://www.ips.gov.au/Category/Educational/Space%20Weather/Space%20Weather%20Effects/SatelliteOrbitalDecayCalculations.pdf
Even Sputnik experienced it, and recorded it. Solar indices have also experienced orbital drift. These are routinely corrected for and follow pretty standard methods. I don’t see any controversy here whatsoever.
The UAH data show that none of the hottest ten years in the measured period have taken place since 2002, and even Christy agrees that 2014 was at least third hottest. Not sure how that disproves warming. http://nsstc.uah.edu/climate/2014/december2014/dec2014GTR.pdf
That was prior to recent correction. Not sure what your point is.
The Earth is five billion years old — the hottest year “eva” recorded is a pretty much meaningless mouth-breathing slogan chant,
Simple question:
If I tell you that my savings account is the “highest it has ever been” every year of my life, can you tell me if I have enough money to retire? No? Why not?
When you ask the wrong question, the answer means nothing.
Hottest year on record means NOTHING. If you don’t understand that, you should not be commenting.
Harry, it has not been warming since 2001, thus the misleading warmest year on record pablum, is shown for what it is, NOISE!
http://www.woodfortrees.org/graph/hadcrut4gl/from:2001/to:2015.3/plot/hadcrut4gl/from:2001/to:2015.3/trend/plot/rss/from:2001/to:2015.3/plot/rss/from:2001/to:2015.3/trend
Poor Harry, he has climbed a molehill, and now thinks he’s on top of the world.
Third hottest may sound quite hot, but the difference between first and third is what is relevant.

The difference between first and third is huge. About .35 degrees C. The difference between 4th through 7th is very small, maybe less then .1 C.
The atmosphere has cooled A LOT since 1998, Get used to that fact.
The cooling from the year 1998 to the year 2014 according to RSS was .295 degree C from the year 1998 to the year 2014, not “about .35 degrees C”. Singling out a month that reports more smacks of cherrypicking, in addition to choosing a start time during a century-class weather event to report a trend over 16 years.
Donald L. Klipstein
I am (charitably) assuming you are confused about “cherry picking points – Not deliberately misstating what was done. The interval (NOT the start time of the flat temperature!) was not “chosen” to produce a “flat line.”
Rather, the last global average temperature measured. Then the process “looks backwards” in time to find what earlier date was last equal to that temperature. Regardless of anything you believe, the global average temperature anomaly before the 1998 El Nino is the same as today’s global average temperature anomaly. Next month? We do not know.
Dates, lengths of time, are not “cherry picked” as you imply. If a satellite temperature measurement was available for 1934, it would have been selected. For 1884, it would have been selected. For 1264 AD, for 264 BC.
Flashy
your the only one
Volatility.
Confirmation of RSS. Damning evidence against the fudged surface data, global warming, “climate change” etc
How ironic.
It’s OK when Sat data is “fudged” but not when surface data is.
And which sat data do you subscribe to UAH of RSS ?
http://journals.ametsoc.org/doi/abs/10.1175/JCLI-D-13-00767.1
Glad you still have just enough brain to realise the difference between unsubstantiated and unexplained “fudges and adjustments” in the surface record, and fully explained and open, scientifically based corrections to the satellite data.
So your quite fine with fudged surface data then, and admit it is happening? not sure how that proves AGW though.
Tone, read the post please. You are embarrassing yourself.
How much over normal is the Antarctic Sea ice extent/area and the Total sea ice. Visually they look to be setting new records Anthony.
Should/Could we be informed?
Just to clarify, we were surprised that the trend went down…even though it was by less than 0.03 C/decade, a pretty small value. We expected it to remain mostly unchanged, still, you just don’t know till you run the numbers. But it is what it is. We are pretty confident that the new LT methodology is better than the old. We will have to wait to see if RSS chooses to retain the old way (which was my original invention) or eventually switches to the new way.
Since RSS and UAH are now more or less showing the same thing isn’t it better that RSS continue to use their independent methods? The two datasets then act to confirm each other.
One could make that argument.
It is not valid to cherry-pick the starting point for a trend without justification, especially when there is a large spike in the data.
Also the confidence interval calculation appears to be missing – is the zero-trend statistically significant?
Not this lie again?
The starting point for the trend is today. If you want to call that cherry picking you are free to do so, but you are just proving yourself to be an idiot by doing so.
The method is, starting today, how far back can one go and still have a trend that is zero or lower.
If you can find the “cherry picking” in that, I challenge you to name it.
MarkW.
I didn’t think you had the intelligence to refute me. And in the end, you accidentally agree with me! I did indeed find cherry-picking.
For any lurkers out there, see if anyone responds to these points:
– it is easy to find all sorts of trends in noisy monthly data. Perhaps it is more meaningful to use an annual average and look at trend lines for whole years, not just cherry-picked months
– the El Nino spike at 1998 will influence any trend lines that pass thru it. This is how the zero trend line trick works.
– confidence interval calculations? Is the zero trend line statistically significant?
harrytwinotter commented
Check!
This NCDC data measurements are said to be +/-0.1F, these are averages of daily station changes, yesterday’s Rising temp, and last night’s Falling temps. You can not directly compare rising and falling between years, as the specific stations change based on their sampling for that year. But Rise and Fall are directly comparable, So the trend to look at is the one marked Difference, and it is over all slightly negative, 50 of the last 74 years are negative, 30 of the last 34 are negative. Negative means it cooled more than it warmed.
YEAR RISING FALLING DIFFERENCE in F SAMPLE COUNT
1940 15.71097157 15.6830136 0.027957973 40450
1941 15.51280724 15.52291128 -0.010104032 37104
1942 17.19708086 17.18970456 0.007376309 50974
1943 18.49100199 18.49760266 -0.006600669 106368
1944 18.09759878 18.09670445 0.000894331 171413
1945 17.1321793 17.12947072 0.002708585 109356
1946 16.5656968 16.58263341 -0.016936611 75818
1947 17.02919548 17.01359006 0.015605421 104547
1948 18.61353831 18.62331222 -0.009773913 196738
1949 18.88868122 18.87702793 0.011653284 274738
1950 18.59500561 18.59388211 0.001123508 294791
1951 18.50607786 18.48544244 0.020635422 301060
1952 18.71132731 18.72543796 -0.014110651 366071
1953 18.42814736 18.43695155 -0.008804188 380160
1954 17.9957428 17.98496993 0.010772869 396199
1955 17.42433676 17.43215448 -0.007817724 361934
1956 17.72695923 17.71825583 0.0087034 355229
1957 17.5963675 17.62517297 -0.028805471 396449
1958 17.92289163 17.91920132 0.003690311 497221
1959 17.95581365 17.95448641 0.001327244 451085
1960 17.9869764 18.01315115 -0.026174748 508024
1961 18.03388368 18.03508739 -0.001203715 511500
1962 18.22151176 18.22907951 -0.007567744 514658
1963 18.34429315 18.33326835 0.011024797 507837
1964 18.15873062 18.15302857 0.005702056 485246
1965 17.3675503 17.35766173 0.009888569 335812
1966 17.50450441 17.52169516 -0.017190748 393037
1967 17.36575907 17.3679094 -0.002150335 397752
1968 17.55711991 17.5692133 -0.012093387 362322
1969 17.40666311 17.40243898 0.004224134 416322
1970 18.07845446 18.08878884 -0.010334386 486444
1971 17.41842199 17.41011975 0.008302247 176121
1972 17.24428991 17.23699402 0.007295899 172782
1973 18.29953951 18.30869743 -0.009157925 564178
1974 18.01006162 18.01329035 -0.003228731 805208
1975 18.61680029 18.63771804 -0.020917758 792671
1976 18.60309034 18.64140958 -0.038319245 1111465
1977 18.55697684 18.53033801 0.026638833 860841
1978 18.23385269 18.25044722 -0.016594529 1093975
1979 18.32688642 18.31058265 0.016303773 1028032
1980 18.25960534 18.27724383 -0.017638483 1129689
1981 18.31705388 18.3222249 -0.005171018 1099474
1982 17.62293309 17.63431024 -0.011377151 1055440
1983 17.42864046 17.4414735 -0.012833048 1166200
1984 17.37740432 17.38125902 -0.003854703 1220950
1985 17.48307532 17.48756305 -0.004487731 1185677
1986 17.58500848 17.58717123 -0.002162743 1254703
1987 17.4050167 17.40805318 -0.003036479 1235016
1988 17.77354186 17.78007015 -0.006528295 1365931
1989 17.55334589 17.5506176 0.002728288 1265629
1990 17.46665232 17.47565155 -0.008999233 1247673
1991 16.8231994 16.83149181 -0.008292409 1171457
1992 17.02449214 17.03832609 -0.01383395 1304978
1993 17.05782469 17.06297818 -0.005153482 1277117
1994 17.68736749 17.67993302 0.007434471 1298317
1995 17.33133396 17.33992032 -0.008586358 1293354
1996 16.91674692 16.9202606 -0.003513682 1318816
1997 17.21316377 17.20476681 0.008396956 1321324
1998 17.43171297 17.45367591 -0.021962934 1169739
1999 17.78586036 17.80618396 -0.020323599 1147533
2000 18.01024792 18.04020913 -0.029961211 1582673
2001 18.47831326 18.48061249 -0.002299226 1455055
2002 18.20320992 18.21497998 -0.011770051 1534148
2003 18.34413085 18.3384575 0.005673355 1562356
2004 18.25971399 18.26013423 -0.000420242 1769217
2005 17.95410103 17.95819944 -0.004098412 1928381
2006 18.31533458 18.3236668 -0.008332224 2058850
2007 18.26982812 18.28168462 -0.011856501 2070282
2008 18.23365477 18.24080168 -0.007146907 2324740
2009 17.87566685 17.88050967 -0.004842814 2401806
2010 17.88415593 17.88582125 -0.001665325 2506477
2011 18.00993136 18.012606 -0.002674635 2529280
2012 18.42713328 18.44643677 -0.019303489 2632177
2013 18.36008308 18.36336279 -0.00327971 2488421
9999 is an All years average.
9999 17.80549016 17.80964193 -0.004151764 69864812
Values are in F.
micro6550.
You are delusional.
I’ve posted all the code here (plus actual reports) http://sourceforge.net/projects/gsod-rpts/
the data is from NCDC’s Global Summary of Days here ftp://ftp.ncdc.noaa.gov/pub/data/gsod/
So feel free to show me how comparing the measured min and max daily temps and showing that they record an excess of cooling (ie’s radiating excess heat away).
The problem is I’m not doing anything a grade school kid couldn’t do, just doing on a lot of data.
harrytwinotter commented
Those that can, do.
Those that can’t, issue cat calls from the sidelines.
Usage of startpoint of an 18 year period being just before a century class global weather event.
Poor little harry, he actually believes I agreed with him.
He also believes he actually understands how these numbers are calculated. They aren’t trend lines and never have been.
Perhaps if you tried to actually understand the science instead of just blindly believing what you are told to believe you begin to understand what a total fool you have been.
Has ‘ANY’ selection of data has to have a starting point they there is simple no why to avoid this issue , unless of course you have means to covering all data that has ever existed , know or unknown.
Meanwhile such claims would have a lot more value if they were also made when climate ‘scientists’ indulge in the very same approach, especially when they want to ‘prove’ its warmer than its ever been.
Funny how most of the charts that seek to prove how much the earth has warmed start during the middle of the little ice age.
Either that or they start in the late 70’s, right after the end of the cold phase of the PDO.
MarkW commented
What!!!, Why that would be Cherry Picking!!!!
No one has responded to my points about the article.
Just the usual insults and attempts at distraction. This is pretty normal for this website.
Your points have been refuted. A few insults thrown in along the way. But then, you are worth that extra effort.
harrytwinotter says:
Just the usual insults and attempts at distraction. This is pretty normal for this website.
harry, you’re the one who has nothing but insults. Instead of producing verifiable evidence, you wrote about Mark W:
“You are delusional.”
And:
MarkW.
I didn’t think you had the intelligence to refute me.
This article is about the lack of any global warming for the past 18 years. The insults from harrytwinotter and othewr climate alarmists demonstrate their consternation at the fact that Planet Earth is falsifying everything they have been predicting. As James Carson wrote:
Harrytwinotter: You are mistaken.
The difference between scientific skeptics — the overwhelming majority of readers and commenters here — and climate alarmists, is this: on the rare occasions when skeptics are wrong, we admit it, and we try to find out why. Knowledge is the goal, not insulting others because someone can’t support their own arguments.
dbstealey:
Additional to the scientific skeptics are pseudoscientific skeptics; like the alarmists they fail to admit it when they are wrong. Among the skeptics it seems to me that the pseudoscientific skeptics are in the majority. They are the skeptics who seek to prove that the magnitude of the equilibrium climate sensitivity is overblown by the alarmists.
“Among the skeptics it seems to me that the pseudoscientific skeptics are in the majority. They are the skeptics who seek to prove that the magnitude of the equilibrium climate sensitivity is overblown by the alarmists.”
It’s only pseudo – scientific if it’s not correct.
micro6500
It’s also pseudoscientific if the equilibrium climate sensitivity is a pseudoscientific concept. This is the case.
If that’s your argument, then it’s the alarmists who are chasing unicorns.
micro6500:
The alarmists are chasing unicorns but so are the pseudoscientific skeptics. The public policy should be to replace pseudoscience with science as soon as possible. If and when this has been accomplished perhaps there will be a basis for controlling Earth’s climate. Until then, governments should not try to accomplish the impossible.
As soon as the idjits stop trying to destroy modern society, they can spend all the time (but not my tax dollars) they want chasing unicorns, I’ll go back to other pastimes.
micro6500
I’m with you!
Terry Oldberg says:
They are the skeptics who seek to prove…
Terry,
As I understand it, skeptics have nothing to prove. The onus is on those who say dangerous man-made global warming is taking place.
The job of skeptics is always to tear down a conjecture; to falsify it. What remains is considered to be the current state of scientific knowledge. It may be right, or not. But it’s as close as we can get, and it is thanks to the efforts of scientific skeptics.
dbstealey:
The distinction that you sometimes make between a “scientific skeptic” and a “skeptic” is a good one as the thinking of most skeptics is pseudoscientific.
dbstealey.
Back in your box.
Is the trend line statistically significant? NO, not even over the whole dataset.
I did some back of the envelope calcs a while back which show the UAH temp dataset to become statistically significant after 25 years, at least to 2 standard deviations.
It will be interesting to see how it reacts to the current El Nino event.
Harrytwinotter: You are mistaken. Do your diagnostics.
Start with the D-W statistic. You will very likely find that it is way under 1.0. To pass, it needs to be above 1.65. Then run an autocorrelation and partial autocorrelation on the residuals of your trend model and you will find highly significant positive partials at the first and second lags. Then, run an ARIMA(1,1,0). The constant is the drift and represents global warming in the model. It will show positive at the 0,15-0,25 degrees C per decade, but it will NOT be statistically significant, not even remotely close. I’ve done the analysis already and posted it here.
http://greenheretic.com/has-warming-been-statistically-significant/
You know…. that was the first thing I noticed fifteen years ago, the lack of standard model diagnostic output. As a statistician, I flip to the ANOVA or regression output pretty early on, but found that the ‘literature’ on global warming lacked such material. So, I found the UAH dataset and looked it over. There’s NOTHING there! There’s no ‘trend’ when you look at the data using conventional time series tools (ARIMA).
James,
If you’re interested I’m working with surface data, and could use some assistance with statistical analysis.
If I could ask some questions, it might be useful.
If you want, you should be able to contact me directly through this page
http://www.science20.com/user/3763/contact
Micro6500: I visited your page, but don’t see anything other than a registration link. Interesting site, but I am parsimonious about where I register. I already receive too many emails. I’d be happy to look at whatever you have. If you want to contact me, fine. Phone would be fine, too.
My email is GreenHeretic@Comcast.net
I have the Berkeley dataset. My first whack confirms my findings wrt the UAH data. Specifically, there has been no statistically significant warming over the period. That is to say, the drift term in an ARIMA model is nil.