From the University of New South Wales and ‘models versus reality‘ department comes this claim from alarmist Matthew England, whose “say anything” track record isn’t at all impressive, and looks to be an obsession with “being right” rather than doing careful science, for example:
And so anybody out there lying that the IPCC projections are overstatements or that the observations haven’t kept pace with the projections is completely offline with this. The analysis is very clear that the IPCC projections are coming true.
On the plus side, at least he acknowledges the existence of “the pause” now, but says it’s irrelevant. Whatever.

Or, with the surface temperature record and the satellite record, if you prefer:
![CMIP5-90-models-global-Tsfc-vs-obs[1]](https://wattsupwiththat.files.wordpress.com/2013/10/cmip5-90-models-global-tsfc-vs-obs1.jpg?quality=83) Here is the press release:
Here is the press release:
Heat still on despite warming slowdown
Hiatus in global average temperatures has little effect on projected temperatures in 2100
The recent slowdown in the rise of global average air temperatures will make no difference to how much the planet will warm by 2100, a new study has found.
The peer-reviewed study, published today in Nature Climate Change, compared climate models that capture the current slowdown in warming to those that do not. The study found that long-term warming projections were effectively unchanged across the two groups of models.
“This shows that the slowdown in global warming has no bearing on long-term projections – it is simply due to decadal variability. Greenhouse gases will eventually overwhelm this natural fluctuation,” said lead author and Chief Investigator with the ARC Centre of Excellence for Climate System Science, Prof Matthew England.
To separate the long-term temperature outcomes from short-term variability the researchers took 200 climate simulations and re-evaluated them out to 2100 by comparing those that captured the current slowdown to those that did not.
The models were analyzed using one of two IPCC carbon emission projections.
The first was a scenario where greenhouse gas concentrations continue to rise unabated through the 21st Century. The second assumes emissions are reduced to address global warming, peaking by 2040 before declining sharply.
Under the high emissions scenario, the difference in average projected end-of-century warming between the two groups of models is less than 0.1°C; a tiny fraction of the projected 5°C global warming if emissions are not curbed.
Warming of this magnitude is well beyond the 2°C threshold that is considered a target by the Australian Government and a safe limit by the IPCC.
In the past, certain lobby groups have tried to argue that the recent slowdown in the rise of global average temperatures is a reason to abandon international and national efforts to curb carbon emissions.
This study shows the slowdown merely reflects short-term variability. Long-term global warming is still set to reach dangerous levels unless carbon emissions are reduced dramatically in the coming decades.
“Our research shows that while there may be short-term fluctuations in global average temperatures, long-term warming of the planet is an inevitable consequence of increasing greenhouse gas concentrations,” Prof England said.
“This much hyped global warming slowdown is just a distraction to the task at hand”.
###
Note: as is typical with these jokers, they don’t bother to give the name of the paper in the press release, so I looked it up. The short abstract reads more like an opinion than science, especially since that favorite buzzword “robust” can’t possibly apply to any future prediction, be it climate 85 years from now, tomorrow’s weather forecast, or the stock market.
Robust warming projections despite the recent hiatus
- doi:10.1038/nclimate2575
- Published online23 April 2015
The hiatus in warming has led to questions about the reliability of long-term projections, yet here we show they are statistically unchanged when considering only ensemble members that capture the recent hiatus. This demonstrates the robust nature of twenty-first century warming projections.

“You’ll meet a dark handsome man” , but when you’ve met a blond ugly guy, then the argument will be: “Hey, look, in the dark everybody looks handsome, so my prediction was valid.”
Sounds like pathological science to me.
No, wait, it’s called “post normal science” these days.
lol, … then the
fortune tellerIPCC will say:You just didn’t wait long enough. Wait till you’re about 85.
hey, I will be 85 this century, I can wait 🙂
But, let’s not forget, over 6 billion people will die this century. This is a solid prediction.
It is no accident that the “Climate {Virtual} Reality Project” is in Iowa.
.
Source: http://www.usatoday.com/story/money/business/2013/05/09/wind-energy-investment-iowa/2147657/
Except it doesn’t. They may have an installed capacity of 20% of Iowa’s electricity demand. But if they get 20% of that, they are very lucky. And often, the wind just does not blow at all. Particularly at night, when solar cannot do it’s loser job – haha.
Nameplate capacity vs. observed output. I believe this is a common, convenient tactic of reporting the wonders of solar and wind whereby “minor technical details” are helpfully omitted from press releases and media reports.
According to Mid-American Energy, as of 2013 their generating capacity was 45% Coal; 30% wind; 19% Natural Gas; 6% nuclear, hydro, other. They have expanded wind in several projects since then. So it is very feasible that they are actually producing 20% of kilowatt hours by wind. When power demand is low, it is normal to take out the larger assets: (i.e. coal) for maintenance, so in low demand times wind is an even greater portion of the active generating capacity than 30%. Mid American is not the only player in Iowa, just the largest, others play in the wind as well.
Although articles about technical subjects written by non-engineers or scientists are frustratingly non specific, it is likely that in this case, it is correct that 20% percent of the electricity produced in Iowa is by wind the installed nameplate capacity is even greater.
I saw a report not too long ago that in England the amount of wind power that could be counted on at all times was 2% of nameplate capacity.
“This shows that the slowdown in global warming has no bearing on long-term projections…”
Adjustments and Homogenization will validate the IPCC projections.
Not if Anthony and the rest of the team has anything to say abut it.
“Greenhouse gases will eventually overwhelm this natural fluctuation” There is no way the greenhouse gases (CO2) can cause significant warming. Only the feedbacks can do that and they only exist in the models.
Exactly. As an engineer, I understand what positive feedback does, and if there were a positive warming feedback in the atmosphere, we would have all fried before we even existed.
If we go into a new ice age, it will eventually end. Would that signal the end of the pause?
Rising temps after the PDO flip to positive in ~20 years. Another ~30-year rise. Then another pause.
fact will not overwhelm ideology.
Why is it that the darn graphs never have the “mean line” added to them?
Predictions – the 104 runs – are for about +2.0 C per century. Actual has been chugging near +0.5 C/century. I just don’t think the world’s coming to an end. Of course, perhaps unusually (which we can’t expect politicians, senators or cheerleaders to have accomplished) I learned to count and COMPARE numbers in the 3rd grade. Grammar school.
The models are run from 1983 which means they cover one period of warming and one period of pause. There’s no satisfactory history match so it is folly to think the models are OK. If the model runs are initiated in 1900 and there is a match with the temp rise from 1920 to 1940 and a match for the drop in temps from the mid 40s to 1980 then I might conclude the models have some use. Also, logically, natural variability might be the reason for the temp rise from 1980 to 2000.
Of course the end of warming 2 decades ago doesn’t effect these pseudo-model forecasts. Plug in: delta T = fn [CO2] … and it will show warming as long as {C02} is increasing.
CO2 forcing is constant. It is modified by PDO cycles: 1950-1976, pause. 1977-2007, double-warm. 2007 for ~30 years: pause. 2xwarm. Pause. Etc.
Man oh man, I knew there was a lot of mess that one day has to be cleaned up and a science scrapped and started over again with cleaned data. I knew that new universities, and scientific societies and learned journals had to be created to let the others die because there is no hope of rescuing them and straightening them out, but for Australia, I realize we need a couple of Marshall Plans to save it. The previous thread was on Aussies at the U scrapping democracy to save the planet. Now it’s hide the divergence between the models and reality, or at least hide the reality. They are a hazard to navigation to Antarctica..Please, enough excellence already.
When will they give up?
2 days after the Sun stops, 7 billion years from now.
According to the paper, only the future is certain.
Where has one heard that before?
Someone please ask him, in what decade to the models go from completely wrong to precisely right? They must be able to project that or there would be no way to project they are magically correct in 85 years.
A pseudoscience at work: rewriting reality.
Wow, so according to this GROUPTHINK is advantageous and sufficient grounds for confirming their confirmation bias as correct.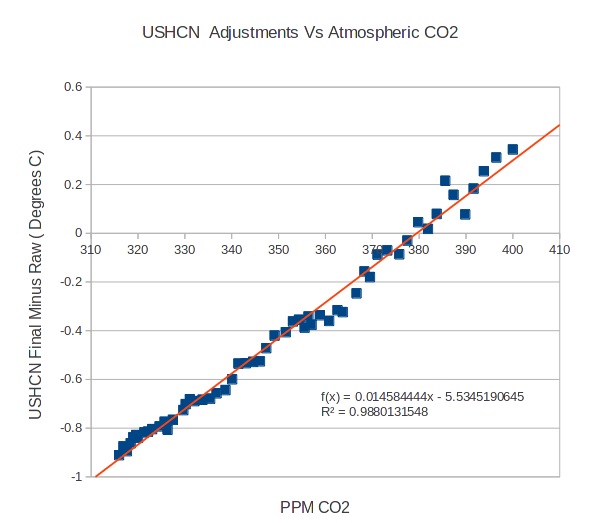
When the strongest correlation anyone has found to CO2 is the magnitude of the post-hoc adjustments being made to the temperature datasets, you know the fix is in.
Tarajunky, I’ll have you know that you are exhibiting a truly cynical attitude!
Gentlemen, get this straight once and for all. The GISS isn’t there to create hysteria, the GISS is there to preserve hysteria.
(In case you’re unfamiliar with the ’68 DNC, I love it.)
Where did you get the data for this graph, and what exactly are the points? Also, the span of the data appears to be over 1 C. There is some structure in it — is this structure associated with known changes in their algorithm? It gets increasingly noisy in the present, which is the exact opposite of what one would expect based on the probable quality and coverage of the data. And why linear in CO_2, when CO_2 itself was nonlinear across the same time in a very particular way (one could present the same graph in terms of date, in other words, but then it would not be linear!) In short, the graph as it stands doesn’t really make sense. But I’m very curious to know how it was built?
rgb
Prof Matthew England is a chief investigator at the centre of excellence at UNSW which is also home to Prof Chris Turney, the famous leader of the ship of fools that got stuck in Antartica due to natural variations. If that’s a centre of excellence, what does a centre of mediocrity or worthlessness look like?
Excellence is not descriptive of what a department does, it is a value judgment. In corporations it often refers to a department that allegedly can tell other departments who actually do stuff how to do it “excellently”.
Any group or department that has “excellence” can be immediately flagged as a gaggle of befuddled self-aggrandizing bureaucrats.
What is amazing and amusing about climate models other than the identity crisis of not knowing whether they are predictions, projections or forecasts, is they never project cooling. Sticking with the term projections, the models suggest the earth is never to cool again. Which brings up the question at what point in the future will the people of Maine have the same climate and ocean temperatures of the lovely Bahamas? Projecting further into the future when do the oceans become hot enough to make for a pleasant hot tub experience?
Any dimwit knows the earth has gone through warming/cooling cycles, and it is reasonable to expect it will continue to do so. So if models cannot project both warming and cooling they cannot claim to predict, project or forecast Global temperature.
Of course Alex, models , the GCMs should show cooling at a given point, but these models donn’t, as far as I can tell………..and that is a big handicap, yes, especially when projections are treated as predictions or forecasts.
Cheers
I have a theory I describe using words.
I build a computer model.
The model produces the same results as the word description of the theory.
I proved nothing except that I could program a computer to do with numbers what I could use my word processor to do with words.
The only problem with what you say is that the model in question is not in principle set or run according to the theory…
Cheesr
“The only problem with what you say is that the model in question is not in principle set or run according to the theory…”
How do you know? He built it, and he said what it is!
And you come along and tell him he is wrong.
Who are you?
Menicholas
April 24, 2015 at 8:42 am
Very clever Men..
but he is trying to compare to models he has no clue about….that is the point. otherwise he be talking to himself…
comprende?
cheers.
“This study shows the slowdown merely reflects short-term variability”
Remember when science predicted? General relativity -predicts- where your space probe is going to end up, despite overwhelming evidence that it will be correct. But apparently climate models 100 years out that havent worked well to date -show- what is and will happen.
Thanks, Anthony.
The paper’s title should have been “Alarmist warming projections despite the recent hiatus”, “Robust” as you point out cannot be said of a forecast.
Since the models were training on a decadal upswing, it is disingenuous to dismiss prediction errors with excuses of the same type parameter effects. They are at least putting NSW on the map as a center of non-science—to avoid as a waste of time.
http://www.sciencemag.org/content/337/6096/809.summary
This is a quote from the article NASA satellite data shows a decline in water vapor.
The quote is radiosonde data shows that upper atmosphere water vapor declines with warming.
Now data from the patriot post article called Evidence That Demands a Verdict shows quite clearly two items of data of importance one being there has been no warming in the tropical atmosphere at the 12km level or 18 km level and that al the deviations in the upper tropical atmosphere temperatures are correlated with the temperature in Nino region 3.4.
Thus far no lower tropospheric hot spot has materialized.
What the data is saying if one tries to incorporate all of this is first of all it appears that the temperature in the tropical troposphere is correlated to ENSO. When ENSO in in an El Nino phase the temperature in the r tropical troposphere increases and vice versa with no long term change in the temperature of the tropical troposphere overall. In addition radiosonde data is indicating that water vapor concentrations are inversely correlated with the temperature of the atmosphere and from the article I posted it said one of the ways in which water vapor may get into the stratosphere outside of the tropics is via convection. Then in addition, with data still showing no lower tropical tropospheric hot spot here are the objective conclusions that I think have to be drawn based upon the data.
The conclusions I take away from all of this is first the temperature of the tropical troposphere is controlled by ENSO not CO2 and that the concentrations of water vapor irrespective of if water vapor is or is not inversely correlated to the temperature of the atmosphere is going to be tied to ENSO, not CO2.
In addition it looks like sea surface temperatures(PDO) /convection may have much to do with the amounts of water vapor which eventually reach the stratosphere all of which destroy AGW theory which said the amounts of water vapor which will reside in the tropical troposphere will be DIRECTLY tied into the strong positive feedback between CO2 and water vapor which would result in two distinct trends developing in the r tropical troposphere which would be a steady increase in water vapor which would be in tandem with a steady increasing temperature trend in the tropical troposphere which would be more pronounced with altitude relative to the lower levels, and that this steady increase in water vapor /temperature trend which would be evolving would cause a lower tropical tropospheric hot spot to evolve, due to an ever increasing negative lapse rate.
Data however shows no such negative lapse rate trend evolving and no correlation between CO2 and the tropical tropospheric temperature profile, nor no correlation with CO2 and tropical troposphere water vapor profile. Instead data shows the temperature and water vapor characteristics of the tropical troposphere seem to be correlated with ENSO ,and indicate in the case of water vapor (according to radiosonde data) an inverse relationship to temperature all things being equal but this could be obscured by convection changes in the tropics due to sea surface temperature changes and atmospheric circulation changes all of which AGW theory does not address to any degree whatsoever when it comes to the temperature profile and water vapor profile of the tropical troposphere.
In conclusion not only does the resultant tropical hot spot as called for by AGW theory not appear but data shows in addition the reason why it does not appear are because it is not CO2 which governs how the tropical tropospheric temperature/water vapor profile may evolve but rather it is ENSO/PDO phases along with convection changes in the tropics due to atmospheric circulation changes and sea surface temperature changes (PDO).
This all showing that the central theme of AGW theory which is a strong positive feedback between CO2 and water vapor resulting in a tropical tropospheric temperature/water vapor profile which would give rise to a hot spot is flawed. Hence the theory is flawed.
Well you gotta admit they’re worse than we thought and they did come up with the idea first.
If the modelling software is so good, why not try to calculate when the ~0.5C credibility gap will close?
http://wattsupwiththat.com/2014/07/28/new-study-claims-to-confirms-water-vapor-as-global-warming-amplifier-but-other-data-says-no/
Here in this article if one scrolls down you will find the latest data on water vapor trends for various levels of the atmosphere. Does not look to be supportive of AGW theory to me.
Citing articles on this site does not constitute a valid scientific argument since this cite is blatantly biased toward an outcome everyone is already set on. it’s like asking Lebron James if he’s a good basketball player.
Two logical fallacies in one. Argumentum ad lapidem and appeal to motive.
The article argues that two papers are contradictory. Is that true or not? If not please contribute with your refutation.
Try playing the ball.
Clovis Marcus,
True of the specific case. In the general case, this forum frequently trades on appeal to motive, thus rendering …
… a priori absurd. Cribbing a line from a quotable film, charging a person with fallacy in this place is like handing out speeding tickets at the Indianapolis 500.
Just so there’s no doubt about my self-awareness, and if it pleases the court, please allow me tally up my own list of violations in this post:
1) Moving the goalposts.
2) Strawman.
3) Hasty generalization.
4) Guilt by association.
5) Unsupported assertion. [1]
Guilty as charged, Your Honour. Whatever my fine, it’s worth its weight in irony.
——————
[1] As self-evidence rarely goes unpunished in this court, should the jury wish to review exhibits prior to sentencing, I’ll be happy to provide some particularly egregious examples of what I see as blatantly fallacious appeal to motive.