Guest Post by John Goetz
Adjustments to temperature data continue to receive attention in the mainstream media and science blogs. Zeke Hausfather wrote an instructive post on the Climate Etc. blog last month explaining the rationale behind the Time of Observation (TOBS) adjustment. Mr. Hausfather pointed to the U.S. Climate Reference Network (CRN) as a source of fairly pristine data that can be used to analyze TOBS. In examining the CRN data, there is no doubt that the time of observation affects the minimum, maximum, and average temperature recorded on a given day. Also, changing the TOBS one or more times during a station’s history can affect the station’s temperature trend.
Temperature adjustments have bothered me not because they are made, but because there is a broad assumption that they skillfully fix a problem. Somehow, climate scientists are capable of adjusting oranges into apples. However, when adjustments are made to temperature data – whether to correct for TOBS, missing data entries, incorrect data logging, etc. – we are no longer left with data. We are left instead with a model of the original data. As with all models, there is a question of how accurately that model reflects reality.
After reading Mr. Hausfather’s post, I wondered how well the TOBS adjustments corrected the presumably flawed raw temperature data. In the process of searching for an answer, I came to the (preliminary) conclusion that TOBS and other adjustments are doing nothing to bring temperature data into clearer focus so that global temperature trends can be calculated with the certainty needed to round the results to the nearest hundredth of a degree C.
The CRN station in Kingston, RI is a good place to examine the efficacy of the TOBS adjustment. This is because it is one of several CRN pairs around the country. Kingston 1 NW and Kingston 1 W are CRN stations located in Rhode Island and separated by just under 1400 meters. Also, a USHCN station that NOAA adjusts for TOBS and later homogenizes is located about 50 meters from Kingston 1 NW. The locations of the stations can be seen on the following Google Earth image. Photos of the two CRN sites follow – Kingston 1 W on top and Kingston 1 NW on the bottom (both courtesy NCDC).


The following images are of the Kingston USHCN site from the Surface Stations Project. The project assigned the station a class 2 rating for the time period in question, 2003 – 2014. Stations with a class 1 or class 2 rating are regarded as producing reliable data (see the Climate Reference Network Rating Guide – adopted from NCDC Climate Reference Network Handbook, 2002, specifications for siting (section 2.2.1) of NOAA’s new Climate Reference Network). Only 11% of the stations surveyed by the project received a class 1 or 2 rating, so the Kingston USHCN site is one of the few regarded as producing reliable data. Ground level images by Gary Boden, aerial images captured by Evan Jones.


CRN data can be downloaded here. Download is cumbersome, because each year of data is stored in a separate directory, and each file represents a different station. Fortunately the file names are descriptive, showing the state and station name, so locating the two stations used in this analysis is straightforward. After downloading each year’s worth of data for a given station, they must be concatenated into a single file for analysis.
USHCN data can be downloaded here. The raw, TOBs, and homogenized (52i) files must be downloaded and unzipped into their directories. All data for a station is found in a single file in the unzipped directories. The Kingston USHCN data has a file name that begins with USH00374266.
Comparison of Kingston 1 NW and Kingston 1 W Temperatures
Both Kingston CRN stations began recording data in December, 2001. However, the records that month were incomplete (more than 20% of possible data missing). In 2002, Kingston 1 NW reported incomplete information for May, October, and November while Kingston 1 W had incomplete information for July. Because of this, CRN data from 2001 and 2002 are not included in the analysis.
The following chart shows the difference in temperature measurements between Kingston 1 NW and Kingston 1 W. The temperatures were determined by taking the average of the prior 24-hour minimum and maximum temperatures recorded at midnight. The y-axis is shown in degrees C times 100. The gray range shown centered at 0 degrees C is 1 degree F tall (+/- 0.5 degrees F). I put this range in all of the charts because it is a familiar measure to US readers and helps put the magnitude of differences in perspective.

Given the tight proximity of the two stations, I expected their records to track closely. I found it somewhat surprising that 22 of the months – or 15% – differed by the equivalent of half a degree F or more. This makes me wonder how meaningful (not to say accurate) homogenization algorithms are, particularly ones that make adjustments using stations up to 1200 Km. With this kind of variability occurring less than a mile apart, does it make sense to homogenize a station 50 or 100 miles away?
Comparison of Kingston 1 NW and Kingston 1 W Data Logging
A partial cause of the difference is interruption in data collection. Despite the high-tech equipment deployed at the two sites, interruptions occurred. Referring to the previous figure, the red dots indicate months when 24 or more data hours were not collected. The interruptions were not continuous, representing a few hours here and a few there of missing data. The two temperature outliers appear to be largely due to data missing from 79 and 68 hours, respectively. However, not all differences can be attributed to missing data.
In the period from 2003 through 2014, the two stations recorded temperatures during a minimum 89% of the monthly hours, and most months had more than 95% of the hours logged. The chart above shows that calculating a monthly average when missing 10-11% of the data can produce a result with questionable accuracy. However, NOAA will calculate a monthly average for GHCN stations missing up to nine days worth of data (see the DMFLAG description in ftp://ftp.ncdc.noaa.gov/pub/data/ushcn/v2.5/readme.txt). Depending on the month’s length, GHCN averages will be calculated despite missing up to a third of the data.
Comparison of Kingston USHCN and CRN Data
To test the skill of the TOBS adjustment NOAA applied to the Kingston USHCN site, a synthetic TOBS adjustment for the CRN site was calculated. The B91 forms for Kingston USHCN during 2003-2014 show a 4:30 PM observation time. Therefore, a synthetic CRN 4:30 PM observation was created by averaging the 4:00 PM and 5:00 PM observation data. The difference between the USHCN raw data and the synthetic CRN 4:30 observation is shown in the following figure. Despite a separation of approximately 50 meters, the two stations are producing very different results. Note that 2014 data is not included. This is because the 2014 USHCN data was incomplete at the time it was downloaded.

Although the data at the time of observation is very different, perhaps the adjustment from midnight (TOBS) is similar. The following figure represents the TOBS adjustment amount for the Kingston USHCN station minus the TOBS adjustment for the synthetic CRN 4:30 PM data. The USHCN TOBS adjustment amount was calculated by subtracting the USHCN raw data from the USHCN TOBS data. The CRN TOBS adjustment amount was calculated by subtracting the synthetic CRN 4:30 PM data from the CRN midnight observations. As can be seen in the following figure, TOBS adjustments to the USHCN data are very different than what would be warranted by the CRN data.

Adjustment Skill
The best test of adjustment skill is to take the homogenized data for the Kingston USHCN station and compare it to the midnight minimum / maximum temperature data collected from the Kingston CRN 1 NW station located approximately 50 meters away. This is shown in the following figure. Given the differences between the homogenized data from the USHCN station and the measured data from the nearby CRN station, it does not appear that the combined TOBS and homogenization adjustments produced a result that reflected real temperature data at this location.

Accuracy of Midnight TOBS
Whether the minimum and maximum temperatures are read at midnight or some other time, they represent just two samples used to calculate a daily average. The most accurate method of calculating the daily average temperature would be to sample continuously, and calculate an average over all samples collected during the day. The CRN stations sample temperature once every hour, so 24 samples are collected each day. Averaging the 24 samples collected during the day will give a more accurate measure of the day’s average temperature than simply looking at the minimum and maximum for the past 24 hours. This topic was covered in great detail by Lance Wallace in a guest post two and a half years ago. It is well worth another read.
The following chart shows the difference between using the CRN hourly temperatures to calculate the daily average, and the midnight minimum / maximum temperature. The chart tends to show that the hourly temperatures would produce a higher daily average at this station.

Discussion
Automated methods to adjust raw temperature data collected from USHCN stations (and by extension, GHCN stations) are intended to improve the accuracy of regional and global temperature calculations to, in part, better monitor trends in temperature change. However, such adjustments show questionable skill in correcting the presumed flaws in the raw data. When comparing the raw data and adjustments from a USHCN station to a nearby CRN station, no improvement is apparent. It could be argued that the adjustments degraded the results. Furthermore, additional uncertainty is introduced when monthly averages are computed from incomplete data. This uncertainty is propagated when adjustments are later made to the data.
A Note on Cherry-Picking
Some will undoubtedly claim that I cherry-picked the data to make a point, and they will be correct. I specifically looked for the closest-possible CRN and USHCN station pairs, with the USHCN station having a class 1 or 2 rating. My assumption was that their differences would be minimized. The fact that a second CRN station was located less than a mile away cemented the decision to analyze this location. If anyone is able to locate a CRN and USHCN pair closer than 50 meters, I will gladly analyze their differences.
================================
Edited to add clarification on y-axis units and meaning of the gray band to the description of each figure.
Edited to add links to the CRN and USHCN source data on the NCDC FTP site.
Discover more from Watts Up With That?
Subscribe to get the latest posts sent to your email.
I’m rather [confused] by [what] what you are trying to do here. The TOBs adjustment corrects for a change in time of observation. There was no change in time of observation at the Kingston USHCN station during the time which the nearby USCRN station has been operating. In fact, there are effectively no adjustments at all done to the raw Kingston station during the years which the USCRN station is active, either for TOBs or homogenization steps. You can see the raw and adjusted anomalies for Kinston USHCN here:
http://i81.photobucket.com/albums/j237/hausfath/Kingston%20Raw%20Adj_zpszpr23ty9.png
Given that there are literally zero adjustments during the time you are examining, all you are really doing is looking at absolute offsets between the stations. These are not of interest, as the stations are set to aligned baseline periods when converted into anomalies, which removes the impact of elevation differences and other factors that result in a (in this case slight) offset. Here are USHCN raw and adjusted data compared to the USCRN data:
http://i81.photobucket.com/albums/j237/hausfath/Kingston%20Raw%20Adj%20CRN_zpsnw6vyq3j.png
Mistype on my part; should have written “I’m rather confused by what you are trying to do here.”
I don’t know why you are saying there are effectively no adjustments to the Kingston USHCN raw data for TOBS. USH00374266.raw.tavg and USH00374266.tob.tavg clearly differ during the time period in question, and in a cyclical manner. The tob file cools the raw data during the period in question, which makes sense given the 4:30 PM observation time.

I meant that there are no adjustments to the anomalies, which are what are used in calculating regional and global temperatures. Constant monthly offsets are aliased out when calculating anomalies.
Regarding TOBs, here is what I get when I adjust CRN data from an 8 AM TOBs to a 4 PM TOBs; its not a perfect fit, though 4:30 would have a noticeable difference and I’m guessing that 8 AM was the original TOBs of the USHCN station as I don’t have that data offhand.
http://i81.photobucket.com/albums/j237/hausfath/Kingston%20TOBS%20adj_zps6veb8r7w.png
John,
Haven’t seen you for a while! Hope you keep commenting here, it’s always worthwhile reading.
Actually, it looks like 7 AM to 5 PM gives a better fit:
http://i81.photobucket.com/albums/j237/hausfath/Kingston%20TOBS%20adj_zpsjxsrttyq.png
TOBs is a model, and obviously won’t capture all the actual noise in day-to-day variations of real hourly data. However, the mean effects are remarkably similar:
USHCN mean TOBs adjustment = -0.744 C
USCRN synthetic mean TOBs adjustment (from 7 AM to 5 PM) = -0.753 C
In this case the mean TOBs adjustment is actually (very slightly) too small, but its pretty darn close.
The numbers and figures in the prior comment are incorrect. See the corrected numbers below. I was assuming a transition from 7 AM to 4:30 PM when in fact what occurred was a transition from 9 PM to 4:30 PM. The conclusions are largely the same, however, and the fit is improved by using the correct times.
How did TOBS adjust this station? ?w=700
Sample observation times from Kingston:
1990 – 4:30 PM
1970 – 5:00 PM
1947 – 5:00 PM
1918 – 9 PM
You are correct, Kingston is one of the weird stations that switches from evening to afternoon TOBs. Here is the same analysis run for a 9 PM to 4 PM. Produces a pretty good fit.
Mean USHCN Kingston TOBs adjustment: -0.74
Correct USCRN Kingston TOBs adjustment: -0.70
http://i81.photobucket.com/albums/j237/hausfath/Kingston%20TOBS%20adj_zpssjxgyact.png
Sigh, this is what I get for doing things too quickly. The above numbers and figure are correct, but what is shown is the CRN station data adjusted from midnight to 4 PM, as all the USHCN data is TOBs-adjusted relative to a standard midnight observation time.
Here is the same figure with corrected labels.
http://i81.photobucket.com/albums/j237/hausfath/Kingston%20TOBS%20adj_zpszxqf6otf.png
What I do not understand about Zeke’s data is that the CRN data shows a lot more variation than the USHCN Station, when John’s data suggests that the CRN data is much more tightly controlled, ie comparing the 2 CRN stations shows less variability than the CRN v USHCN station comparison.
So John can you supply the actual temperatures or anomalies of the CRN and USHCN stations?
I have been unable to completely replicate your second graph. This is the closest I could get. Using anomalies I still see clear differences between USHCN raw, USHCN adjusted, and CRN (synthetic TOBS of 12 AM). Differences were even larger using a 5PM synthetic CRN TOBS and just taking the hourly averages.
Hi John,
Here is what I’m comparing:
ushcn_tobs_diff = kingston_ushcn_tobs – kingston_ushcn_raw
uscrn_syn_tobs_diff = kingston_nw_midnight – kingston_nw_4_pm
I can attach the kingston_nw_4_pm series if you’d like, but its just generated by assuming that the first hour of the day is 4 PM.
Ignore my request as I see you have already done it.
I think comparing the effects of TOBs adjustments in both (e.g. the difference between TOBs adjusted and non-adjusted) is more meaningful than simply comparing absolute measurements. The CRN station uses a different instrument (platinum resistance thermometers to measure air temperature within fan aspirated shields that keep out the sun and draw in the air) vs. the USHCN station (a standard MMTS), and I wouldn’t be surprised if there was some constant min and max offsets between the two.
Specifically, http://journals.ametsoc.org/doi/abs/10.1175/JTECH-D-14-00172.1 suggests that COOP MMTS instruments read about 0.1 C higher mean temperatures than CRN instruments.
Sorry Zeke, I meant I cannot replicate this one:
http://i81.photobucket.com/albums/j237/hausfath/Kingston%20Raw%20Adj%20CRN_zpsnw6vyq3j.png
Note that the units are degrees C anomaly relative to 2004-2013. Subtract the mean value over that period for each month from each series. Not sure if it will be useful, but here is my STATA code for it:
sort month
save data.dta, replace
local anom_start = 2004 //1961
local anom_end = 2013 //1990
drop if year = `anom_end’
collapse (mean) baseline_raw=kingston_raw baseline_adj=kingston_adj baseline_crn=crn_avg, by(month)
sort month
merge 1:m month using data.dta, keep(match)
drop _merge
gen anomaly_raw = kingston_raw – baseline_raw
gen anomaly_adj = kingston_adj – baseline_adj
gen anomaly_crn = crn_avg – baseline_crn
Ignore the stuff after the // ; they are old values from a past analysis. The relevant part is:
local anom_start = 2004
local anom_end = 2013
Also, for some reason the “drop if” line didn’t paste correctly. It should be:
drop if year = ‘anom_end’
Huh, wordpress seems not to like that line for some reason. Its:
drop if year (less than or equal to) ‘anom_start’ (or) year (greater than or equal to) ‘anom_end’
Thanks Zeke, I see what I did wrong. The three time series were all calculating anomalies by subtracting the USHCN monthly averages. I corrected that and was able to replicate your graph. Here is a graph I then plotted subtracting the USHCN anomaly from the CRN anomaly. I’ve left out the adjusted data to keep the plot simple.
When it is being announced all over the media that 2014 was the “warmest year ever” by 0.01 C, then these adjustments are not trivial. And to get a true reading on the temperature, is an average of the high and low the best way to do it, however practical it might be? I have always surmised that hourly readings have to be integrated by time to give a true picture, since highs and lows are not necessarily 12 hours apart.
Or do you just say “aw screw it, pick one near the airport, https://chiefio.wordpress.com/2009/12/08/ncdc-ghcn-airports-by-year-by-latitude/ throw away 90 percent of the stations, apply your computer algorithm, and call it science.
Here is a good post on many ways the scientist involved in this demonstrate confirmation bias at the least, fraud at the worst.
https://chiefio.wordpress.com/2010/12/13/the-rewritten-past/
Think of temperature adjustments as data massage … with a happy ending.
Can Adjustments Right a Wrong?
Not if you do not know what these adjusting or how it needs adjusting .
In the good old days we accepted that by its nature our knowledge about weather , and what affects it and how well can predict it was a bit hit and miss, therefore although we may have moaned about weather forecast being poor it was mostly no big deal .
With creation of ‘settled science’ and we it the demands for massive changes to society and the spending of vast amounts of money . We sent people rightly asked , what has actually changed form the ‘good old days ‘ In reality not a lot , the failure of the climate ‘models ‘ is just one indication there is still much we do not know .and therefore we cannot allow for in building into these models .
The same is true for ‘adjustments ‘ for the most part we can take a guess what adjustments may be needed , but that is it.
On micro scale we can ask how we could know , therefore adjust for , the environmental effects on a single weather station from 30 years ago . On a large scale we see that problem across thousands of weather stations over hundreds of years.
The idea that you can throw maths at it and fix it is rubbish , for the maths you use to ‘correct’ are based on guesses themselves, its models on models again and like these models the guesses can be highly subjective and subject to a degree of ‘personalization’.
Oddly it is hear that computing power ,rather becoming useful has become an hindrance, when you can change a few numbers and get the results in minutes the temptation is to keep changing numbers until you get the ‘right results ‘ has it cost little effort and time .
And even better has your speculating about the future, and that in reality is mostly is what is being done , you always get the fall back of claiming that although it may not have happened as you claimed but it would it will ‘in the future ‘, meanwhile you get the rewards in the hear and now .
In the good old days we accepted that there was things we didn’t know but that was necessarily a ‘bad thing’ with the advent of AGW and ‘settled science with its highly politicized nature , we seen a rush to claim that only do we now know the unknown, but we should also reject the notion of their being the possibility of there being ‘unknowns’ in the first place . An approach which although common enough in religion has no place at all within science.
One of many things that climate ‘science’ has issues with , is that often the data is in reality ‘better then nothing ‘ in quality , such has tree rings . Oddly despite the vast amount of money being thrown at the area little has gone to change that situation. Spending 100 million on a new computer does not in any way ,improve the quality of the the data you feed that computer in the first place. GIGO remains not matter how many teraflops you have.
Just highlights how miserable a job humanity is doing of providing reliable and accurate readings of global temperature
Data adjustement after the fact is FRAUD. More so if your justification is not clearly defined, measureable and proveable.
You’re right about needing a clearly defined, measure-able and prove-able method, but weather stations, no matter how carefully maintained, will have gaps in data. If my station was offline for 12 hours and the data needed to be infilled nobody was trying to be fraudulent on purpose, especially if there is a clearly defined method for infilling. And infilling the data is better than reporting 57 degrees for 23 hours during a heatwave…
This reminds me of the guy with his head in an oven and his feet in a bucket of ice: on average, he felt quite comfortable
Regarding the first plot, I’d have to disagree a bit. If you can get two temperature sensors to agree within .5°F, you’re doing pretty well. Even the fancy USCRN sensors are only good to about .3 F at the average temperature around Kingston, RI. I will say that the .25°F step increase starting at 2013 is a little fishy, though. I wouldn’t be surprised if that much could be caused by bad bearings in the aspirator fan.
We have the technology to create an international space station, send probes to Mars and Jupiter, send up satellites for tv, radio, weather, and defense, build super computers to scan the phone calls and email of everyone around the globe, and this is the best we have to measure temperatures on land? I don’t get it.
Maybe the billions spent on climate research should instead be spent on better technology in this area?
@NancyG22 — My thought exactly!!! All you are looking for in a 24-hour period is Tmax and Tmin. It should be easy easy easy to have a continuous temperature recording and at 2400 hours, only those two data points and times be written to a hard drive for record keeping. I find the methodology employed here to be ridiculously convoluted and unnecessarily complicated for what essentially are just two data points.
We have spent millions on a new state-of-the art climate monitoring network: http://www.ncdc.noaa.gov/crn/
Unfortunately, the millions we’ve spent on time travel research have yet to pay off by allowing us to travel back in time and install this sort of equipment back in 1900.
“Unfortunately, the millions we’ve spent on time travel research have yet to pay off by allowing us to travel back in time and install this sort of equipment back in 1900.”
And so we will just make up whatever “data” we want to make up to support the mindless scare of cAGW.
Exactly Mark, and our new super duper computer will give us wrong answers far quicker. ?w=700
Zeke or Mosher never try to explain exactly how the algorithm made the adjustments for ONE station, and that station happens to match the exact pattern of the adjustments of the US data set, and others as well. If Zeke cannot explain ONE station, why would anyone trust the entire super duper expensive network?
David A,
Why would you ask Zeke or Mosh about GISS adjustments? And why not first go see for yourself what BEST does with Reykjavik?
http://berkeleyearth.lbl.gov/stations/155459
Why are you asking about Reykjavik at all when the topic of this post is Kingston?
Because it’s a good question. That’s why, Gates.
Brandon Gates, you have proved David A’s point exactly as BEST show that station should not be adjusted.
The reason that he asks the question of Zeke or Mosh about GISS adjustments is because on at least 2 forums they have been defending those very adjustments using BEST techniques.
A C Osborn,
Oh dear me, no I have not proved any such thing. And I’m not sure you want to go there, because if you’re going to stump for BEST’s methodology … well here, I’ll show you the can of worms you might not wish to open:
http://climexp.knmi.nl/data/it2m_land_best.png
http://climexp.knmi.nl/data/igiss_land.png
Mmmmok … I don’t suppose you could spam a few links so I can read along for myself first hand?
mpainter,
Let’s hope his answer contains a slightly better-developed argument than that.
As I’ve mentioned elsewhere:
“Iceland is an interesting case. NCDC adjusts the mid-century warming down significantly, while Berkeley does not. As Kevin Cowtan has discussed, homogenization may make mistakes when there are geographically isolated areas with sharp localized climate changes (e.g. parts of the Arctic in recent years, and perhaps in Iceland back in the mid-century). For more see his discussion here: http://www-users.york.ac.uk/~kdc3/papers/coverage2013/update.140404.pdf “
Gates:
You could learn here, if you have any desire to learn.
But perhaps you don’t realize how much you lack in understanding.
mpainter,
Any time you wish to demonstrate your own understanding — with specifics — would be a good one. Right now, all you’re showing is blah blah blah blah.
Brandon, it was you that brought up BEST, I have already destroyed it’s credibility to my own satisfaction.
Especially the data that they provide to the public about countries and Continents.
There treatment of individual stations would have some merit if it did not smear the comparison over such large distances.
For instance the Irish Valentia station is compared to London & Paris, which is absurd.
Mosher’s description of BEST says it all, “if you want to know what the actual temperature was use the Raw data, if you want to know what the models think it should be use BEST “Final”.
The 2 forum posts are
http://judithcurry.com/2015/02/09/berkeley-earth-raw-versus-adjusted-temperature-data/
http://judithcurry.com/2015/02/22/understanding-time-of-observation-bias/
And to one on SKS, which I do not have a link to.
Brandon Gates says…
David A,
Why would you ask Zeke or Mosh about GISS adjustments? And why not first go see for yourself what BEST does with Reykjavik?
http://berkeleyearth.lbl.gov/stations/155459
Why are you asking about Reykjavik at all when the topic of this post is Kingston?
==================================================================
Let us start at the bottom Brandon. (BTW Hope you are feeling better) Brandon, I am giving you a real answer. but not certain if you are prepared to take an honest look at it.
1. The title of the post is, :Can Temperature adjustments right a wrong?”
2. The cogent corollary is, “Can T adjustments create a wrong.” Making my comment relevant and pertinent.
(I recall a recent post where an WUWT author showed how a media outlet which formerly had only talked about all the projected harms of CO2, had posted an article about the NOWN benefits of CO2, And you Brandon decided to insult the man because the IPCC refers to some of the benefits of CO2, completely missing the point of the story, and in addition you were shown that the IPCC still ignores a large body of scientific work demonstrating the benefits to the bio-sphere.)
3. There are many temperature adjustments that greatly exceed the tiny TOBS adjustments, and therefore these questionable adjustments are of greater importance. That is why Brandon, now please try to follow my answers.
Brandon as to; ” And why not first go see for yourself what BEST does with Reykjavik?”
1. Assumptions are not often productive. I have.
2. The Best analysis is deeply flawed. They apparently did not know the Iceland folk at the Met Office had already adjusted for station moves, missing data, and any TOBS problems. (Personally I think those adjustments were overboard, but that is not the aim of this post)
3 and 4. Best always has this “Difference from Regional Expectation” in their “best” objective. Beyond the fact that local changes can be as high as ten degrees, ( http://wattsupwiththat.com/2015/03/06/can-adjustments-right-a-wrong/#comment-1876716 ) 4. let us take a look at the other Iceland stations and we find the “Difference from Regional Expectation” was not at one time true. They changed ALL of Iceland, to make this true!
https://notalotofpeopleknowthat.wordpress.com/2015/02/20/the-official-iceland-temperature-series
5. and 6 They had to make the late 1930s-1940 warmth disappear…
https://stevengoddard.wordpress.com/2014/02/18/making-the-1940s-warming-spike-disappear-in-iceland/
Phil Jones talks about removing the decline to the late 1970s…
“No satisfactory explanation for this cooling exists, and the cooling itself is perplexing because it is contrary to the trend expected from increasing atmospheric CO2 concentration. Changing Solar Activity and/or changes in explosive volcanic activity has been suggested as causes… but we suspect it may be an internal fluctuation possibly resulting from a change in North Atlantic deep water production rate.”
So, Jones said in 1985 that: “the cooling itself is perplexing” – but why not say so today? And why don’t we see a “perplexing” cooling after 1940 in the IPCC graphic today? And furthermore, back in the early 1980´ies Jones appears to accept data as is, at least to such an extent that here he is considering how nature has produced these “perplexing” cooling data – like a real scientist should.
I’m especially fond of that “internal fluctuations”…”from a change in North Atlantic deep water”. Gee, maybe the planet has cycles all on it’s own. Guess he’d not been “in church” long enough at that time and was still wondering about the status of the Apocrypha… (Of course now the ENSO cycles can explain the pause, but still they cannot explain the warming!)
6. The GISS homogeneity adj, which is supposed to remove the UHI effect (and nothing else), only allows 0.2C for the change in UHI since 1940 in Reykjavik. Surely this is not enough?
Another common GISS explanation is “Moving stations out of town to avoid UHI explains warming corrections”
Again, this is really Nonsense. Despite relocation of some temperature stations, UHI still induces far too much warming in temperature data in general world wide:
http://hidethedecline.eu/pages/posts/urban-heat-island—uhi—a-world-tour-159.php
Thus: Any correction in connection with UHI should overall be towards colder temperature trends. If you make a warm correction due to stations moved out of town, you should make a much larger cold correction for the much larger UHI effect. The UHI is generally very much larger than the effect of relocating globally.
So it looks like Jones and friends DID believe in UHI back when they needed to do a “wrong way correction” to explain some cooling of the past, but now find it an inconvenient thing about the present…
7. What they cannot erase are the recorded statements of scientist at the time. https://stevengoddard.wordpress.com/2013/08/12/latest-giss-data-tampering-in-iceland/
8. They have completely turned the entire GLOBAL data set into FUBAR. They became so lost in their computer algorithms, and anomalies, the did not know they had actually made their “Hottest year evar 2014” more then four degrees cooler then what they themselves said it was a couple of decades earlier. https://stevengoddard.wordpress.com/2015/02/23/noaa-caught-cooling-the-past/
Brandon, I answered your questions. Please answer this one. Explain these adjustments.
http://wattsupwiththat.com/2015/03/06/can-adjustments-right-a-wrong/#comment-1877173
http://s2.postimg.org/eclux0yl5/GISS_Global_Adjustments_Feb_14_2015.png
David A,
I get this part of it …
[snip comments relating to previous discussion which are not relevant here]
… its that kind of thing I’m talking about. There’s no need to go to Reykjavic OR to CO2 as plant food (which I don’t dispute, if you read me properly) to discuss the topic of this post.
Ah. Well, adjustments on balance is something I think is interesting and appropriate to discuss. That can be illuminated by looking at specific cases, but eventually what matters to me is the net — which is typically where’d I’d start. Then I’d ask, “how is this net change happening” and drill into some examples.
The rest of your comments are basically you asking questions and answering them for yourself by inferring motive (“They had to make the late 1930s-1940 warmth disappear…”) or arguing by fiat (“They have completely turned the entire GLOBAL data set into FUBAR.”) and a few other things that, honestly, are not honest. Which makes your statement …
I am giving you a real answer. but not certain if you are prepared to take an honest look at it.
… ring rather hollow in my ears. My read is you’ve offered little or nothing in terms of how to make the process better, and your critiques are too laden with opinion and speculation to be useful, so I’m quits for this round.
Oh, just saw this:
http://s2.postimg.org/eclux0yl5/GISS_Global_Adjustments_Feb_14_2015.png
I have no clue whether those are “valid” or not, certainly not just from looking at an image from the data. I don’t run around making silly claims of omniscience when I’m anything but.
Brandon, as my post was full of historical accounts, data and graphs, and links to information, and statements from the proponents of CAGW as well, all logically leading to the analysis, your rebuttal is meaningless.
As an example you refused to comment on the graphic I copied, but you failed to follow the link to the Bill Ilis comment. A sincere person interested inwhat was being presented would have clicked the link to verify these continues changes to the past, all still happening with ZERO explanation, see here…
http://wattsupwiththat.com/2015/03/06/can-adjustments-right-a-wrong/#comment-1877500
(All of which you could have done with a simple click, and an honest look at what was being shown to you. Your actions appear to consistently demonstrate a lack of real interest in understanding)
David A,
… along with editorializing appeals to motive, such as: So it looks like Jones and friends DID believe in UHI back when they needed to do a “wrong way correction” to explain some cooling of the past, but now find it an inconvenient thing about the present…
We’re discussing an evidence-based science. Stick to arguments about theory and observations and you’ll have my rapt attention. Put me on the hook to read Jones’ mind like you purport to be able to and my answer will often be: ______________________________
I can’t “prove” that your personal opinion is wrong, and I’m disinclined to try.
Well yes, that line full of weasel-wording is the desired payoff behind the Gish Gallop, isn’t it. Ok. Prove it. Reach into my mind and demonstrate beyond a shadow of any doubt that I lack any real interest in understanding. You can’t do it, any more than I can “prove” you’re Gish Galloping or weasel-wording.
Stick to the evidence itself, not the motives of the people behind it. I find that the science is far more interesting to talk about.
Poor Gates, quotes my commentary about a climate scientist, without including, my included quote from the climate scientist.
Phil Jones talks about removing the decline to the late 1970s…
“No satisfactory explanation for this cooling exists, and the cooling itself is perplexing because it is contrary to the trend expected from increasing atmospheric CO2 concentration. Changing Solar Activity and/or changes in explosive volcanic activity has been suggested as causes… but we suspect it may be an internal fluctuation possibly resulting from a change in North Atlantic deep water production rate.”
So, Jones said in 1985 that: “the cooling itself is perplexing” – but why not say so today? And why don’t we see a “perplexing” cooling after 1940 in the IPCC graphic today? And furthermore, back in the early 1980´ies Jones appears to accept data as is, at least to such an extent that here he is considering how nature has produced these “perplexing” cooling data – like a real scientist should.
I’m especially fond of that “internal fluctuations”…”from a change in North Atlantic deep water”. Gee, maybe the planet has cycles all on it’s own. Guess he’d not been “in church” long enough at that time and was still wondering about the status of the Apocrypha… (Of course now the ENSO cycles can explain the pause, but still they cannot explain the warming!)
——————————————————————
Brandon did you forget…
In 2009, the world’s top climate scientists were looking for ways to make the 1940’s warming spike disappear.
From: Tom Wigley
To: Phil Jones
Subject: 1940s
Date: Sun, 27 Sep 2009 23:25:38 -0600
Cc: Ben Santer
It would be good to remove at least part of the 1940s blip, but we are still left with “why the blip”?================
At one point in the 1980s the 1940s showed a .6 degree rise above the 1970s.
I know you are closed minded because of your biases. You skip facts, graphics and data points regularly. You ignore the clear intent of the author and ignore inconvenient facts, thus you quote the criticism, without the historical basis of it as shown above, and as demonstrated in your refusal to respond to many other facts relayed to you like this…
http://wattsupwiththat.com/2015/03/06/can-adjustments-right-a-wrong/#comment-1877500
You are an excellent example of your own criticisms. There are reasons folk call you a troll.
A C Osborn,
Thanks for the linky links. I can’t find that actual quote in the two links you provided. I’ve seen him write things like that before as part of a larger point. Context is important.
http://judithcurry.com/2015/02/09/berkeley-earth-raw-versus-adjusted-temperature-data/#comment-673083
You blew it there, because it is worse than a rookie mistake to persist in thinking that this …
http://rankexploits.com/musings/wp-content/uploads/2014/06/Averaged-Absolutes.png
… is the way to figure out global temperature trends. Even after Zeke told you it wasn’t a viable way to do it, you still wrote in the followup: Those upward Steps were produced by something, it was not the change of a few stations, it could not possibly have that much effect. So your work has lost that valuable data.
Yes, “something” DID cause those upward spikes. Here’s a clue:
Before you can say things like “it could not possibly have that much effect” you might actually wish to consider the well known fact that absolute temps are hotter toward the equator than at higher latitudes. Then further consider that taking a simple arithmetic mean of absolute temperatures from the raw data will more than probably generate spurious results since the distribution of participating stations over the entire course of the history isn’t uniform from one year to the next.
http://cdiac.ornl.gov/epubs/ndp/ndp041/graphics/ndp041.temp.gif
First year stats class suggests that at the very least you need to take a weighted average of some sort to get a meaningful result, otherwise the results are going to be biased toward the regions where the sampling density is highest. That’s a basic, extremely basic, no-no.
David A,
You’re asking me, a non-expert, to comment on a working scientist’s field of expertise. You may as well ask me about the finer points of neurosurgery. Best I can do here is note that the first quote is from 1970, you’re again quoting him 16 years later, and asking me to comment on why he’s not saying something different 21 years on from that.
Shucks. I mean, have you considered the possibility that the man has learned a few new things about how the planet works over the course of 45 years? The point of science is the progression of knowledge, is it not? If Jones knew everything there was to know about climate in 1970, he could have retired then and written his memoirs, could he not?
I’ve noticed that people who dispatch crap arguments with alacrity around here earn that label with despairing frequency.
The comparison of CRN NW to W is quite revealing. 1.4 km apart; one might expect some slight mocroclimate offset as there appears to be. But the random discordance within that offset look to be about 0.3-0.4 F on average. That implies the uncertainty even CRN is of that order. It would have to be worse given lesspritine station siting. Strong evidence that the NASA GISS assertion of 0.1C uncertainty is understated by a factor of two. That is important,
Note the following moving goalposts concerning ‘pause’model falsification. NOAA 2009: 15 years. Santer 2011: 17 years. Newly, Roberts: 20 years. McKittrick’s 2014 paper found no statistically significant warming in RSS for 26 years, and in UAH for 19 years. But for HadCru it was only 16. (He did not analyze GISS or NCDC). So now RSS chief scientist Mears is arguing the land data sets are better then his own RSS series (to avoid the falsification bind. But if one more than doubles intrinsic Measurement uncertainty in the land series, then the period of no statistically significant warming increases notably ( I have not redone McKittrick’s calculation.) and once again, the pause falsification exceeds the most recent goal post move even by Mear’s revised criterion.
The results are counter-intuitive. “Intuitive” is what I think the supporters of homogenization and adjustments think is going on. Someone important (?) claimed that the adjustments would be net-zero based on this thinking, a quick test showed him to be wrong.
Judith Curry supported the Zeke conclusion that the TOBS adjustments were reasonable. But I think she did the intuitive thing also. If this work is consistent for other similarly close sites – there has to be more than one left AND/OR previously considered but not used anymore, the value of the adjustments has to be questioned.
Looking at some of the graphs, I got the feeling that the net effect was to warm the records. Is that so?
Mean USHCN Kingston TOBs adjustment: -0.74
Correct USCRN Kingston TOBs adjustment: -0.70
Looks like a nice independent validation of TOBs adjustments at this location to me…
I get slightly different averages:
USHCN Kingston TOBs adjustment (TOBS – RAW): -0.74
USCRN Kingston TOBs adjustment (CRN Midnight – 4 PM): -0.64
However, the month-to-month variation is quite dramatic, so I don’t know that I would ultimately say the adjustment is validated. Here is the difference:
John,
We’d expect month-to-month variations, as the factor driving bias (double counting highs and lows) is highly stochastic and weather-dependent and won’t be captured perfectly by prescriptive models. As I’ve mentioned elsewhere in these comments, I see the fact that the mean and stdev of the adjustments to the USHCN station as quite similar to the mean and stdev of the “ground truth” adjustments based on the USCRN station as evidence that they are doing a reasonable job of correcting for tobs-associated biases in the mean (I haven’t looked at min/max separately yet).
On Zeke’s TOBS thread I proposed a sanity test to try to see if TOBS was worth applying.
As it is now they take the minimum temperature series and the maximum temperature series, apply TOBS to each, then average the adjusted daily values to come up with an average temperature, from which they report an anomaly.
Assuming that “global warming” would impact both the min and max temps in a similar way (unlike UHI which would have a strong bias in the minimum temps), why not go back to the historical temperature readings taken in the afternoon and use only the unpolluted minimum temperatures to calculate the anomaly? And then after the station switches to a morning reading time, use the unpolluted maximum temps to calculate the temperature anomaly? The two anomalies could be spliced together one time when the reading time was changed for that station to produce a full anomaly record without needing any TOBS adjustment.
I think this is another alternative approach to try to get at this question of whether these TOBS adjusted data are actually reflecting anything realistic, or are just being thrown around haphazardly without taking efforts to scrutinize them.
IMHO:
– Surface temperature readings should be used for the nightly news weather reports, and deciding whether to wear a coat, or a jacket, or none at all.
– Calibrated MW satellite soundings of lower troposphere temperatures should be the only source of data used to determine climate shifts, changes, baselines.
Too bad we didn’t have those birds in the 19th century, eh.
“Calibrated”
Killing me. Ever hear of instrument drift? Oy vey …
See Gates at his best.
John Goetz says: “In examining the CRN data, there is no doubt that the time of observation affects the minimum, maximum, and average temperature recorded on a given day.”
==============
I doubt this. If the Tmax and Tmin are automatically recorded on a medium and I then go out and write down those readings whether I write them down at 1700 on Wednesday or 0700 on Thursday is not material.
If Tmax is set after 1700 I will record it the next day and the same with Tmin. TOB adjustments are nonsense.
I was thinking the same thing.
If you don’t believe that TOBs can make a difference, try what John and I did. Download some hourly CRN data, change the definition of a day (midnight to midnight, 1 AM to 1 AM, etc.) and see what impact it has on the resulting minimum and maximum temperatures.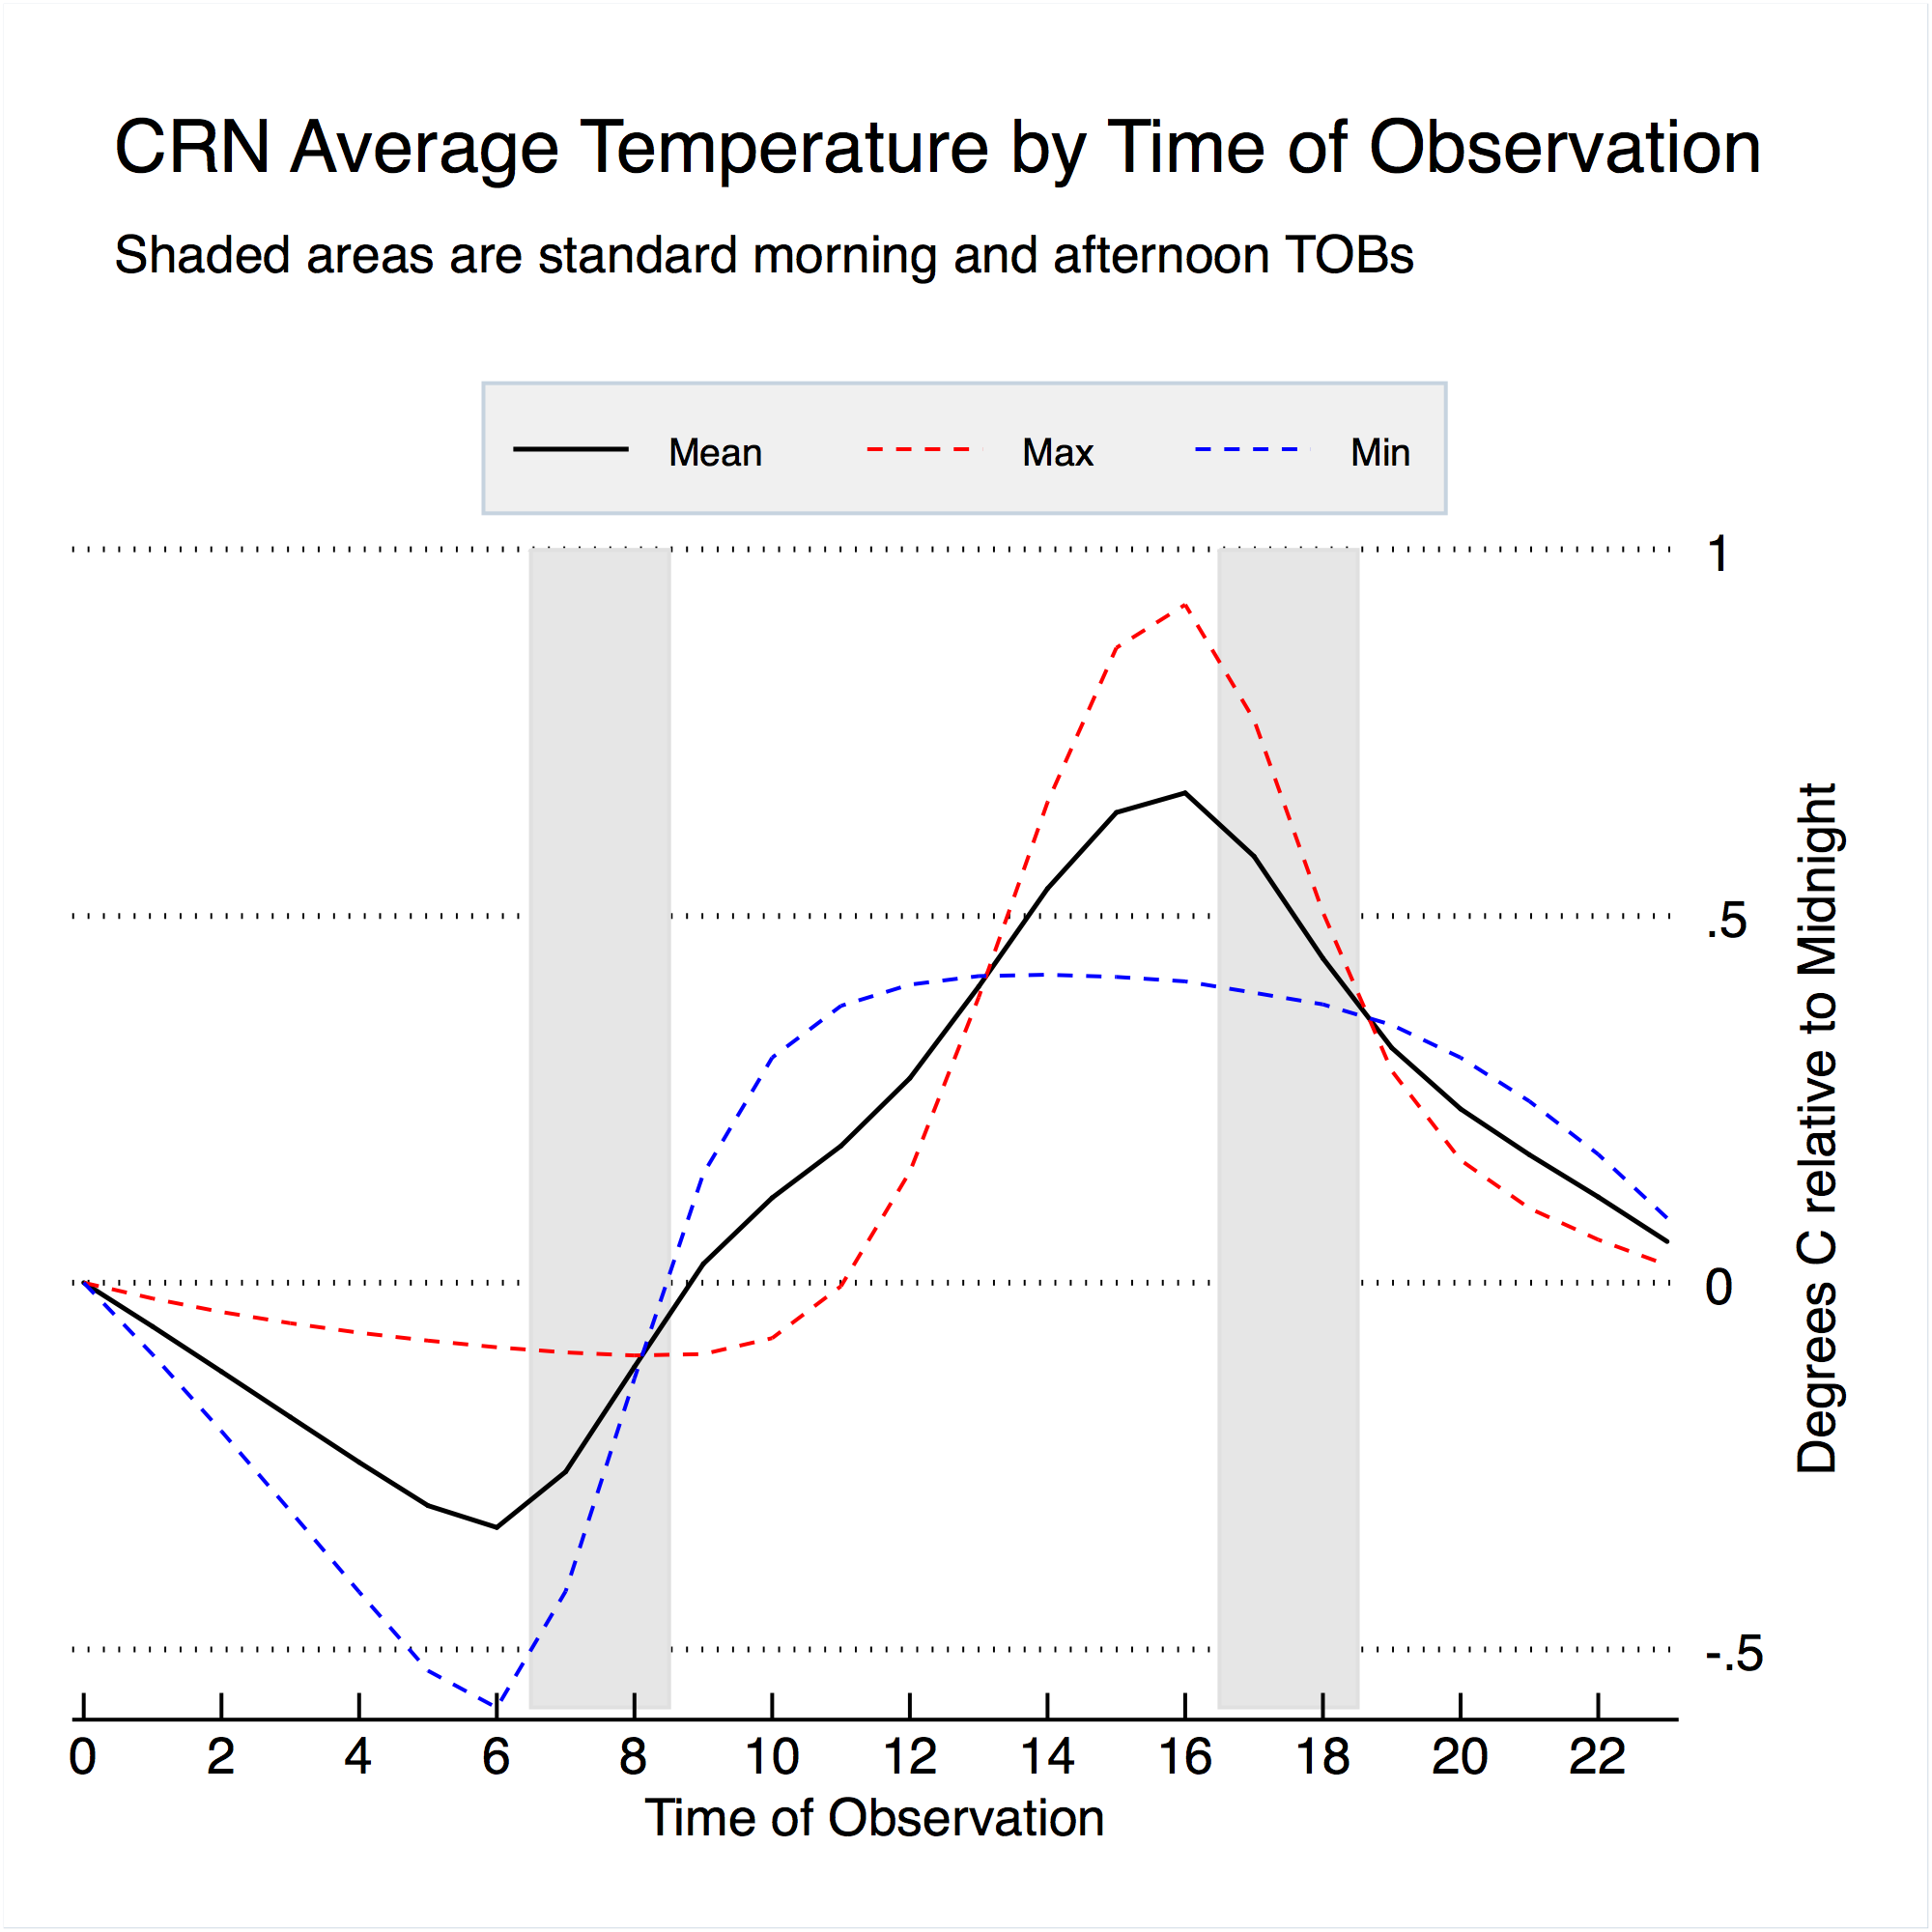
You will end up seeing something quite similar to this:
The problem with hourly data is that they don’t give you a true min and max temperature. According to Karl, the difference can be as large as -0.53 C and 0.58 C.
Hourly data contains the minimum and maximum temperatures for each hour. Use those in calculating daily max values, not the hourly mean.
Zeke, that plot shows that average temperatures are the worst ones to try using, since they are the most affected by small changes in observation time. The minimum and maximum temps each have an 8+ hour plateau where the variation due to TOBS is within the range of the instrumental error of most USHCN installations. Why take two flawed measurements, adjust them, and combine them into an even more flawed product than you started with?
If anomalies are the goal, why not just use the unadjusted min or max depending on which plateau the data were collected in?
Whoever [labeled] that CRN average temperature graph doesn’t know the difference between “Mean” and “Median”
Zeke, please hint to me how to interpret Karl’s Table 3, Mean difference of hourly minimum and maximum temperatures from the true 24-hour maximum and minimum temperature at Bismark, ND.
You cannot change the definition of a day. You can select different 24 hr periods. Once you go passed midnight a new day has started. But that is not the point it is recording something that has already happened. If I note it on Wednesday or Thursday does not change the Tmax or the Tmin.
I agree mkelly – but as I don’t actually know how they ‘define’ or extract Tmax or Tmin from automated data logging stations I’m certainly not sure why they have to have TOBS adjustment, especially for any of the traditional old ways of obtaining Tmax and Tmin during a 24 hour period. In the old days a small metal rod recorded the Tmax and Tmin on a mercury thermometer. It was reset every day (we did it as part of a Metoffice school weather program some 40+ years ago), in readiness for the next 24 hour period. I struggle to grasp how they can use modern instruments and compare to such old methods. For example, an old instrument would have taken a small period of time to reach the actual air temperature after any change, perhaps as much as 30 minutes I guess? – hence, peak and min temps would actually be naturally ‘smoothed’ by the thermal inertia of the thermometer. I have no idea what the thermal inertia of modern instruments is, but I would presume it is much less, seconds or minutes perhaps? Add to that the data logging every few seconds or so and clearly, it means that modern measured peak temps may be slightly higher than an old instrument. I guess min temps would be slightly lower too? So presumably, modern instruments introduce a possible slightly wider temp range across any given day compared to an old thermometer? Obviously, using Tmax-Tmin divided by 2 therefore gives a slightly higher reading for the standard ‘average’ temperature for modern instruments over the old ones? I’m sure this partly justifies some of the various adjustments, but I have never seen it fully explained as far as I can recall, and I certainly don’t understand why most adjustments are upwards (or seem to be!).
Conceptually you are correct. If you had a contiguous, uninterrupted record of daily minimum and maximum temperatures then the averages will not need to be adjusted as the length of that record approaches infinity. The problem occurs when boundaries are inserted into the record-keeping. Daily records have historically had monthly boundaries inserted. These boundaries cause discontinuities in the calculation of averages that causes the time of observation phenomenon.
Here is a link to a small spreadsheet that shows the problem. I extracted August, 2010 data from Kingston 1 NW CRN. I selected that month because no records are missing and none were missing from the prior month. Columns H, I, and J represent the Max, Min, and Average temperature over the last 24 hours at the time shown in column D. Columns M, N, and O represent the average monthly Max, Min, and Average that would be reported by the station to the NCDC at two different observation times: 8AM and 5PM. The difference is just over 0.2C. I’ve seen bigger differences elsewhere but hopefully this illustrates the point.
As I understand it, the Tobs problem is like this: If the temperature at Tobs is higher than next day’s Tmax, then it wil be recorded as next day’s Tmax instead of the real Tmax. So on some days only, Tmax will be too high. On all other days it will be correct, but overall there is a bias. Changing Tobs can change the bias.
Not sure – I follow you as this doesn’t really make much sense unless the Tmax for two days is exactly the same and at exactly the same time (i.e TOBS). Take a time of 9.00am, for example – (and ignoring the fact that Tmax is highly unlikely to occur at 9.00 am in most locations). I cannot forsee a likelihood of Tmax being the same exactly at 9.0am for two consectutive days (24hr periods) over the short measuring period (say 30 minutes) continuing or spanning ‘across’ the 9.00 am TOBS point, can you? Moreover, on the extremely rare occasion this might occur, this has no real effect on the averages and would technically be ‘correct’ anyway if temperature over the next 24 hours do not exceed the ‘initial’ value? yes/no? In other words, wtf is there to adjust?
Kevin, 9am is not the main issue. The afternoon readings are. Let me add one modification to Mike’s explanation.
“If the temperature at TODAYS AFTERNOON READING, WHICH RESETS THE 24 HOUR CLOCK FOR TOMORROW is higher than next day’s Tmax, then THAT READING JUST MINUTES AFTER THE RESET will be recorded as next day’s Tmax instead of the real Tmax. So on some days only, Tmax will be too high. On all other days it will be correct, but overall there is a bias. Changing Tobs can change the bias.
This correction method assumes much however, and is nothing more then guesswork. It also ignores the fact that some readers may have simply corrected this because the noticed the problem. Buy the way, this was not the officially recommended method to take T readings. The correct method avoided all TOBS issues.
If you look at the second, third, fifth and sixth photos you may notice common grasses, groomed in varied ways. Who adjusts the adjustment for the fact that mowing the lawn can change the temperature in your yard? And who is responsible for insuring that the maintenance regime for the grass is identical from year to year? Answer: some guy with a G.E.D. and 6 years of experience tinkering with small engines.
I am trying to reproduce Karl’s classic paper on the Time of observation bias, ftp://ftp.ncdc.noaa.gov/pub/data/ushcn/papers/karl-etal1986.pdf . They are using data for Bismarck, ND, 1958-1964. I can not find that data anywhere. Can anybody help with a link? Thanks.
I was unable to find the data in my initial search, but found some useful data sets on http://www.john-daly.com/tob/TOBSUM.HTM. After looking at a few I noticed they were all taken from stations located at airports. I went back to the Karl paper and noticed a number of airports as well. It was about that time I ran into Zeke’s post on Climate Etc. and kicked myself for not thinking of the CRN sites. I think you can use the CRN data and follow Karl’s methodology to get a set of useful results.
Thank you, John. My problem is that I don’t understand Karl’s methodology at all. I am guessing that he is deriving TOB from hourly data, but he does not say it clearly. Of course he knows that hourly data do not provide a true min / max temperature, and he does not describe any direct TOB comparison with a min-max thermometer measurement (but he notes that the true min/max may be about 0.5 C outside of horly min/max.) I need his original data to rediscover his methodology.
George, have you looked at Nick Stokes website, he had links to that data.
http://moyhu.blogspot.co.uk/2014/05/the-necessity-of-tobs.html?showComment=1399901028877#c4370222231901430764
A C, thank you, it looks promising.
John,
As the SurfaceStations Project participant who documented the Kingston USHCN site, I want to make some additional observations about the location. Since 2001 there has been continuing encroachment of parking lots to the east of the USHCN and CRN-1NW instrumentation. In fact, asphalt now covers the whole area between W. Alumni Ave and the curve of Flagg Rd. (aka Plains Rd.) with the final construction (not shown in the aerial view) occurring two years ago. None of that existed fourteen years ago. The site now is more likely to be influenced by heat acquired by the parking area than it was when the CRN site was established and the USHCN site was relocated in the 1970s. The encroachment brings into question the quality of the data in the last few years and going forward. Comparison with the CRN-1W data may show an artificial heating effect. It looks like there may be enough to analyze, particularly at the hourly level. I had wanted to do this myself but time has not permitted. At the very least, a review of the siting should be conducted to consider if moving the CRN-1NW farther away from artificial heat sources is warranted.
Gary Boden
Gary, wouldn’t the lake near the CRN-1NW affect it’s temperature when the wind is blowing from that direction just as much as heat from the asphalt does when the wind is blowing from that direction?
If so then you need to record the wind direction as well as the temperature, as the 2 of them could cause bigger swings in temp.
AC,
The pond is a natural component that was there when the station was established. The parking lots are artificial and recent. Wind direction typically is from the SW and SE in the summer and since the station is only ten miles from the Atlantic coastline, there often is a cooling afternoon sea breeze. Prevailing winds in the winter are from the NW and NE, The issue is what heat is coming from the parking lots in the evening? Does it artificially boost the minimum temperature? Can we tell if the hourly data are matched to the other CRN station a mile to the south?
Thanks for this comment Gary. It would be an interesting analysis. To me, it isn’t about urban vs rural stations when talking about UHI,,the key is one that is being encroached on vs one that isn’t. I’m betting many stations (majority) are in areas where they are being encroached on.
Thanks Gary. That is an interesting observation. I checked the trends of the two stations (using anomalies) and it does appear that the NW station has an ever-so-slight upward trend relative to the W station, especially since 2007. But it is pretty small and may be insignificant at this point, given the short time period in question. We may have to wait a number of years to see if there really is a divergence. Leaving the NW station in place as the surrounding development closes in would provide an interesting case study in UHI.
A case for making adjustments to the temperature record can be made. However, only if the criteria and methodology are well defined and withstand completely open public scrutiny. Also, I would place the additional requirement of: all the raw data and adjustments are made completely open to public review.
So is it warming everywhere or just CONUS? Based on the lack of data in Africa, 1/5th of the land mass, I presume global temperatures are pretty much a WAG.
And how is any of this connected to CO2 concentrations? Temperatures aren’t rising, ice sheets aren’t melting, sea levels aren’t rising. What, did CO2 take a break? Or did CO2 never really mean much? Are GHGs radiative forcings trivial compared to other climate changing forces? (Answer: Yes.)
All of this is interesting, but let’s keep eyes on the prize, killing the beast: useless, wasteful, CO2/GHGs, carbon free, anti-fossil fuel, dumb ass (what else?) government, economy trashing, freedom killing, solutions to a non-existent problem.
Zeke has commented on this piece in SkepticalScience. As scientists it is probably best to read what he says before rushing to conclusions. Perhaps the author of this piece will respond to Zeke on SkS
Hi Ian,
I’m happy to respond to folks here. I see the fact that the mean results of TOBs adjustment using CRN data are nearly identical to the actual TOBs adjustments as a validation of the approach. John, in the original post, highlights the difference between the two. While there is some difference, particularly month to month, this is expected. The TOBs algorithm provides constant monthly adjustments; in reality, the actual propensity of double-counting high or low days for a given time of observation will have a large stochastic component that will never be captured by a prescriptive model. As long as the mean and variance of the adjustment are comparable to that seen in the ground truth data (as is the case here), I see that as evidence that the adjustment is correct.
Zeke, a few questions. Do you know exactly what percentage of stations changed observation time from late afternoon to morning? Also, do you have morning data for those stations from back then — or do you base your calculations strictly on 21st century data?
John,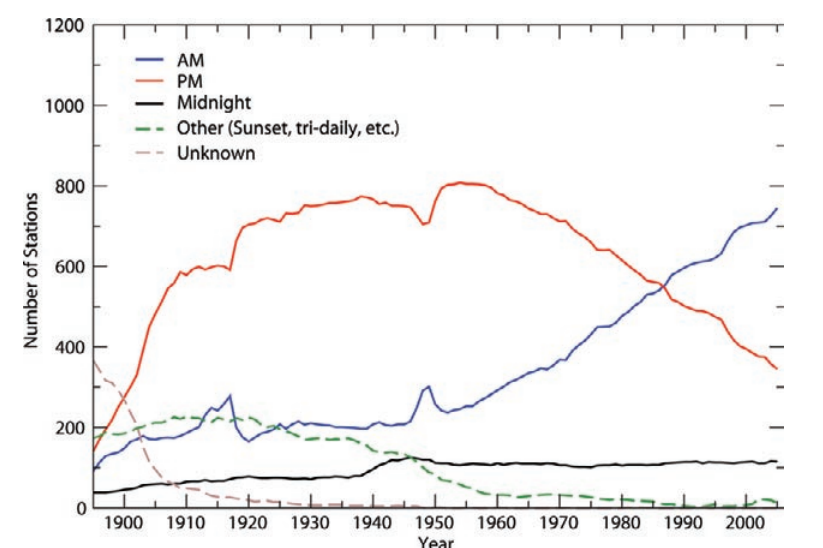
Here is a graph showing TOBs for all stations. Its recorded in the station logbooks for each station.
… for all stations.. ALL ??
Eyeballing the curves, it appears to about 1300 stations and a surprisingly constant number from about 1930 on. No hint of a great thermometer die-off. See: What is the time of observation of a non-existent temperature reading?
I think we are looking at a very particular subset of stations.
Zeke, thanks for the graph. Do you know what the data show at stations that did NOT change TOB? Hundreds of stations take the measurements at midnight, e.g. How much has temperature changed at those stations? Same with other stations that did not change, either from the morning or evening.
If there is a bias, it should show up in the data from those actual stations. (Assuming other factors did not enter in.) We wouldn’t need a model to estimate them, would we? Just arithmetic?
Instead of making a TOBS adjustment to the data, why didnt they just simply go back to measuring the temperature at the same time of day as the previous measurements, then no adjustment would be required. Instead it seems they PREFER to be able to make an adjustment, it gives climatists more “wiggle-room” in order to get the data to agree with the models.
It’s my understanding that TOBS “adjustments” are only done on U.S. raw data. If this is correct, then TOBS is essentially a non-factor in global temperature anomaly trend estimates. That’s because all of the world wide data outside the U.S. were measured and recorded without any errors whatsoever…
I have checked Boulder for 2014 to learn what this TOB is about. It really gives a difference that for this station can be 0.6C between the yearly average of al the 24 measurements each day and the Max-Min average taken at the worst time, that happens to be 2pm. Boulder might be exceptionel because of very large changes in temperature.
Never the less i wonder if it gives any meaning to prefer one type of measurement for the other.
The problem comes when the climate is mixed in, and the ever seaching for a trend and warmest year/month/week/day.
Compare it to the daily and yearly variations, then this 1C change in an average is blown out of proportion. The changes you feel and observe would be weather, if you where not constantly told that it is dangerous climate change. I feel in danger every night when the temperature drops 10C as i do during day, when it raises the same 10C.
That said, if they try to make trensds and so on, it must be on a sound and replicable official ground.
Especially because it has political implications, and is not just an academic discussion.
I did a similar analysis of Boulder data here.
“Never the less i wonder if it gives any meaning to prefer one type of measurement for the other.”
No one is saying that any TOB is better. The point of the TOBS adjustment is to fix what happens when the time (TOB) is changed.
The point is, DOES it fix what happens when a TOBS adjustment is applied?
The adjustment its itself an estimate to an unknowable, untestable quantity. Any adjustment applied to something else must ADD to the uncertainty of the measurement.
I see no evidence that added uncertainty is properly accounted for. — It is NOT random error but entirely systematic and therefore cannot diluted through the use of large sample sizes.
You know, I’ve never gotten the Time-of-day adjustment. It makes absolutely no sense why it would apply at all when using a min-max thermometer.
The reason is that you have the minimum in a 24 hour period and the maximum. due to the communicative properties of addition, you end up with an annual average as Min1/2+Max1/2+Min2/2+Max2/2 etc. The max is normally in the Early afternoon to evening and the min is normally in the hour before dawn. The time of reading might switch which max goes on which day, and it will occasionally bleed a heat or cold wave one day longer or shorter, but it should not have a significant affect on total measurement or trend.
If it non-trivially affects the annual average, then that means that you have such irregular peaks that the min-max thermometer is a completely inappropriate measuring tool.
Which, actually, I think is the correct conclusion.
Ben, the TOB logic goes like this: A true daily min/max temperature must be measured midnight to midnight – that’s a definition of a day. It you read a min-max thermometer at 1 am, you are probably recording a temperature for a previous day, not for today, so you got a one day shift.
Now we have opened a Pandora’s box of which definition of a day to use. A day of a local time? A day of a local time zone? A day of the Universal Time?
I don’t see how it matters. Let’s say you sample min/max at some specific time for 10 years, and the. Change it to different time and do it for another 10 years. This would cause you to possibly incorrectly assign max or min to wrong day for that particular day only – you’d have a tobs error for 1 day out of 10 years worth of data.
I really don’t understand this “look at my data for examples” that everyone talks about. Why?
This appears to be fairly simple and straightforward issue that is known to anyone who done any ADC conversion. What am I missing here?
The only day that really matters in this case is from one daily minimum to the next days minimum.
Udar, it’s more to it than that. You can double-count cold waves or heat waves if they occur across the measurement time (for example, a cold wave that lasts 4 hours from 6AM to 10AM would be a minimum on 1 day if you measure at midnight or 2 days if you measure at 8AM), so they won’t be precise one day shifts. However, that should be a random occurrence for both mins and maxes, averaging out over time to no significant difference.
Ben, I too feel that the difference should average out. But Karl determined (I am trying to find out how) that reading min-max temperature at 6 pm increases an April average temperature by more that 1 degree C.
On a clear day/night min temp is about at sunrise, max is late afternoon, early evening depending on time of year.
Coming back and answering my own question, that double-counting a heat wave does actually occur a lot when you measure in the late afternoon, near the peak of the day’s temperature. If you measure in the very early morning (like the hour before dawn), you have a good chance of double-counting the coolest part of the day. This bias disappears when you check it in a non-peak time such as mid-morning or late evening.
If you believe that temps for official records are measured near the high of the day, day after day, the you have to assume the recorder is either an idiot or someone who just doesn’t care to do it right.
My father kept his own min-max temperature records for 30 some years for his own account, recording on K&E 1 mm red graph velum in the evening when he came home from work. But if a cold snap came through in the evening, he might reset the max the next morning — because he didn’t like to record crappy data. He wanted to know the max of that day and he knew yesterday’s 6pm max probably wouldn’t be topped today.
The logs may say when Time of Observations when temperatures were recorded. But do we know that time was always when the min or max markers were set?