By Paul Homewood
The sharp rise in UK temperatures, which effectively began in the 1980’s, is widely known about, but, (and I may be wrong here), has never been satisfactorily explained. Indeed, I am not sure anybody from the Met Office, Hadley Centre, etc has ever seriously attempted to explain it.
Usually, whenever it is mentioned, it is brushed aside as “climate change”. I have always thought this to be nonsense, as, whatever our views of global warming theory, CO2 does not possess the magical properties that enable it to suddenly raise temperatures in such a way, thereafter followed by a decade long pause. Theory tells us that, as CO2 increases in the atmosphere, temperatures should rise gradually and steadily.

http://www.metoffice.gov.uk/climate/uk/summaries/actualmonthly
A few weeks ago, whilst checking something else, I became aware that around the same time that UK temperatures began to rise, sunshine hours also increased sharply, as the Met Office below shows. Indeed, not only did it rise, but it increased to levels well above anything seen since records start in 1929.

http://www.metoffice.gov.uk/climate/uk/summaries/actualmonthly
I naturally wondered whether there was a connection here, but was initially thrown as the largest increase in sunshine hours was during winter and spring, with little change in summer. This seemed counterintuitive, since we would normally associate bright, sunny winters with cold weather. At that stage, I filed it all away in my memory and went off to beat the wife instead.
However, in last week’s Sunday Telegraph, I came across this piece on December climate from Philip Eden, (as always, not available on line).

Now the jigsaw began to fit into place. The increase in sunshine hours, particularly during winter, was not caused by changing weather patterns but a reduction in air pollution. It is not unreasonable, then, to surmise that this increase in sunshine was, at least in part, responsible for the increase in temperatures we have seen.
As the graph below shows, there is pretty good correlation between sunshine and temperature.

http://www.metoffice.gov.uk/climate/uk/summaries/datasets
There is nothing very new in this argument, as air pollution has often been quoted as the reason for the decline in northern hemisphere temperatures during the 1960’s and 70’s. However, that logic misses the point that pollution has been a major factor since the mid 19thC. If it is true that a polluted atmosphere can depress temperatures, then these temperatures have been lower as a result for a century or more.
With a cleaner atmosphere now, temperatures have simply returned to the level they would have been at in the past.
This phenomenon of a sharp rise in late 20thC temperatures is not limited to Britain. We see the same effect across much of NW Europe, for instance France and Germany, as GISS show:


http://data.giss.nasa.gov/gistemp/station_data/
Combined with the recovery of the Atlantic Multidecadal Oscillation, from its low point in the late 1970’s, how much has reduced air pollution, and therefore more sunshine, contributed to UK and European warming in the late 20thC?
Thanks to John Cooknell, who has referenced the Met Office’s Climate Memorandum No21, which looked at sunshine hours, amongst other things in 2006.
On page 15, they state:
Table 12 shows the percentage change in sunshine, based on a linear trend starting from 1929. It shows that the greatest and most significant changes occurred in the winter season, when there has been an ncrease in sunshine of about 20% for central and northern England.
Sunshine has also increased in these areas by about 10% in autumn, and by 8% over the year as a whole for eastern and NE England. These increases could be a result of the Clean Air Acts of 1956 onwards, which has led to a decrease in air pollution.
http://www.metoffice.gov.uk/media/pdf/q/h/UK_climate_trends.pdf
Whether increased sunshine hours have had an effect on temperatures is a moot point. But it does seem that the phenomenon is tied in with pollution.
An anecdote from my mother. In one of the (in)famous London smogs of the 1950s, she attempted to cross the street and failed. Visibility was so poor that she was unable to find the other side of the street.
Another anecdote: I drove into Manchester in 1978. The fog was so thick that you couldn’t see the traffic lights at intersections, They had put burning oil pots in the middle of intersections so drivers knew the intersection was there.
Yes, global brightening, or surface incident solar radiation (SSR), can explain most of the warming in Europe, and across the globe, during the 1980s to 2000s period. The below papers (17) explain that there was +2 to +7 W/m-2 per decade of radiative forcing exerted on the planet mostly due to less cloud cover during that period, allowing more solar radiation to reach the surface (oceans). In contrast, the IPCC states that anthropogenic CO2 only exerted 0.3 W/m-2 per decade of radiative forcing during the 1951-2011 period. Thus, it can be said that solar forcing had 10 times more of an influence on the warming that took place in the 1980s to 2000s than anthropogenic factors did.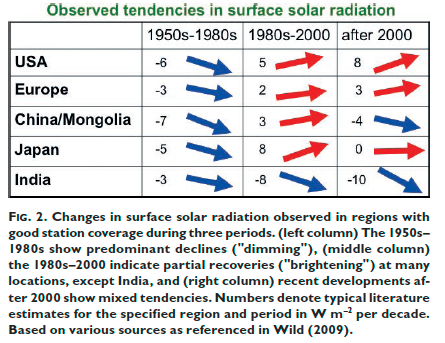
—————–
“Over the period 1951–2011 the trend in anthropogenic forcing is almost 0.3 W m–2 per decade and thus anthropogenic forcing over this period is more than 1.5 W m–2.” IPCC AR5 Chapter 8, page 699
——————
http://journals.ametsoc.org/doi/abs/10.1175/JCLI-D-12-00040.1
A pronounced summer warming is observed in Europe since the 1980s that has been accompanied by an increase in the occurrence of heat waves. The authors show that the variance of European summer temperature is partly explained by changes in summer cloudiness. Using observation-based products of climate variables, satellite-derived cloud cover, and radiation products, the authors show that, during the 1984–2007 period, Europe has become less cloudy (except northeastern Europe) and the regions east of Europe have become cloudier in summer daytime. In response, the summer temperatures increased in the areas of total cloud cover decrease and stalled or declined in the areas of cloud cover increase. Trends in the surface shortwave radiation are generally positive (negative) in the regions with summer warming (cooling or stalled warming), whereas the signs of trends in top-of-atmosphere (TOA) reflected shortwave radiation are reversed. The authors’ results suggest that total cloud cover is either the important local factor influencing the summer temperature changes in Europe or a major indicator of these changes.
—————–
ftp://bbso.njit.edu/pub/staff/pgoode/website/publications/Palle_etal_2005a_GRL.pdf
Traditionally the Earth’s reflectance has been assumed to be roughly constant, but large decadal variability, not reproduced by current climate models, has been reported lately from a variety of sources. There is a consistent picture among all data sets by which the Earth’s albedo has decreased over the 1985-2000 interval. The amplitude of this decrease ranges from 2-3 W/m2 to 6-7 W/m2 but any value inside these ranges is highly climatologically significant and implies major changes in the Earth’s radiation budget.
—————
http://www.atmos-chem-phys.net/13/8505/2013/acp-13-8505-2013.html
[T]here has been a global net decrease [of 3.6%] in 340 nm cloud plus aerosol reflectivity [which has led to] an increase of 2.7 W m−2 of solar energy reaching the Earth’s surface and an increase of 1.4% or 2.3 W m−2 absorbed by the surface [between 1979 and 2011].
—————-
http://onlinelibrary.wiley.com/doi/10.1029/2010JD015396/abstract
We find distinct patterns of dimming and brightening in the aerosol optical depth and thus clear-sky downward surface shortwave radiation (SSR) in all analyzed subregions.The strongest brightening between 1973 and 1998 under clear-sky conditions is found in mid-Europe (+3.4 W m−2 per decade [8.5 W m−2 total], in line with observations).
——————
http://onlinelibrary.wiley.com/doi/10.1002/2013JD021322/abstract
Trends in downwelling global solar irradiance were evaluated at high elevation sites on the island of Maui, Hawai‘i. Departures from monthly means were assessed for the 6-month Hawaiian wet and dry seasons over the period 1988 to 2012. Linear regression analysis was used to characterize trends in each season. For the dry season (May-October), statistically significant (p ≤0.05) positive trends of 9–18 W m-2 (3–6%) per decade were found at all four high elevation stations tested. Wet season trends were not significant, except at the highest elevation station, which had a significant negative trend. No consistent trends in aerosol concentrations have been observed at high elevations in Hawai‘i, therefore, the observed dry-season brightening is most likely the result of decreasing cloud cover. Supporting this hypothesis, analysis of 15 years (1997-2012) of high temporal resolution Geostationary Operational Environmental Satellite (GOES) imagery over the Hawaiian Islands showed a statistically significant decrease in leeward cloud cover amounting to 5–11% per decade over the stations. In addition, analysis of Moderate Resolution Imaging Spectroradiometer (MODIS) data were in general agreement with the GOES trends, although statistically significant dry-season trends were found at only one of the four stations.
——————-
http://www.sciencemag.org/content/308/5723/850.abstract
Long-term variations in solar radiation at Earth’s surface (S) can affect our climate, the hydrological cycle, plant photosynthesis, and solar power. We observed an overall increase in S [solar radiation] from 1983 to 2001 at a rate of 0.16 watts per square meter (0.10%) per year [3.04 W/m-2 total]
——————-
http://onlinelibrary.wiley.com/doi/10.1002/joc.4107/abstract
The annual sunshine duration mean time series shows a decrease from the early 1960s to the late 1970s [in Iran], in line with the widespread dimming of surface solar radiation observed during this period. By the early 1980s, there is an increase in sunshine through the end of the 20th century, aligning with a well-known and well-documented brightening period.
——————-
http://onlinelibrary.wiley.com/doi/10.1029/2008JD011290/abstract
http://ir.hfcas.ac.cn/bitstream/334002/5066/3/Observed%20decadal%20variations%20in%20surface%20solar%20radiation%20and%20their%20causes.pdf.txt
The decadal trend shown in the 5-year running mean indicates a period of rapid increase [solar radiation reaching the surface/brightening] starting in late 1930s and continuing to early 1950s with a change of 10 W m2. The dimming trend from the early 1950s to the late 1980s shows a decrease of 13 W m2. The subsequent increase starting in late 1980s is about 10 W m2 by 2005. These changes are not confined to a small number of stations in western Europe, but shared by more than 400 other sites where global irradiance has been continuously observed for more than 40 years.
——————-
http://www.sciencedirect.com/science/article/pii/S1352231014007456
Total global solar shortwave (G) irradiation and sunshine duration were recorded at nine Spanish stations located in the Iberian Peninsula. Averaged series (using the nine locations) showed a statistically significant decrease in annual G [global dimming] from 1950 to the mid 1980s (−1.7%dc−1) [-8.5 W/m2] together with a significant increase [global brightening] from the mid 1980s to 2011 (1.6%dc−1) [+8 W/m2].
——————-
http://www.atmos-chem-phys.net/14/12251/2014/acp-14-12251-2014.html
Concerning the global solar radiation, many publications agree on the existence of a solar dimming period between 1970 and 1985 and a subsequent solar brightening period (Norris and Wild, 2007; Solomon et al., 2007; Makowski et al., 2009; Stjern et al., 2009; Wild et al., 2009; Sanchez-Lorenzo and Wild, 2012). Different studies have calculated the trend in Sg after 1985. The trend in Sg [global solar radiation] from GEBA (Global Energy Balance Archive; between 1987 and 2002 is equal to +1.4 ( 3.4)Wm-2 per decade according to Norris and Wild (2007). Stjern et al. (2009) found a total change in the mean surface solar radiation trend over 11 stations in northern Europe of +4.4% between 1983 and 2003. In the Fourth Assessment Report of the IPCC (Solomon et al., 2007), 421 sites were analyzed; between 1992 and 2002, the change of all-sky surface solar radiation was equal to 0.66Wm-2 per year. Wild et al. (2009) investigated the global solar radiation from 133 stations from GEBA/World Radiation Data Centre belonging to different regions in Europe. All series showed an increase over the entire period, with a pronounced upward tendency since 2000. For the Benelux region, the linear change between 1985 and 2005 is equal to +0.42Wm-2 per year, compared to the pan-European average trend of +0.33Wm-2 per year (or +0.24Wm-2 if the anomaly of the 2003 heat wave is excluded) (Wild et al. 2009). Our trend at Uccle of +0.5 ( 0.2)Wm-2 per year (or +4% per decade) agrees within the error bars with the results from Wild et al. (2009).
——————
http://nml.yonsei.ac.kr/front/bbs/paper/rad/RAD_2005-3_Wild_et_al.pdf
A similar reversal to brightening in the 1990s has been found on a global scale in a recent study that estimates surface solar radiation from satellite data. This indicates that the surface measurements may indeed pick up a largescale signal. The changes in both satellite derived and measured surface insolation data are also in line with changes in global cloudiness provided by the International Satellite Cloud Climatology Project (ISCCP), which show an increase until the late 1980s and a decrease thereafter, on the order of 5% from the late 1980s to 2002. A recent reconstruction of planetary albedo based on the earthshine method, which also depends on ISCCP cloud data, reports a similar decrease during the 1990s. Over the period covered so far by BSRN (1992 to 2001), the decrease in earth reflectance corresponds to an increase of 6 W m-2 in absorbed solar radiation by the globe. The overall change observed at the BSRN sites, estimated as an average of the slopes at the sites in Fig. 2A, is 0.66 W m-2 per year (6.6 W m-2 over the entire BSRN period).
——————
http://onlinelibrary.wiley.com/doi/10.1002/2014JD021877/abstract
Radiative forcing in both the short and long-wave lengths reaching the Earth’s surface accounted for more than 80% of the inter-annual variations in the mean yearly temperatures measured at Potsdam, Germany during the last 120 years [1893-2012]. Three-quarters [75%] of the increase in the long-wave flux was due to changes in the water content of the lower atmosphere; the remainder [25%] was attributed to increases in CO2 and other anthropogenic, radiatively active gases. Over the period radiative forcing in the short-wave flux [solar forcing] slightly exceeded [0.76 W/m2 per decade] that in the long wave [0.64 W/m2 per decade].
——————
http://onlinelibrary.wiley.com/doi/10.1029/2008GL034842/full
The surface net radiation (surface radiation balance) is the key driver behind the global hydrological cycle. Here we present a first-order trend estimate for the 15-year period 1986–2000, which suggests that surface net radiation over land has rapidly increased by about 2 Wm−2 per decade, after several decades with no evidence for an increase. This recent increase is caused by increases in both downward solar radiation (due to a more transparent atmosphere) and downward thermal radiation (due to enhanced concentrations of atmospheric greenhouse-gases). The positive trend in surface net radiation is consistent with the observed increase in land precipitation (3.5 mmy−1 per decade between 1986 and 2000) and the associated intensification of the land-based hydrological cycle.
—————–
http://onlinelibrary.wiley.com/doi/10.1029/2008GL034228/full
SDR [shortwave downward radiation] annual mean time series [was] averaged over the eight German and the 25 Swiss sites for all-sky (all measured situations), cloud-free and cloudy periods. All-sky solar irradiance (SDR) shows positive trends from 1981 to 2005 at the German and the Swiss sites. The average increase in SDR at all stations is +2.99 [+0.52 to +5.46] W/m-2 per decade. All-sky radiation trends are largely affected by the year 2003, with strongly reduced cloudiness and hence increased shortwave radiation during the extreme summer.
——————
http://file.scirp.org/Html/22-4700327_50837.htm
The reduction in total cloud cover of 6.8% [between 1984 – 2009] means that 5.4 Wm−2 (6.8% of 79) is no longer being reflected but acts instead as an extra forcing into the atmosphere… To put this [5.4 Wm-2 of solar radiative forcing via cloud cover reduction between 1984-2009] into context, the IPCC Fifth Assessment Report…states that the total anthropogenic radiative forcing for 2011 relative to 1750 is 2.29 Wm−2 for all greenhouse gases and for carbon dioxide alone is 1.68 Wm−2. The increase in radiative forcing caused by the reduction in total cloud cover over 10 years is therefore more than double the IPCC’s estimated radiative forcing for all greenhouse gases and more than three times greater than the forcing by carbon dioxide alone [from 1750 to present].
——————-
http://journals.ametsoc.org/doi/abs/10.1175/JCLI-D-12-00482.1?journalCode=clim
Surface incident solar radiation G determines our climate and environment…Data from this summation method suggest that surface incident solar radiation increased at a rate of 6.6 W m−2/decade−1 (3.6%/ decade) from 1992 to 2002 (brightening) at selected sites.
——————-
http://journals.ametsoc.org/doi/pdf/10.1175/BAMS-D-11-00074.1
Literature estimates for the overall SSR [surface solar radiation] decline during dimming (1950s to 1980] range from 3 to 9 W m−2, and from 1 to 4 W m−2 for the partial recovery during subsequent brightening [1980s to 2000] (Stanhill and Moreshet 1992; Liepert et al. 1994; Abakumova et al. 1996; Gilgen et al. 1998; Stanhill and Cohen 2001; Alpert et al. 2005; Kvalevag and Myhre 2007; Kim and Ramanathan 2008; Wild 2009).
Paul, I believe that I have already pointed out to you that in September 1987 a drastic step change in European surface temperatures occurred. The data sets that you reference (Berlin Dahlem and Bourges have virtually identical temperature patterns, both showing a step change of about 0.7 C becoming obvious at September 1987. De Bilt, many Swiss sites, the UK, Dublin, and other places in Europe and beyond demonstrate the same thing. Since that date the site temperatures have been effectively constant. Prior to that date there is usually a slight increase, over the previous 50 or so years, but everywhere has the step change, occasionally a year later than Sept1987. I have had some correspondence with KNMI – not releasing the name yet, since I’ve not had time to write to him since he provided me with his (their) explanation for the De Bilt step that I demonstrated to him. The explanations are complex, detailed and erudite, but until I’ve had time to read the papers he sent properly I cannot possibly comment. Nevertheless, I feel it somewhat unlikely that this complex climatological stuff, directed I believe at the De Bilt discontinuity, can provide a feasible/plausible explanations for the widespread and remarkably simultaneous occurrence of steps at places hundreds of kilometers apart, and in some cases at well over 1000m altitude. However, I shall tread a bit carefully.
I like Espen’s contribution at the start of this thread, and hope to find a bit of time to look at precipitation data. It will all have to wait for two or three weeks, though.
If I knew how to post some graphics I would!
Having visited the UK many times since the 1960s until 2005, I can attest to the appalling air pollution back in the 1960s. But it has long been my contention that British weather improved immensely in the years after 1973 when Britain joined the (then) EEC. I have always surmised that it was something to do bringing british weather into line with EEC standards dictated from Brussels.
I think that as the arctic sea ice extent started to decline in september we had milder winters in the UK and Europe but if the arctic sea ice extent increases in September(I know we are told this cannot happen) then the UK and Europe will have harsher winters as we did in 60s and 70s.I was at school in the sixties and I remember the cold winters we had then.
Just wait for the AMO to turn, Don, and that’s exactly what we’ll get
Sunshine hours is usually the variable that is the most strongly coherent with station temperatures throughout the entire spectral range of frequencies. That said, however, it remains to be seen whether air pollution is the governing factor here. It’s hard to imagine it realistically exceeding natural cloudiness varaitions in the strength of its effects
You are probably right but it’s a little more complicated than that. The pollution in the atmosphere got to such a degree that once a temperature inversion had formed it would prevent penetration of sunlight for a considerable time. Hence not only did it act as a sunshine filter but it ” locked in” a temperature inversion for much longer than it should have lasted. I think this would have driven down the surface temperature average even more. Incidentally I was monitoring air quality in London in the late eighties and early nineties. I completely agree that by that time the air quality had improved to the extent that inversions broke up as soon as the meteorology allowed.
Up until the late seventies most automotive , industrial pollution and electricity generation was from soot carbon monoxide Co and sulphur The steal industry add carbon to the mix to create CO2 to stop oxygen bubbles forming. By putting catalytic converters on cars (not diesels) and precipitators on coal fired power stations , the insulating cloud has been lifted from above countries that have tried to address the problem and result more sunlight .
https://tallbloke.files.wordpress.com/2012/02/maxtempvssunshineukstudy1220112.pdf
I looked at the CET bright sunshine/max temperature for 1930 – 2010 at the above. I found a very clear relationship of cloud cover to maximum temperatures (we all know that the less clouds, the warmer the day is), with a oceanic release/absorption cycle of the AMO-PDO laid on top. Besides the conclusions (below, from the abstract) I saw that 2010 was at the end of the current cycle of warming, with a prediction of cooling in the works for Central England.
There was also a linear increase with time that could be CO2 related, but it was minimal All parameterrs were sufficiently well behaved to produce a graphically-displayed set of predictions.
Have a look:
Three factors were found to be associated with all temperature changes:
1. The duration of bright sunshine, such that C = 9.27E-3C X Sunshine hour – 0.10C. This factor was constant with time, but the changes in bright sunshine hours followed (with time) a quasi- sinusoidal pattern with indeterminate amplitude, but a peak-to-peak cycle of 62 years.
2. A quasi-sinusoidal (with time) Pacific Decadal Oscillation-Atlantic Multidecadal Occillation-like variation, with a cycle length of 56 years and amplitude of 0.31C.
3. A linear (with time), consistent increase of temperature, such that C = 9.53E-4 (Yr-1873) – 0.1425 C.
Did you consider minimum temperatures as well, Doug?
Hi, Paul,
I didn’t consider minimum temperatures because those would occur at night (unless a cold front moved in). Certainly temperatures drop with clear skies, but you would first have to break out other factors. Any weather that has clear skies will have a maximum temperature higher than one that has cloudy skies, however. Windy or calm, any of the four seasons, humidity high or low, will have warmer air on cloudless skies.
Bright sunshine I considered more reliable than sunshine hours, also, as bright sunshine has a thermal threshold (burn marks on paper, I understand), though now it may well be a digital reading. Regardless, the top end of the series is more reliably identified as the signal-to-noise ratio is much higher.
The really interesting connection I made was that deviations from the mean of bright sunshine plotted against maximum temperature readings had a discernible 3rd dimension – time. I’m sure someone could plot the thing 3-dimensionally; I had to identify each data point by hand. But the cycles became clear.
I would have liked to do something similar for an American geographic area, but did not know where the data was. I think it works for Central England because the area is small enough and the weather patterns large enough to reduce the noise portion. I expect it would work for Germany or France, but for the United States it would not in general. It might work, however, for inland Californian, Nevada and Arizona as a dry group, and the New England states as a wet group. It wouldn’t work for Rocky Mountain states or Alberta because, I expect, the natural variability is too high.
“Global” is, IMHO, a collection of regionals, the changes in which may be mathematically significant without representing more than redistribution of energy effects. I call this “computational reality” vs “representational reality”, like saying the average height of the family has risen whereas we just added a son-in-law who is a basketball player: the numbers crunch, but the “group” really isn’t any taller.
Something changed in the late 1980s?
Note that Clean Air legislation rarely states that, the minute such legislation is passed, people should cease all pollution.
More usually it mandates cleaner standards for new equipment, and then relies on natural replacement. Or alternatively it defines a date in the future when cleaner standards must be complied with. It is worth looking to see if legislation passed in the 1970s would only have had an impact some 15 years later…
“As the graph below shows, there is pretty good correlation between sunshine and temperature.”
Gasp! Who’d have thought it?
But if the reduced pollution theory is correct, then the warming is indeed man made, since it results from the Clean Air Acts passed by Parliament.
Pollution doesn’t explain the warming during Winter in the UK, but the North Atlantic Oscillation (NAO) does. During recent years since the increased sunshine hours, December has actually got slightly colder on average, one of the only month to do so.
http://www.climatedata.info/resources/Forcing/Oscillations/04-Pacific-Decadal-Oscillation-index.gif
The UK warmed during the time where the NAO become increasingly positive. Soon as this changed and the NAO become increasingly more negative, the UK temperatures failed to warm and in fact generally cooled since. This year though has been a big exception to this recent pattern.
http://www.whoi.edu/cms/images/nao_n_213433.jpeg
During the cool phase before the warming began, the above scenario occurred fairly regularly with the NAO mainly negative. In this situation the weak Atlantic storm track enables colder air to filter from the North and East often across Europe and UK. That’s why despite cloudier conditions at the time during Winter had no warming affect on winter seasons due to much colder air source from the North and East.
http://www.whoi.edu/cms/images/dfino/2006/1/scmitt_colder_n_19470.jpg
During the period when NAO become increasingly positive, the other type of scenario occurred. In this situation the strong Atlantic storm track penetrates into Europe and the UK, with frequent mixture of sunshine and showers, bands of rain, between temporary ridges of high pressure keeping it dry.The Atlantic ocean is relatively mild so these storm tracks bring the much milder temperatures with them.
I would think the likely biggest difference to increased sunshine levels on temperatures would be during Spring/Summer with warmer sun affecting temperatures much greater. Warmed seas/oceans tend to cause more cloud cover during Autumn with similar strength of sunshine to spring.
I have linked the PDO before with similar pattern towards the NAO now shown below.
http://www.climatedata.info/resources/Forcing/Oscillations/05-North-Atlantic-Oscillation.gif
Minimum temperatures don’t (usually) occur at night. They generally occur shortly after dawn when warming from solar radiation at the surface equals cooling from outgoing long wave radiation.
Which explains how increased solar radiation at the surface has a substantial effect on winter minimum temperatures, especially at higher latitudes like the UK.
Just after dawn, solar radiation travels at a low angle through the atmosphere, and for a longer period in winter, and is most affected by interference (blocking) by aerosol and particulate pollution and aerosol seeded clouds which are mainly close to the ground.
Decrease the (low level) pollution (and seeded clouds), and more early morning solar radiation reaches the ground, causing earlier and higher minimum temperatures.
I still wonder how climate scientists have managed to stay in the dark ages enough to make linear projections of future trends. I really do think that a superior method invented in 1750 has had enough time to be accepted by even them with their very conservative thinking.
The most likely trend is the continuation of the best fit curve. Using this the whole business is irrelevant and climate scientists are all in the job centre queue.
In the sixties engineers told the scientists the precise figure for the temperature increase from clean air quality and also from the imperfections of the Stevenson screen in very clean air and sunshine. We were told in no uncertain terms to go back and fix our washing machines.
It’s interesting that the greatest increase was for winter sunshine. This correlates well with our experience. The nineties were noticeably warmer. But it wasn’t so much a matter of warmer summers, it was milder winters.
There’s another correlation. The sunshine peaked at around 2000, or just before, and then fell somewhat. CET shows Central England peaking at 2000, and then rapidly cooling, although the last two years have been milder.
Global temperatures also seem to correlate well with global sunshine amounts, for example both show the same pause for roughly the last two decades.
It does seem possible that the 20th century global warming may well have been caused by increased sushine/decreased clouds. The question is, what drives changes in sunshine? Of course, Svensmark believes he has the answer.
I’m not convinced that it’s strongly linked to pollution. But wouldn’t it be a wonderful irony if it turned out that the dreaded global warming was caused by environmentalism.
Happy Christmas to everyone at WUWT!
Chris
Sunshine hours is what is being measured and the instruments used to record this have changed completely over the term of the record.
At the start of the record It was quite a simple device but in recent decades a much more complex instrument is used, corrections and adjustments have had to be made to the record to ensure comparability. My understanding is that the adjustments are made to the recent record, but I could be wrong.
There is a high correlation between sunshine hours and max temperature, i.e. the warmest years on record are the sunniest years on record, the warmest month on record (July 2006) is the sunniest on record, the sunniest April on record is also the warmest April on record etc etc.
The Met Office paper you referenced to, John, shows a strong correlation between sunshine and both max and min temps for both spring and autumn, the very seasons which show the majority of Uk warming in the last 30 yrs, and also when sunshine hours have increased considerably.
I have done some analysis here which confirms this.
http://notalotofpeopleknowthat.wordpress.com/2014/12/24/increase-in-uk-temperatures-largely-due-to-increase-in-sunshine-hours-caused-by-reduced-pollution/#more-12049
“Theory tells us that, as CO2 increases in the atmosphere, temperatures should rise gradually and steadily.”
NO it doesnt tell you that at ALL.
Theory says.
1. IF you hold all other variables constant, then adding C02 to the atmosphere will eventually lead
to a warmer planet.
It doesnt tell you how much warmer
It doesnt tell you how this evolves over time
it doesnt tell you how the warming is distributed globally.
it doesnt tell what happens when other variables are not held constant.
None of which has the slightest relevance to the post.
Interesting that someone else has spotted something strange happening in the late 80’s. I have all relevant U.K. weather reporting stations data as supplied by the Met Office, and I am diligently working through each weather stations reports. I am graphing the Max and Minimum temps recorded for each year dating back to 1965. I am also graphing the number of air frost days for the same period. I also have the sunshine hour and total rainfall for each reporting station. From the stations plotted so far, each shows a cooling of the maximum recorded temperature and a lowering of the minimum temperatures. The graphs are also showing an increase in Air Frost from the mid 1980’s. As yet, I have not found ONE reporting station showing a trend in increasing of max temperature since the mid 1980’s, the trend is for cooling. Likewise, the trend for cooling is increasing which is matched by the increase in Air Frost days. I will work through sunshine hours and rainfall in due course.
That’s just crazy to think temperatures are related to the sun…lol!
For years I’ve thought that the clean air legislation in the 80s eventually resulted in such clear skies as, for example, to cause plants to flower earlier (more light exposure) and surface temperatures to rise.
The “Clean Air Act” came into force during 1950’s and was aimed at cleaning up the air pollution in cities and industrial areas. Any clean air legislation since then was basically tinkering with what had gone before. Certainly the “Act2 of the 1950’s worked as I lived through the significant changes to air quality in one city at least Birmingham. I’m sub plotting data from the 1950’s through to 1965, interesting to see these plots compared to the 1965 to 2014 plots.
Has increased sunshine caused UK warming in the late 20th Century? I do not see how, but what we certainly do know is that carbon dioxide has not been responsible, and we know this with certainty because carbon dioxide played no role in the Roman Warm Period or the Medieval Warm Period.
The sun shines 24 hours a day, 7 days a week, and 52 weeks a year. It has done so for 4.5 billion years. Warming in the UK has happened in the past, and it will happen in the future, just as cooling will also happen in the future just as it has in the past. Such events as as certain as death.
Stop worrying about things we should not be worrying about.
t h e
d i f f e r e n c e i s :
mild, but steady ‘pollution’: mild, time spread precipitations
v e r s u s
rare, heavy weather events:
/ catastrophic outbursts /
Regards – Hans