Eric Worrall writes: Mann’s thermometer spliced hockey stick has taken even more damage in the last few days, with Steve McIntyre helpfully providing reconstructions based on tree rings which demonstrate how, without the benefit of Mike’s scientifically dubious “nature trick”, the hockey stick simply disappears – tree rings demonstrably don’t correlate with temperature.

According to McIntyre;
The new information shows dramatic failure of the Sheep Mountain chronology as an out-of-sample temperature proxy, as it has a dramatic divergence from NH temperature since 1980, the end of the Mann et al (and many other) reconstructions. While the issue is very severe for the Mann reconstructions, it affects numerous other reconstructions, including PAGES2K.”
What is worse, in my opinion, is that Mann and Briffa can’t even claim they weren’t warned. As early as 1998, the very Russian Scientists who Briffa hired to collect the tree ring samples, tried to alert Briffa that the samples didn’t show what they wanted them to show. The difference is, the Russians weren’t measuring tree ring width, their favoured metric was the polar timberline – the northernmost edge of the great Arctic forests.
According to Rashit Hantemirov, of the Russian Academy of Science;
According to reconsructions most favorable conditions for tree growth
have been marked during 5000-1700 BC. At that time position of tree
line was far northward of recent one.
[Unfortunately, region of our research don’t include the whole area
where trees grew during the Holocene. We can maintain that before 1700
BC tree line was northward of our research area. We have only 3 dated
remnants of trees from Yuribey River sampled by our colleagues (70 km
to the north from recent polar tree line) that grew during 4200-4016
and 3330-2986 BC.]
This period is pointed out by low interannual variability of tree
growth and high trees abundance discontinued, however, by several
short (50-100 years) unfavorable periods, most significant of them
dated about 4060-3990 BC. Since about 2800 BC gradual worsening of
tree growth condition has begun. Significant shift of the polar tree
line to the south have been fixed between 1700 and 1600 BC. At the
same time interannual tree growth variability increased appreciably.
During last 3600 years most of reconstructed indices have been varying
not so very significant. Tree line has been shifting within 3-5 km
near recent one. Low abundance of trees has been fixed during
1410-1250 BC and 500-350 BC. Relatively high number of trees has been
noted during 750-1450 AD.
There are no evidences of moving polar timberline to the north during
last century.
Some of Mann’s own colleagues warned Mann about the unreliability of tree rings – this email from Tom Wigley, discussing how his son’s high school project falsified Mann’s research.
“Also, stationarity is the key. Let me tell you a story. A few years back, my son Eirik did a tree ring science fair project using trees behind NCAR. He found that widths correlated with both temp and precip. However, temp and precip also correlate. There is much other evidence that it is precip that is the driver, and that the temp/width correlation arises via the temp/precip correlation. Interestingly, the temp correlations are much more ephemeral, so the complexities conspire to make this linkage non stationary.”
On this occasion though, Keith Briffa decided to support his friend Mann with some helpful advice (from the same email as the Wigley quote) – Keith’s suggestion is that Mann could dismiss the relevance of previous warm periods being warmer than today, by spinning the suggestion that the current warm period is different, because it is anthropogenic;
“Mike there is often no benefit in bandying fine points of emphasis and implication- Hence , I think that what you have already drafted is fine. Do not start to dilute or confuse the issue with too much additional detail. The job , as you state , is to place on record the statement of disagreement with the “science(!)” and spin. To this end , it may also be worth stating in less couched terms that merely eyeballing the relative magnitudes of recent versus prior period(s) of large scale warmth, is in itself very limited as a basis for claiming the reality OR OTHERWISE of anthropogenic forcing of the recent warming , if this is done without reference to the uncertainty and causes of these differences. The points you make to Tom are of course very valid , but do not be tempted to guild the lily too much here – stick with your current content
Has any piece of scientific research ever been so thoroughly discredited? Tom Wigley’s son’s high school project falsified the hockey stick. The latest Sheep mountain study shows the hockey stick disappears, unless you use Mike’s trick of splicing in the thermometer record, to hide the divergence problem. The Russian scientists who collected the original tree ring samples, tried to warn Mann he was measuring the wrong metric. Yet somehow this nonsensical analysis became a central icon of the climate alarmist movement – and is still widely reproduced by the more scientifically illiterate alarmists.
Discover more from Watts Up With That?
Subscribe to get the latest posts sent to your email.
Who are you to question Mann’s authority? He is a Nobel Prize winner, after all, is he not?
Just like Ivan Gorchev. In The 14-Carat Roadster, I mean.
The statement ‘discussing how his son’s high school project falsified Mann’s research’ is sloppy.
It implies that the son’s research was somehow used to falsify or alter Mann’s results.
It would be better to say that the son’s project showed that Mann’s data was flawed, or based on a false premise.
“It would be better to say that the son’s project showed that Mann’s data was flawed”
It doesn’t even show that. The son cored some trees at NCAR, in Boulder Colo. That’s not Mann’s data. There’s a reason why Mann’s data comes from places like Yamal and Sheep Mtn, rather than somewhere more convenient like NCAR. It’s what they do to try to separate temperature effects. Of course in a place like Boulder, they won’t be separated.
The email discussion is quite interesting. Omitted here is the final para:
” I have not seen any papers in the literature demonstrating this — but, as you point out Mike, it is a crucial issue.”
It’s a serious discussion about stationarity assumptions.
Nick: I made my comment in order to highlight the use of poor English rather than enter a discussion as to what was or was not shown.
I notice the use of the term ‘stationarity’. Presumably this refers to the location or position of the trees. It could be that ‘stationarity’ appears in the American Webster’s dictionary, but it’s not in my Concise Oxford Dictionary here in the UK.
Why use words like this when the English language language contains other which immediately convey the correct meaning? I have an American general science textbook from the mid-1970s which is in excellent standard English, easily understood internationally.
Much as I admire a lot about America and its culture, the desire to invent unnecessary new words to replace existing ones has me puzzled, and at times irritated because the meaning is not clear!
Carbon500:
“I notice the use of the term ‘stationarity’. Presumably this refers to the location or position of the trees.”
No, it refers to the stability of random variable distributions over time, the random variables being the various proxy measurements of tree ring dimensions and such. Distributions are said to be strongly stationary if the distribution mean and variance do not vary over time. Or weakly stationary if the covariance does not vary over time.
The advantage in assuming stationarity is that such systems can be characterized by simple linear, time-invariant operators.
http://en.wikipedia.org/wiki/LTI_system_theory
The disadvantage is that “interesting” systems (e.g. climate) are usually not stationary in the strong sense.
So compromises are made, assuming weakly stationary processes, synthesizing piece-wise stationarity. Also ‘cyclic’ stationarity is useful for analysis and modeling.
http://en.wikipedia.org/wiki/Stationary_process
http://en.wikipedia.org/wiki/Cyclostationary_process
Carbon, most real scientists and engineers still use standard English as they have no need of the obfuscation and misdirection that others create new words to accomplish. (Written as an engineer who is in no way, shape, manner or form a proper user of the English language… according to every English teacher who ever attempted to teach me.)
Carbon 500 says; “… in order to highlight the use of poor English…”
I bet you meant “… the poor use of English…”
Johanus
“No, it refers to the stability of random variable distributions over time, the random variables being the various proxy measurements of tree ring dimensions and such. Distributions are said to be strongly stationary if the distribution mean and variance do not vary over time. Or weakly stationary if the covariance does not vary over time.
The advantage in assuming stationarity is that such systems can be characterized by simple linear, time-invariant operators.”
But does not one first have to prove, or at least assume, that the “random” variables are independent? Salzer et al collected to cores from each of four very close growing trees at four different elevations. It is obvious that, at best, they had only sixteen independent tree width readings. Although they have thirty-two cores, there are only eight North facing and eight South facing trees. As the authors themselves very honestly wrote “We recognize this is a small number of trees that is approaching the lower limit of sample replication that should be averaged in mean time series and processed in dendroclimatic analyses. While the time series statistics suggest a strong common signal (table 1), for future research and subsequent analyses we recommend sampling more trees.”
Because of thIs lack of data and in order to obtain their 95% confidence limits the authors resorted to “bootstrapping”, a process that is only valid if it is first proved that each reading are independent and that there is no serial correlation.
I believe that the authors should have placed more emphasis on the word “suggest”, particularly since for the last fifteen years North facing and the South facing showed significantly different results.
Solomon Green:
“But does not one first have to prove, or at least assume, that the “random” variables are independent? “
Not really. The only thing that has to be “proved” is the skill of the model. If it explains or predicts everything as it should, then its allegiance to ideal technical assumptions is moot. Because these technical ideals (linearity etc) don’t exist in the real word in a pure form anyway.
Anyway, the measurements taken from these four trees, closely collocated, will probably be imprinted with common meteorological and climatological patterns on a synoptic scale and larger. Also we’re looking for a common signal from the CO2 density. So there’s a lot of built-in dependencies.
The skill of model is the bottom line. Period. Doesn’t really matter how it was created, as long as it reliably predicts or explains itsad-hoc model of the world.
I’d like to thank everyone who’s responded to my comments about the use of English, I’ve enjoyed reading your varied views and input very much. Clearly my well-thumbed mid-1970s copy of ‘Mathematics for Scientific and Technical Students’ by H.G. Davies and G.A. Hicks is not enough to ‘cover all the bases’ as the saying goes!
I disagree with the quibbles about this post. The post is an opinion piece that tries to tell the common man about this important new development in the “hockey stick” story.
The “hockey stick” graph did galvanize political action across the industrialized world and led to much higher energy costs, less industrial productivity, increased poverty, and the deaths of many people in the winter due to these factors. This “hockey sticky” con game needs to be talked about at the level that the common person can understand and then relate to friends and relatives.
I realize that Steve McIntyre has a much more technical (and technically correct) take on this issue, but he loses me sometimes and I have been guilty of teaching statistics before. So, let us remember that the appropriate level at which to teach or impart information depends on many factors (like age, ability, preparation, and so on).
It is important to remember that opinion pieces play an important role on this web site and that many readers are not professional data manipulators. (I tried to flip my checking account data upside down but my bank was not amused for some reason)
For the above reasons (and more) I say good job Eric Worrall.
What markstoval said.
I have nothing but admiration for Mr. McIntyre’s persistence and analytic ability, and the world owes him a lot. But his writing is frustrating, and I almost never have the time to run down all the acronyms, allusions, and terms of art necessary to comprehend his posts fully. Mr. Worrall is to be thanked for attempting to convey Mr. McIntyre’s work to a wider audience, and we would all be much better informed if Mr. McIntyre could collaborate with someone like Mr. Worrall to translate all of his posts into English.
+1 to that. I hope Eric isn’t put off contributing. I am an expert in my particular field of engineering, and I often try to help others for free on forums. Today, I posted a lengthy, helpful piece, which took up a part of my restful Sunday. The piece received a snide comment from a peer who isn’t as knowledgeable as myself (from what he wrote). It just makes you want to give up helping, because you think, what’s the point? I often get to the point where I will never contribute to any forum, because people can be such $hits.
Steve McIntyre actually is better than average in his scientific writing, with very few glitches. There are quite a few others who do need the collaboration you call for, but it wouldn’t hurt for Steve to have someone give his posts a quick looking-over for clarity, as well.
Malfeasance by proxy?
I really couldn’t care less who did what and how and by how many. When, where it [man made warming from CO2] became a problem is, when Governments started to use my money [taxes] to prove a myth [CAGW]. Penn State et al, UEA[CRU], the Met Office – if you swallow up public funds then you are on the payroll – Goddammit: should we not at least expect some, even a glimmer of objectivity?
The alarmist cabal and particularly certain individuals, are so cocksure of themselves, so right – always and will brook with no arguments. With straight faces and all sense of humour bypassed, shouting, “the science is settled” they piously exclaim but how is any of this ‘science’ – this is Art and the black arts at that.
Most good scientists, even some of his crony conspirators now deem him a leg iron, a pariah if you like.
But because, in political circles were it not for some very red faces and attempts to save face and with a president who does not listen to anybody – ever. With a corporate blob and noted investment banks, the green megalomaniacs are baying for new emissions targets, the man made warming myth is [has to be] perpetuated. Thus, the media and Washington [Westminster/EU/UN in cahoots too] bubble close ranks and certain individuals remain bullet proof. A cynic may suggest, “man, it’s a good job he ain’t a representative of the Tea Party”.
And a man would, should be presently seeking new employers, if……… anybody would have him.
Here is something from the paper.
See the Sheep Mountain divergence from the Hockey Stick (North and South faces)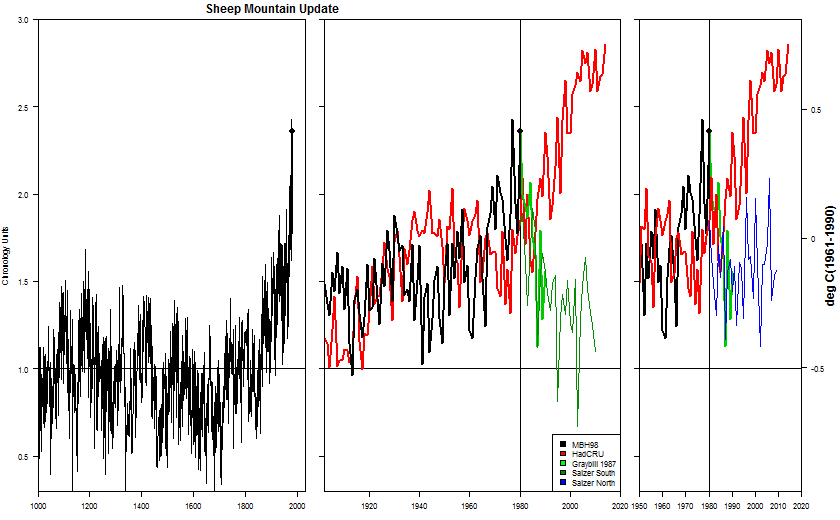
Of course Mann’s cut off in 1980 but since then the world warmed. Chuck the tree rings.
Herbaceous plants such as crops and flowers are sensitive to temperature and other variables, but trees not nearly as much. Trees are used to dramatic and sudden temperature shifts and like most plants are photothermoperiodic. It’s obvious to those working in those areas whether or not they’ve had basic plant science. While several factors may affect tree growth(and tree rings), assuming temp’s are withing normal bounds that trees easily handle and mineral availability hasn’t suddenly changed(no reason for sudden changes), the primary limiting factor will be moisture. Mann should’ve known that and probably did.
Also, some tree families are very sensitive to moisture conditions and it’s availability and develop vascular disease such as anthracnose, especially those in the maple family(Acer). Verticillium wilt causes massive damage to the vascular tissue and that is apparent when tree rings are studied. The rings are hardly a proxy for temperature and limiting factors and disease are apparent upon close examination. When moisture sensitive disease or stress is dominant, other variables have important parts to play, such as a hot year that intensifies the condition. And when some trees are stressed or diseased, moisture uptake for respiration will be diminished.
I think it`s fine Jimbo to get a constructive discussion of tree rings and temperature. Could it be a proposal to get a serious presentation of tree rings and temperatures from a scientist who know the difficulties with making proxies.
This is turning out to be a real tree-ring circus. The star of the show is our favorite clown, Dr. Michael Mann. He sure makes me laugh.
From WUWT sept 17. “…scientists are putting the growth acceleration down to rising temperatures and the extended growing season. Carbon dioxide (CO2) and nitrogen are other factors contributing to the faster growth.”
Piltdown Mann.
The Piltdown analogy deserves explication for the newcomers.
In the late 19th, the science of “evolution” was hotly debated. It was assumed that if the science were correct, samples of ancient animals of “transitional form” would sooner or later be dug up. A sample was produced from a region called “Piltdown” that possessed jaws and fangs similar to an ape’s, but a large skull similar to a human’s. This sample was widely hailed as proof of evolution. Some critics argued the sample was fraudulent, “spliced together” (so to speak) from the pieces of two different specimens. Supporters, over time, argued variously that (1) the producers of the Piltdown sample were all honorable men, would never make mistakes of this sort, and certainly would not knowingly “splice” samples; (2) other researchers in other regions and with other species had ALSO found “transitional fossils”, therefore, since these replicated the Piltdown sample’s general role in the argument, and since these OTHER fossils were genuine and uncriticized, THEREFORE Piltdown fossils should also be regarded as genuine; (3) many of the critics were unscientific, even religiously biased against the whole concept of evolution, and therefore their critiques should be rejected without any consideration at all (4) EVEN IF the Piltdown samples were fraudulent, “evolution” was true.
Eventually the Piltdown Man sample was revealed to conform to a pattern later summarily applied to Michael Mann’s work: “Method Wrong + Answer Correct = Bad Science.”
Personally I would not be upset if the word wrong were considered synonymous with “fraudulent”.
I also note that while “Evolution” as science is settled, the political consequences of assuming “something must be done” because of the “looming catastrophe” implied by that science resulted in the Nazi Holocaust –among other enormities– sprung from the minds of eugenicists, phrenologists and tribalists rallied under the banner of “science”.
When actual fossils of transitional apes were found, they proved to be the opposite of the fraud. Australopithecus, discovered in South Africa in 1924, had the brain capacity of a chimp but walked upright.
Did Australopithecus walk upright? Richmond and Strait (Nature 404:382–5 Jan., 2000) reported that Australopithecus was a knuckle walker, not bipedal. This calls into question whether Australopithecus was a transitional ape, or just an ape.
SR
All fossils, all species, are transitional.
He has also been called “Siltdown Mann” for his persistent upside down use of the “Tiljander sediment” proxy, documented here by Steve McIntyre:
http://climateaudit.org/2008/10/02/its-saturday-night-live/
As I recall, the term was coined by Steve Mosher:
http://judithcurry.com/2011/06/22/sea-level-hockey-stick/
And the results are not claire cut. Other studies (from Canada) show ftree growth decline with more warming.
“Our results show an unexpected widespread tree growth decline in temperate and boreal forests due to warming induced stress but are also suggestive of additional stressors. Rising atmospheric CO2 levels during the past century resulted in consistent increases in water use efficiency, but this did not prevent growth decline. These findings challenge current predictions of increasing terrestrial carbon stocks under climate change scenarios”
From: Recent Widespread Tree Growth Decline Despite Increasing Atmospheric CO2
Lucas C. R. Silva, Madhur Anand, Mark D. Leithead ,2010
I agree. There are a number of variables affecting growth and most species have a preferred zone/region/climate. Although daily/seasonal temp changes are something they’re adapted to, climatic shifts meaning temp/moisture changes outside of their normal bounds may become a limiting factor. Limiting factors can change over time and once stressed some species are slow to recover and may not. Trees of the same species in a lot or area that adapt better could become the survivors and repopulate.
Am wondering….many species in temperate and boreal forests are evergreens which means they are transpiring water all year. It’s possible that during Winters that are warmer the moisture loss is increased and the evergreens have a limited ability to slow that down by closing stomata which may lead to stress and tree rings may reveal that. Trees are grand water pumps, esp the Redwoods and Sequoias pumping many thousands of gallons per day up hundreds of feet and out into the atmosphere.
I would think that it is good reasons to be more sceptic to tree rings proxies after 1960. With more acis rain, more pollutions and increased co2 ( with greater stressors), the data is far more difficult to interpret. The greatest problem with Mann`s presentation is perhaps his smoothing of temperatures in the LIA period.
Steve’s objection – ” Steve McIntyre December 6, 2014 at 10:02 pm” came immediately after my comment and I make no apology for what I said. I am sick and tired of the Mannian antics, withholding data, stalling and hiding behind tactical law suits, the labelling of good people and scientists who dare to question Mann’s confection dished up as serious science.
I just want this farce ended and Mann to feel the way that some of us do, having been ill treated, mocked in a drawn out wasteful process, a process, that does nothing to help those of us that are trying to do our best to improve the lot of those countries and people less fortunate in economic terms.
My comment was a personal plea. Mann could have ended this farce shortly after the CRU emails became public, the ball was in his court and for me he can for ever remain in that court as the jester or village idiot.
I appreciate that Steve’s meticulous work is the ideal and proper way to unravel the mess of Mann and I applaud him for that dedication and purpose. It remains to be seen how academia..politicians and the media will respond and recognise his brilliant dissection of data and deduction.
But the IPCC remains in place and there are determined people involved in framing this debate for political purposes and they do not give a damn for truth, for them propaganda spin and lies are the way to achieve an agenda.
I am personally tired of the nonsense and the damage to science and scientists.
When this whole saga is over perhaps we will look back and in time realise that underneath all the shenanigans there has been real progress in unravelling the mysteries of climate, so many fine minds looking at the issues! B,ut for the good of all, this faux “battle” should have been over years ago had the media done its job and agenda put aside.
Thanks Eric for your articles they are speeding up the process as ordinary people look and decide for themselves.
Right on, KenB. This is wearying.
I agree with you Ken, as is apparent from my response to your earlier post.
Christopher Booker, in the Telegraph, has written an article on the politics of declaring 2014, the ‘hottest’ year on record, and the need to promote this to kepp the gravy train rolling on. See:
http://www.telegraph.co.uk/comment/11277024/Billions-wont-satisfy-warmists.html
Mann obviously knew from the divergence issue, that (i) trees are not a good proxy for temperature, and/or (ii) that the temperature record post 1960 was wrong, possibly due to contamination by UHI, station drop outs or corruption caused by incorrect adjustments/homogenisation; and/or (iii), that the divergence is a combination of (i) and (ii). That must be an inescapable conclussion of his work, since it is not that he was unaware of the divergence issue. .
What is not often commented upon is that in the tuning process, Mann must have tried many different tuning scenarios, and would have gone with the one that best fitted his pre-conceptions, ie., the one, for whatever personal reasons he considered to be the most appropriate. But the fact that different tunings would have resulted in significantly different results only goes to confirm that trees are not good proxies for temperature. He must have realised that from his work on the tuning process.
Why other scientists are not calling him out, and are not pressing for the record to be corrected is truly shameful, and in the long run there will be severe negative consequences to their turning of a blind eye.
Other scientists have reviewed his work. The National Academy of Sciences reviewed the data and concluded:
“The basic conclusion of Mann et al. (1998, 1999) was that the late 20th century
warmth in the Northern Hemisphere was unprecedented during at least the last 1,000
years. This conclusion has subsequently been supported by an array of evidence that
includes both additional large-scale surface temperature reconstructions and pronounced
changes in a variety of local proxy indicators, such as melting on ice caps and the retreat of glaciers around the world, which in many cases appear to be unprecedented during at least the last 2,000 years.”
http://www.nap.edu/catalog/11676/surface-temperature-reconstructions-for-the-last-2000-years
If you want to publish a peer-reviewed paper that refutes their analysis I encourage you to do so. Until then, I will trust the opinion of a dozen PhD climate scientists over a high-school project and a few bloggers.
Luke’s an ijut, guys. They’re a naturally occurring phenomena.
Streetcred
I see no reason for your unsubstantiated and unsolicited insult to “ijuts”.
Richard
The tree line evidence is damning, final, conclusive, and loud. Mann will just scream louder. Spread this around as much as you can.
And I shall say it again.
If tree-rings do not measure climate, via world or regional temperatures, then none of dendrochronology can work either. This was my WUWT post, back in 2011.
http://wattsupwiththat.com/2011/11/23/john-l-dalys-message-to-mike-mann-and-the-team/#comment-806171
If trees within one small region (Yamal) have such different tree-ring profiles, there is absolutely no chance that you can measure a ship’s beams from Scandinavia or Italy, and compare them with a reference tree growing in Ireland or California. Dendrochronology is pseudo-science at its best.
Ralph
Instead of all the handwaving above maybe someone (s) should be writing to NATURE( with the proof) to withdraw all of Mann’s work or at least retract
arthur4563 December 6, 2014 at 7:55 pm
The big question is why on earth anyone would think that temperature, rather than moisture, was the major determinant of tree ring growth. Any farmer could have told him he was nuts.
_______________________________________
No, no. no, you are wrong. Can you not see how vibrantly trees grow, in hot climates……
http://ppcdn.500px.org/66122447/2173e97105bc8ea47e502e4ef124eced7df88f57/2048.jpg
/sarc
Ralph
OT but surely this snow cover is way way above normal for Autumm NH 2014
http://arctic.atmos.uiuc.edu/cryosphere/
The albedo effect could be devastating (or is it just normal)? On the side it actually looks like at half of the NH is white!! I shiver to think what your winter will be like if this stuff remains there and actually expands more!
It’s still going to be the hottest year evaaaaaah!
The killer blow is when you read Email 1553 which is Briffa forwarding it to our mate Harry.
http://www.ecowho.com/foia.php?file=1553.txt
“date: Mon Oct 12 12:10:26 1998
from: Keith Briffa
subject: copy to a safe place!!and leave original there
to: i.Harris@uea”
Shows that They did not want the email to get circulated.
I have to say that I’m a bit disappointed that falsification was left to a high school project and then ignored. Not only “where was the media?,” but “where were the scientists skeptic or otherwise that should have been looking to test the data and conclusions”? Seems to this non-scientist that they might and should have come up with something similar. It was probably even Mann’s responsibility to test his pet before publication. Oh yeah. I forgot. He’s not a scientist, he just pretends to be a Nobel winning one in court.
How, in the name of science, does something this false and so openly inviting suspicion by being obviously motivated by opinion. escape appropriate scrutiny in the first place and then get so far? “Tree ring circus” indeed.
Would any arborists care to comment on the effect of increasing CO2 in the atmosphere on tree rings while keeping temperature and hydrology constant? I would think that it would increase the ring width, but that is a wag.
I’m only a horticulturalist, which includes forestry, plant sciences, etc., but will take a stab at it. All things remaining constant, which is impossible, but for sake of argument, increased CO2 will enhance tree growth, although that won’t be constant among all species. So, it’s possible the increased growth could reflect in tree ring analysis.
I’m an arborist of some 15 years of tree work, and before that I was an orchardist of 15 years of experience in Israel. I raised most stone fruits, apples & pears, walnuts, pistachios and persimmons. The reason for so growing so many species is because our area of the Judean Mountains has an unusual climate and soils and no one was really too sure of what would grow up here. Anyway, In these parts we get no rain whatsoever between April and November so we’re completely beholden to drip irrigation and fertilization via the drip system. When I heard that the Alarmists were correlating tree rings to temperature for a whole year it was such a silly notion to me that I was chortling inwardly for nearly a day of hearing of it. Truth be told that plants and trees need a number of inputs to grow. Among them are water, heat, primary fertilizer elements (N, P & K) along with trace metals such as iron, copper, zinc, boron, magnesium, etc, and sunlight. Changing any one of those inputs will cause greater or lesser growth. Water, either too little or too much, will cause changes in the rate of growth. Temperature increases the metabolic processes of plants, for sure, but if the other inputs are lacking temperature will not be the limiting factor. More or less fertilizer will also influence the width of tree rings.More or less sunlight will also influence the rate of growth. As a farmer here I had control over water & fertilizer as inputs and it’s impressive how much tree growth is influenced by just those 2 factors. In the wild trees may be affected by both grazing animals, such as goats, which can climb into trees and perform a crude pruning that can spur growth OR goats can wreak such destruction that the tree is seriously damaged and that will retard growth. In the wild nearby trees die and rot which will provide fertilizer elements for younger trees so to assume constant inputs of fertilizer is absurd. Grazing animals foraging around trees (assuming that they are sheep or horses which don’t do any damage) will fertilize the area and boost tree growth. And when it comes to tree rings the assumption is that there will only be one ring per year. This last assumption is a far cry from reality, as trees definitely develop new rings after a period of dormancy, but dormancy is not limited to just a winter sleep. Even deciduous trees can go dormant when a drought forces them to drop their leaves in a bid to conserve water, I’ve seen deciduous trees do that here when a homeowner gives barely enough water to their fruit trees in their yard and then a a serious hot spell overtakes us. When the rains or drip irrigation is restored the trees will wake up again and have a growth spurt, and that will produce another tree ring. So it can not be stated with certainty that there’s only one growth ring per year. In sum, to assume that tree growth, expressed in the width of rings, is due only to temperature is one of the silliest notions I’ve ever heard in 30 years of working with trees.
But no one is suggesting that temperature is the only factor affecting the width of tree rings. Read the literature and then post an informed comment.
Dale,
You forgot co2!
I like the bit where you point out
There is so much that can go wrong. I hear the White Mountains of California (bristlecone pine country) also has herds of Bighorn Sheep, mule deer, marmots and feral horses. I also hear that Bighorn sheep live in large flocks. Take from that what you will.
http://dwiki.csbs.utah.edu/PDFs/broughton_and_grayson_qr_93.pdf
http://www.sciencedirect.com/science/article/pii/S0305440383710204
I found this comment interesting, so Luke, besides being a prat, what are your other qualifications?
Dale
I would tend to agree with your observations. In Spain where I am, we have had only a few days of modest rain between January and mid October, it is precipitation more than anything else that determines tree growth where trees are not growing on the extreme of habitat survival conditions.
In my back garden, I have many trees of similarly age (I have seen them growing since small sapplings) and their size, height, girth, how straight they grow, their canopy etc varies enormously although they are sunject tio the same temperatures, but some are in shaddow of other tres at key times of the day, or get little rainfall since they are in shaddow of other trees, or are subject to prevailing winds whereas other are sheltered from prevailing winds etc.
Had Mann actually watched trees grow, or performed some experiment to see how temperature dependent growth is, he may well have had a very different take on the suitability of tree rings as an acceptable proxy for temperature. .
Thanks Dale Baranowski. I have been waiting for a long time for someone to post the suggestion that more than one tree ring a year can occur. Despite Luke’s posts below I do not remember seeing any other dendrologist making this point.
I farmed fruit in a similar climate for some years. I remember one row of citrus that contained a tree which grew at almost twice the rate of all the adjacent trees from the same batch that had been planed at the same time. It turned out that this particular tree had been planted over the carcase of the donkey, which had towed the cart carrying the saplings and which had died of a heart attack during the planting. The duration of the excess growth did not appear to extend much beyond ten years.
So far as I have seen in the literature, as applied by climate dendro-climatologists, none of the points that you have made are adequately covered, if covered at all.
I have talked to a number of dendrochronologists and have observed them analyzing and quantifying their data. They have known for years that trees occasionally produce two rings/year or may even skip years. These guys (and gals) know what they are doing, none of the objections listed here call into question the conistent pattern of rapid warming in the past 150 years observed in many different kinds of proxy data.
Looking at metrics like the northern tree-line to try to reconstruct the temperature history of the Holocene is actually incredibly interesting. Sad that it’s bogged down in such bitter politics.
We can all say that Michael Mann is a serial fraudster, without fear now, as real science and real data has shown him to be a liar.
Let’s get real folks. The National Academy of Sciences reviewed the data that Mann and others used to reconstruct temperature records over the past 2,000 years. This is their conclusion re Mann et al.’s work:
“The basic conclusion of Mann et al. (1998, 1999) was that the late 20th century
warmth in the Northern Hemisphere was unprecedented during at least the last 1,000
years. This conclusion has subsequently been supported by an array of evidence that
includes both additional large-scale surface temperature reconstructions and pronounced
changes in a variety of local proxy indicators, such as melting on ice caps and
the retreat of glaciers around the world, which in many cases appear to be unprecedented
during at least the last 2,000 years.”
John R. Christy was a coauthor on that report (url is below). I trust the opinion of a dozen climate scientists over the report of one high-school student.
http://www.nap.edu/catalog/11676/surface-temperature-reconstructions-for-the-last-2000-years
Luke, you say the NAS reviewed Mann’s data and then you give us a quote, but the quote doesn’t say “we checked out his data and they’re good” it says “a bunch of other people with unrelated data think there’s been exceptional warmth, too”.
The data sets Mann et al. used in their study were included in the reanalysis.
Re-using data does not constitute a review of the data.
Wahl and Ammann did a thorough review of Mann et al. in 2007. Here is their abstract:
Abstract The Mann et al. (1998) Northern Hemisphere annual temperature reconstruction
over 1400–1980 is examined in light of recent criticisms concerning the nature and processing
of included climate proxy data. A systematic sequence of analyses is presented that
examine issues concerning the proxy evidence, utilizing both indirect analyses via exclusion
of proxies and processing steps subject to criticism, and direct analyses of principal component
(PC) processing methods in question. Altogether new reconstructions over 1400–1980
are developed in both the indirect and direct analyses, which demonstrate that the Mann et
al. reconstruction is robust against the proxy-based criticisms addressed. In particular, reconstructed
hemispheric temperatures are demonstrated to be largely unaffected by the use
or non-use of PCs to summarize proxy evidence from the data-rich North American region.
When proxy PCs are employed, neither the time period used to “center” the data before PC
calculation nor the way the PC calculations are performed significantly affects the results,
as long as the full extent of the climate information actually in the proxy data is represented
by the PC time series. Clear convergence of the resulting climate reconstructions is a strong
indicator for achieving this criterion. Also, recent “corrections” to the Mann et al. reconstruction
that suggest 15th century temperatures could have been as high as those of the late-20th
century are shown to be without statistical and climatological merit. Our examination does
suggest that a slight modification to the original Mann et al. reconstruction is justifiable for
the first half of the 15th century (∼+0.05–0.10◦), which leaves entirely unaltered the primary
conclusion of Mann et al. (as well as many other reconstructions) that both the 20th century
upward trend and high late-20th century hemispheric surface temperatures are anomalous over at least the last 600 years. Our results are also used to evaluate the separate criticism of
reduced amplitude in the Mann et al. reconstructions over significant portions of 1400–1900,
in relation to some other climate reconstructions and model-based examinations. We find
that, from the perspective of the proxy data themselves, such losses probably exist, but they
may be smaller than those reported in other recent work.
and the link:
file:///C:/Users/Owner/Documents/Downloads/09e4150ba3067d285f000000.pdf
Luke, was the report checked by statisticians? Was it peer reviewed? The Hokey Schtick is dead.
Yes it was peer-reviewed and some of the best stasticians in the world contributed. Take a look.
This free PDF was downloaded from:
http://www.nap.edu/catalog/11676.html
Luke,
Thanks, but I see a book! Can you point me to the relevant sections?
Luke,
I started at the Summary and found this.
Some of this is not surprising when you consider that much of the Climastrology research public funds tends to be unprecedented!
Luke, I also read
Some of the claims in that publication are challenged on an ongoing basis by newer and OLDER research too! It has been 8 years since 2006 and as you know people are still researching and looking and bringing in papers that the publication may have missed as well as new findings.
Medieval Warm Period (Antarctica) — Summary
Hall et al. (2010), Lu et al. (2012), Bertler et al. (2011), Hall et al. (2006), Williams et al. (2007), Hall (2007)…..
http://www.co2science.org/subject/m/summaries/mwpantarctica.php
WUWT posted it up too.
http://wattsupwiththat.com/2013/04/11/evidence-for-a-global-medieval-warm-period/
Mann insists that the Medieval Warm Period was regional in the NH. The top link above suggest otherwise.
How do you thing figs grew in Germany in the Medieval time? That is what Michael Mann used as a reference below.
Mann:
“Some of the most dramatic evidence for Medieval warmth has been argued to come from Iceland and Greenland (see Ogilvie, 1991). In Greenland, the Norse settlers, arriving around AD 1000, maintained a settlement, raising dairy cattle and sheep. Greenland existed, in effect, as a thriving European colony for several centuries. While a deteriorating climate and the onset of the Little Ice Age are broadly blamed for the demise of these settlements around AD 1400,”
Moore et al (2001) says Baffin Island temperatures were highest during the last 1250 years from 1195-1220, at the same time Europe saw a sharp downturn in temperatures. While from the late 14th century the Arctic cooled strongly, but Europe became very warm, especially in 1375 when the most rapid Arctic cooling occurred in the Baffin Island lake samples. The late 10th century was also a very cold period for the mid latitudes.
So Mann does not seem to realise that the temperatures of the northern Temperate and Frigid zones move in opposition and not in unison. What a hoot!
It starts with the assumption that the warm period in GISP around 1000 AD was also warm in the mid latitudes. From that error, it is then assumed that all previous warm spikes in GISP were also warm in the mid latitudes, the most laughable being the Minoan Warp Period of ~1350-1150 BC. Which was the period of the demise of the Minoans and several other cultures.
How do they get away with such nonsense? Did they not even look at the history of the Minoans in Wikipedia?