Foreword by Anthony Watts
An essay by Monckton of Brenchley follows, but I wanted to bring this graphic from Dr. Mann’s recent Scientific American article to attention first. In the infamous “hide the decline” episode revealed by Climategate surrounding the modern day ending portion of the “hockey stick”, Mann has been accused of using “Mike’s Nature Trick” to hide the decline in modern (proxy) temperatures by adding on the surface record. In this case, the little white line from his SciAm graphic shows how “the pause” is labeled a “faux pause”, (a little play on words) and how the pause is elevated above past surface temperatures.
![earth-will-cross-the-climate-danger-threshold-by-2036_large[1]](http://wattsupwiththat.files.wordpress.com/2014/03/earth-will-cross-the-climate-danger-threshold-by-2036_large1.jpg)
Source: http://www.scientificamerican.com/sciam/assets/Image/articles/earth-will-cross-the-climate-danger-threshold-by-2036_large.jpg

Looking at the SciAm graphic (see zoom at right), something didn’t seem right, especially since there doesn’t seem to be any citation given for what the temperature dataset used was. And oddly, the graphic shows Mann’s little white line peaking significantly warmer that the 1998 super El Niño, and showing the current temperature equal to 1998, which doesn’t make any sense.
So, over the weekend I asked Willis Eschenbach to use his “graph digitizer” tool (which he has used before) to turn Mann’s little white line into numerical data, and he happily obliged.
Here is the result when Mann’s little white line is compared and matched to two well known surface temperature anomaly datasets:

What is most interesting is that Mann’s “white line” shows a notable difference during the “pause” from HadCRUT4 and GISS LOTI. Why would our modern era of “the pause” be the only place where a significant divergence exists? It’s like “hide the decline” deja vu.
The digitized Mann’s white line data is available here: Manns_white_line_digitized.(.xlsx)
As of this writing, we don’t know what dataset was used to create Mann’s white line of surface temperature anomaly, or the base period used. On the SciAm graphic it simply says “Source: Michael E. Mann” on the lower right.
It isn’t GISS land ocean temperature index (LOTI), that starts in 1880. And it doesn’t appear to be HadCRUT4 either. Maybe it is BEST but not using the data going back to 1750? But that isn’t likely either, since BEST pretty much matches the other datasets, and in Mann’s graphic above, which peaks out at above 1°C, none of those hit higher than 0.7°C. What’s up with that?
![land-and-ocean-other-results-1950-large[1]](http://wattsupwiththat.files.wordpress.com/2014/03/land-and-ocean-other-results-1950-large1.png)
Now compare that plot above to this portion Dr. Mann’s SciAm plot, noting the recent period of surface temperature and the 1°C reference line which I extended from the Y axis:

I’m reminded of Dr. Mann’s claims about climate skeptics in this video: http://www.linktv.org/video/9382/inside-the-climate-wars-a-conversation-with-michael-mann
At 4:20 in the video, Dr. Mann claims that US climate skeptics are part of the “greatest disinformation campaign ever run”. If his position is so strong and pure, why then do we see silly things like this graph given with an elevated ending of global surface temperature (in contrast to 5 other datasets) and not a single data source citation given?
UPDATE: Mark B writes in comments:
Looking at the SciAm graphic (see zoom at right), something didn’t seem right, especially since there doesn’t seem to be any citation given for what the temperature dataset used was. And oddly, the graphic shows Mann’s little white line peaking significantly warmer that the 1998 super El Niño, and showing the current temperature equal to 1998, which doesn’t make any sense.
Explanation of graph including links to source code and data were given here: http://www.scientificamerican.com/article/mann-why-global-warming-will-cross-a-dangerous-threshold-in-2036/
REPLY: Yes, I’ve seen that, but there is a discrepancy, the label on the image is “Historical Mean Annual Temperature” (white)
In http://www.scientificamerican.com/article/mann-why-global-warming-will-cross-a-dangerous-threshold-in-2036/ it is written:
Historical Simulations. The model was driven with estimated annual natural and anthropogenic forcing over the years A.D. 850 to 2012. Greenhouse radiative forcing was calculated using the approximation (ref. 8) FGHG = 5.35log(CO2e/280), where 280 parts per million (ppm) is the preindustrial CO2 level and CO2e is the “equivalent” anthropogenic CO2. We used the CO2 data from ref. 9, scaled to give CO2e values 20 percent larger than CO2 alone (for example, in 2009 CO2 was 380 ppm whereas CO2e was estimated at 455 ppm). Northern Hemisphere anthropogenic tropospheric aerosol forcing was not available for ref. 9 so was taken instead from ref. 2, with an increase in amplitude by 5 percent to accommodate a slightly larger indirect effect than in ref. 2, and a linear extrapolation of the original series (which ends in 1999) to extend though 2012.
“Historical Mean Annual Temperature” is NOT the same as “Historical Simulations” It looks to me like a bait and switch.
UPDATE2: Note the lead in text says “Global temperature rise…”
But in comments, Willis and Bill Illis have worked out that the white line represents only half the planet, the Northern Hemisphere. The white line is HadCRUT NH value, not global.
Obviously we can’t take such statements as the lead in text saying “global” at face value. Imagine if a climate skeptic made a graph like this. We’d be excoriated.
What needs to be done is to create a graph that shows what this would have looked like had Mann not cherry picked the NH and presented it on a graph with the text “Global temperature rise…”.
==============================================================
Mann’s ‘False Hope’ is false hype
By Christopher Monckton of Brenchley
The legendary Dr Walter Lewin, Professor of Physics at MIT, used to introduce his undergraduate courses by saying that every result in physics depended ultimately on measurement; that mass, distance, and time are its three fundamental physical units that every observation in these and all of their derivative units is subject to measurement uncertainty; and that every result in physics, if only for this reason, is to some degree uncertain.
Contrast this instinctual humility of the true physicist with the unbecoming and, on the evidence to date, unjustifiable self-assurance of the surprisingly small band of enthusiasts who have sought to tell us there is a “climate crisis”’. Not the least among these is Michael Mann, perpetrator of the Hokey-Stick graph that wrought the faux abolition of the medieval warm period.
In logic, every declarative statement is assigned a truth-value: 1 (or, in computer programs, –1) for true, 0 for false. Let us determine the truth-values of various assertions made by Mann, in a recent article entitled False Hope, published in the propaganda-sheet Scientific American.
Mann’s maunderings and meanderings will be in bold face, followed by what science actually says in Roman face, and the verdict: Truth-value 1, or truth-value 0?
Mann: “Global warming continues unabated.”
Science: Starting in Orwell’s Year (1984), and taking the mean of the five standard global temperature datasets since then, the rate of warming has changed as follows:
1979-1990 Aug 140 months +0.080 Cº/decade.
1979-2002 Apr 280 months +0.153 Cº/decade.
1979-2013 Dec 420 months +0.145 Cº/decade.
The slowdown in the global warming rate has arisen from the long pause, now 13 years 2 months in length on the mean of all five datasets (assuming that HadCRUT4, which is yet to report, shows a result similar to the drop in global temperatures reported by the other four datasets).
Verdict: Truth-value 0. Mann’s statement that global warming “continues unabated is false”, since the warming rate is declining.
Mann: “… during the past decade there was a slowing in the rate at which the earth’s average surface temperature had been increasing. The event is commonly referred to as “the pause,” but that is a misnomer: temperatures still rose, just not as fast as during the prior decade.”
Science: During the decade February 2005 to January 2014, on the mean of all five datasets, there was a warming of 0.01 Cº, statistically indistinguishable from zero.
Truth-value 0: Temperatures did not rise in any statistically significant sense, and the increase was within the measurement uncertainty in the datasets, so that we do not know there was any global warming at all over the decade. Here, Walter Lewin’s insistence on the importance of measurement uncertainty is well demonstrated.
Mann: “In response to the data, the IPCC in its September 2013 report lowered one aspect of its prediction for future warming.”
Science: In 2013 the IPCC reduced the lower bound of its 2007 equilibrium climate-sensitivity interval from 2 Cº to 1.5 Cº warming per CO2 doubling, the value that had prevailed in all previous Assessment Reports. It also reduced the entire interval of near-term projected warming from [0.4, 1.0] Cº to [0.3, 0.7] Cº. Furthermore, it abandoned its previous attempts at providing a central estimate of climate sensitivity.
Verdict: Truth value 0. The IPCC did not lower only “one aspect of its prediction for future warming” but several key aspects, abandoning the central prediction altogether.
Mann: If the world keeps burning fossil fuels at the current rate, it will cross a threshold into environmental ruin by 2036. The “faux pause” could buy the planet a few extra years beyond that date to reduce greenhouse gas emissions and avoid the crossover–but only a few.
Science: Mann is asserting that on the basis of some “calculations” he says he has done, the world will face “environmental ruin” by 2036 or not long thereafter. However, Mann has failed to admit any uncertainty in his “calculations” and consequently in his predictions.
Verdict: Truth-value 0. Given the ever-growing discrepancy between prediction and observation in the models, and Mann’s own disastrous record in erroneously abolishing the medieval warm period by questionable statistical prestidigitation, the uncertainty in his predictions is very large, and a true scientist would have said so.
Mann: “The dramatic nature of global warming captured world attention in 2001, when the IPCC published a graph that my co-authors and I devised, which became known as the ‘hockey stick’. The shaft of the stick, horizontal and sloping gently downward from left to right, indicated only modest changes in Northern Hemisphere temperature for almost 1,000 years–as far back as our data went.”
Science: The Hokey-Stick graph falsely eradicated both the medieval warm period and the little ice age. At co2science.org, Dr. Craig Idso maintains a database of more than 1000 papers demonstrating by measurement (rather than modeling) that the medieval warm period was real, was near-global, and was at least as warm as the present just about everywhere. McIntyre & McKitrick showed the graph to be erroneous, based on multiple failures of good statistical practice. The medieval warm period and the little ice age are well attested in archaeology, history, architecture, and art. It was the blatant nonsense of the Hokey Stick that awoke many to the fact that a small academic clique was peddling unsound politics, not sound science.
Verdict: Truth value 0. Once again, Mann fails to refer to the uncertainties in his reconstructions, and to the many independent studies that have found his methods false and his conclusions erroneous. Here, he takes a self-congratulatory, nakedly partisan stance that is as far from representing true science as it is possible to go.
Mann: “The upturned blade of the stick, at the right, indicated an abrupt and unprecedented rise since the mid-1800s.”
Science: The graph, by confining the analysis to the northern hemisphere, overstated 20th-century global warming by half. Mann says the rise in global temperatures, shown on the graph as 1.1 Cº over the 20th century, is “unprecedented”. However, the Central England Temperature Record, the world’s oldest, showed a rise of 0.9 Cº in the century from 1663 to 1762, almost entirely preceding the industrial revolution, compared with an observed rate of just 0.7 Cº over the 20th century. The CETR is a good proxy for global temperature change. In the 120 years to December 2013 it showed a warming rate within 0.01 Cº of the warming rate taken as the mean of the three global terrestrial datasets.
Verdict: Truth value 0. The warming of the 20th century was less than the warming for the late 17th to the late 18th centuries.

Mann: “The graph became a lightning rod in the climate change debate, and I, as a result, reluctantly became a public figure.”
Science: For “lightning-rod” read “laughing-stock”. For “reluctantly” read “enthusiastically”. For “public figure” read “vain and pompous charlatan who put the ‘Ass’ in ‘Assessment Report’”.
Verdict: Pass the sick-bucket, Alice.
Mann: “In its September 2013 report, the IPCC extended the stick back in time, concluding that the recent warming was likely unprecedented for at least 1400 years.”
Science: The IPCC is here at odds with the published scientific literature. In my expert review of the pre-final draft of the Fifth Assessment Report, I sent the IPCC a list of 450 papers in the reviewed literature that demonstrated the reality of the warm period. The IPCC studiously ignored it. Almost all of the 450 papers are unreferenced in the IPCC’s allegedly comprehensive review of the literature. I conducted a separate test using the IPCC’s own methods, by taking a reconstruction of sea-level change over the past 1000 years, from Grinsted et al. (2009), and comparing it with the schematic in the IPCC’s 1990 First Assessment Report showing the existence and prominence of both the medieval warm period and the little ice age. The two graphs are remarkably similar, indicating the possibility that the sea-level rise in the Middle Ages was caused by the warmer weather then, and that the fall in the Little Ice Age was caused by cooler weather. The sea-level reconstruction conspicuously does not follow a Hokey-Stick shape.

Verdict: Truth value 0. The IPCC has misrepresented the literature on this as on other aspects of climate science. There are of course uncertainties in any 1000-year reconstruction, but if Grinsted et al. have it right then perhaps Mann would care to explain how it was that sea level rose and fell by as much as 8 inches either side of today’s rather average value if there was no global warming or cooling to cause the change?
Mann: “Equilibrium climate sensitivity is shorthand for the amount of warming expected, given a particular fossil-fuel emissions scenario.”
Science: Equilibrium climate sensitivity is a measure of the global warming to be expected in 1000-3000 years’ time in response to a doubling of CO2 concentration, regardless of how that doubling came about. It has nothing to do with fossil-fuel emissions scenarios.
Truth value: 0. Mann may well be genuinely ignorant here (as elsewhere).
Mann: “Because the nature of these feedback factors is uncertain, the IPCC provides a range for ECS, rather than a single number. In the September report … the IPCC had lowered the bottom end of the range. … The IPCC based the lowered bound on one narrow line of evidence: the slowing of surface warming during the past decade – yes, the faux pause.”
Science: For well over a decade there has been no global warming at all. The pause is not faux, it is real, as Railroad Engineer Pachauri, the IPCC’s joke choice for climate-science chairman, has publicly admitted. And the absence of any global warming for up to a quarter of a century is not “one narrow line of evidence”: it is the heart of the entire debate. The warming that was predicted has not happened.
Verdict: Truth value 0. Mann is here at odds with the IPCC, which – for once – paid heed to the wisdom of its expert reviewers and explicitly abandoned the models, such as that of Mann, which have been consistent only in their relentless exaggeration of the global warming rate.
Mann: “Many climate scientists – myself included – think that a single decade is too brief to accurately measure global warming and that the IPCC was unduly influenced by this one, short-term number.”
Science: Overlooking the split infinitive, the IPCC was not “unduly influenced”: it was, at last, taking more account of evidence from the real world than of fictitious predictions from the vast but inept computer models that were the foundation of the climate scare. Nor was the IPCC depending upon “one short-term number”.
James Hansen of NASA projected 0.5 C°/decade global warming as his “business-as-usual” case in testimony before Congress in 1988. The IPCC’s 1990 First Assessment Report took Hansen’s 0.5 C°/decade as its upper bound. It projected 0.35 C°/decade as its mid-range estimate, and 0.3 C°/decade as its best estimate.
The pre-final draft of the 2013 Fifth Assessment Report projected 0.23 C°/decade as its mid-range estimate, but the published version reduced this value to just 0.13 C°/decade – little more than a quarter of Hansen’s original estimate of a quarter of a century previously.
Observed outturn has been 0.08 Cº/decade since 1901, 0.12 C°/decade since 1950, 0.14 C°/decade since 1990, and zero since the late 1990s.
Three-quarters of the “climate crisis” predicted just 24 years ago has not come to pass. The Fifth Assessment Report bases its near-term projections on a start-date of 2005. The visible divergence of the predicted and observed trends since then is remarkable.

It is still more remarkable how seldom in the scientific journals the growing discrepancy between prediction and observation is presented or discussed.
Verdict: Truth value 0. Step by inexorable step, the IPCC is being driven to abandon one extremist prediction after another, as real-world observation continues to fall a very long way short of what it had been predicting.
Mann: “The accumulated effect of volcanic eruptions during the past decade, including the Icelandic volcano with the impossible name, Eyjafjallajökull, may have had a greater cooling effect on the earth’s surface than has been accounted for in most climate model simulations. There was also a slight but measurable decrease in the sun’s output that was not taken into account in the IPCC’s simulations.”
Science: So the models failed to make proper allowance for, still less to predict, what actually happened in the real world.
Verdict: Truth value 0. Eyjafjallajökull caused much disruption, delaying me in the United States for a week (it’s an ill wind …), but it was a comparatively minor volcanic eruption whose signature in the temperature record cannot be readily distinguished from the la Niña cooling following the el Niño at the beginning of 2010. The discrepancy between models’ predictions and observed reality can no longer be as plausibly dismissed as this, and the IPCC knows it.
Mann: “In the latter half of the decade, La Niña conditions persisted in the eastern and central tropical Pacific, keeping global surface temperatures about 0.1 degree C colder than average …”
Science: There were La Niña (cooling) events in 1979, 1983, 1985, 1989, 1993, 1999, 2004, and 2008 – the only la Niña in the second half of the noughties. There were, however, two el Niño (warming) events: in 2007 and 2010.
Verdict: Truth value 0. There is very little basis in the observed record for what Mann says. He is looking for a pretext – any pretext – rather than facing the fact that the models have been programmed to exaggerate future global warming.
Mann: “Finally, one recent study suggests that incomplete sampling of Arctic temperatures led to underestimation of how much the globe actually warmed.”
Science: And that “study” has been debunked. The numerous attempts by meteorological agencies around the world to depress temperatures in the early 20th century to make the centennial warming rate seem larger than it is have far outweighed any failure to measure temperature change in one tiny region of the planet.
Verdict: Truth value 0. Increasingly, as the science collapses, the likes of Mann will resort in desperation to single studies, usually written by one or another of the remarkably small clique of bad scientists who have been driving this silly scare. Meanwhile, the vrai pause continues. As CO2 concentrations increase, the Pause will not be likely to continue indefinitely. But it is now clear that the rate at which the world will warm will be considerably less than the usual suspects have predicted.
Mann: “When all the forms of evidence are combined, they point to a most likely value for ECS that is close to three degrees C.”
Science: The IPCC has now become explicit about not being explicit about a central estimate of climate sensitivity. Given that two-thirds of Mann’s suggested 3 Cº value depends upon the operation over millennial timescales of temperature feedbacks that Mann himself admits are subject to enormous uncertainties; given that not one of the feedbacks can be directly measured or distinguished by any empirical method either from other feedbacks or from the forcings that triggered it; and given that non-radiative transports are woefully represented in the models, there is no legitimate scientific basis whatsoever for Mann’s conclusion that a 3 Cº climate sensitivity is correct.
Truth value: 0. What Mann is careful not to point out is that the IPCC imagines that only half of the warming from a doubling of CO2 concentration will arise in the next 200 years. The rest will only come through over 1000-3000 years. Now, at current emission rates a doubling of the pre-industrial 280 ppmv CO2 will not occur for 80 years. However, 0.9 Cº warming has already occurred since 1750, leaving only another 0.6 Cº warming to occur by 2280, on the assumption that all of the 0.9 Cº was manmade. And that is if Mann and the models are right.
Mann: “And as it turns out, the climate models the IPCC actually used in its Fifth Assessment Report imply an even higher value of 3.2 degrees C.”
Science: The 2007 Fourth Assessment Report said there would be 3.26 Cº warming at equilibrium after a CO2 doubling. But the 2013 Fifth Report said no such thing. It has fallen commendably silent.
Verdict: Truth value 0. Mann is, yet again, at odds with the IPCC, which has now begun to learn that caution is appropriate in the physical sciences.
Mann: “The IPCC’s lower bound for ECS, in other words, probably does not have much significance for future world climate–and neither does the faux pause.”
Science: This is pure wishful thinking on Mann’s part. In all Assessment Reports except the Fourth, the IPCC chose 1.5 Cº as its lower bound for equilibrium climate sensitivity to doubled CO2 concentration. In the Fourth it flirted briefly with 2 Cº, but abandoned that value when faced with the real-world evidence that Mann sneeringly dismisses as “the faux pause”.
Verdict: Truth value 0. Calling the vrai pause “the faux pause” is a faux pas.
Mann: “What would it mean if the actual equilibrium climate sensitivity were half a degree lower than previously thought? Would it change the risks presented by business-as-usual fossil-fuel burning? How quickly would the earth cross the critical threshold?”
Science: But what is the “critical threshold”? Mann fails to define it. Is there some value for global mean surface temperature that is the best of all temperatures in the best of all possible worlds? If so, Mann’s hypothesis can only be tested if he enlightens us on what that ideal temperature is. He does not do so.
Verdict: Truth value 0. In the absence of a clear and scientifically justified statement of an ideal temperature, plus a further justified statement that a given departure from that ideal temperature would be dangerous, there is no case for a “critical threshold”. Furthermore, there is at present little empirical basis for a global warming of more than 1 Cº over the coming century.
Mann: “Most scientists concur that two degrees C of warming above the temperature during preindustrial time would harm all sectors of civilization–food, water, health, land, national security, energy and economic prosperity.”
Science: No survey of scientists to determine whether they “concur” as to the 2 Cº above pre-industrial temperature that Mann considers on no evidence to be the “critical threshold” has been conducted. Even if such a survey had been conducted – and preferably conducted by someone less accident-prone than the absurd Cook and Nutticelli – that would tell us nothing about the scientific desirability or undesirability of such a “threshold”: for science is not done by consensus, though totalitarian politics is. And it was totalitarian politicians, not scientists, who determined the 2 Cº threshold, on no evidence, at one of the interminable paid holidays in exotic locations known as UN annual climate conferences.
Verdict: Truth value 0. There is no scientific basis for the 2 Cº threshold, and Mann does not really attempt to offer one.
Mann: “Although climate models have critics, they reflect our best ability to describe how the climate system works, based on physics, chemistry and biology.”
Science: Mann’s own model that contrived the Hokey-Stick graph shows what happens when a model is constructed with insufficient attention to considerations that might point against the modeler’s personal preconceptions. The model used a highly selective subset of the source data; it excluded hundreds of papers demonstrating the inconvenient truth that the medieval warm period existed; it gave almost 400 times as much weighting to datasets showing the medieval warm period as it did to datasets that did not show it; and the algorithm that drew the graph would draw Hokey Sticks even if random red noise rather than the real data were used. The problem with any model of a sufficiently complex object is that there are too many tunable parameters, so that the modeler can – perhaps unconsciously – predetermine the output. To make matters worse, intercomparison tends to institutionalize errors throughout all the models. Besides, since the climate behaves as a chaotic object, modeling its evolution beyond around ten days ahead is not possible. We can say (and without using a model) that if we add plant-food to the air it will be warmer than if we had not done so; but (with or without a model) we cannot say with any reliability how much warming is to be expected.
Verdict: Truth value 0. Models have their uses, but as predictors of long-term temperature trends they are, for well-understood reasons, valueless.
Mann: “And they [the models] have a proved track record: for example, the actual warming in recent years was accurately predicted by the models decades ago.”
Science: Here is Hansen’s 1988 prediction of how much global warming should have occurred since then, according to his “Giss Model E”.

The trend shown by Hansen is +0.5 Cº per decade. The outturn since 1988, however, was just 0.15 Cº per decade, less than one-third of what Hansen described as his “business-as-usual” case. Models’ projections have been consistently exaggerated:

Verdict: Truth value 0. The models have consistently and considerably exaggerated the warming of recent decades. The next graph shows a series of central projections, compared with the observed outturn to date, extrapolated to 2050. This is not a picture of successful climate prediction. It is on the basis of these failed predictions that almost the entire case for alarm about the climate is unsoundly founded.

Mann: “I ran the model again and again, for ECS values ranging from the IPCC’s lower bound (1.5 Cº) to its upper bound (4.5 Cº). The curves for an equilibrium climate sensitivity of 2.5 Cº and 3 Cº fit the instrument readings most closely. The curves for a substantially lower (1.5 Cº) and higher (4.5 Cº) sensitivity did not fit the recent instrumental record at all, reinforcing the notion that they are not realistic.”
Science: Legates et al. (2013) established that only 0.3% of abstracts of 11,944 climate science papers published in the 21 years 1991-2011 explicitly stated that we are responsible for more than half of the 0.69 Cº global warming of recent decades. Suppose that 0.33 Cº was our contribution to global warming since 1950, that CO2 concentration in that year was 305 ppmv and is now 398 ppmv. Then the radiative forcing from CO2 that contributed to that warming was 5.35 ln(398/305) = 1.42 Watts per square meter. Assuming that the IPCC’s central estimate of 713 ppmv CO2 by 2100 is accurate, the CO2 forcing from now to 2100 will be 5.35 ln(713/398), or 3.12 W m–2. On the assumption that the ratio of CO2 forcing to that from other greenhouse gases will remain broadly constant, and that temperature feedbacks will have exercised 44/31 of the multiplying effect seen to date, the manmade warming to be expected by 2100 on the basis of the 0.33 Cº warming since 1950 will be 3.12/1.42 x 0.33 x 44/31 = 1 Cº. Broadly speaking, the IPCC expects this century’s warming to be equivalent to that from a doubling of CO2 concentration. In that event, 1 Cº is the warming we should expect from a CO2 doubling, and the only sense in which the 1.5 Cº lower bound of the IPCC’s interval of climate-sensitivity estimates is “unrealistic” is that it is probably somewhat too high.
Verdict: Truth value 0. Here, as elsewhere, Mann appears unaware of the actual evolution of global temperatures during the post-1950 era when we might in theory have exercised some warming influence. There has been less warming than They thought, and – on the basis of the scientific consensus established by Legates et al. – less of the observe warming is anthropogenic than They thought they thought.
Mann: “To my wonder, I found that for an ECS of 3 Cº, our planet would cross the dangerous warming threshold of two degrees C in 2036, only 22 years from now. When I considered the lower ECS value of 2.5 Cº, the world would cross the threshold in 2046, just 10 years later.”
Science: Mann here perpetrates one of the fundamental errors of the climate-extremists. He assumes that the prediction of a climate model is subject to so little uncertainty that it constitutes a fact. This statement is one of a series by true-believers saying we have only x years to Save The Planet by shutting down the West. Ex-Prince Chazza has done it. Al Gore has done it. The UN did it big-time by saying in 2005 that there would be 50 million climate refugees by 2010. There weren’t.
Verdict: Truth value 0. Extreme warming that has been predicted does not become a fact unless it comes to pass. If you want my prediction, it won’t. And that’s a fact.
Mann: “So even if we accept a lower equilibrium climate sensitivity value, it hardly signals the end of global warming or even a pause. Instead it simply buys us a little bit of time – potentially valuable time – to prevent our planet from crossing the threshold.”
Science: No one is suggesting that the Pause will continue indefinitely. Theory as well as observation suggests otherwise. However, a Pause that has not occurred cannot “buy us a little bit of time”. Mann’s mention of “buying us a little bit of time” is, therefore, an admission that the Pause is real, as all of the temperature datasets show.
Verdict: Truth value 0. A low enough climate sensitivity will allow temperatures to remain stable for decades at a time, during periods when natural factors tending towards global cooling temporarily overwhelm the warming that would otherwise occur.
Mann: “These findings have implications for what we all must do to prevent disaster.”
Science: Warming of 3 Cº would not be a “disaster”. Even the bed-wetting Stern Review of 2006 concluded that warming of 3 Cº over the 21st century would cost as little as 0-3% of global GDP. But at present we are heading for more like 1 Cº. And even the IPCC has concluded that less than 2 Cº warming compared with 1750, which works out at 1.1 Cº compared with today, will be net-beneficial.
Verdict: Truth value 0. There is no rational basis for any suggestion that our adding CO2 to the atmosphere at the predicted rate, reaching 713 ppmv by 2100, will be anything other than beneficial.
Mann: “If we are to limit global warming to below two degrees C forever, we need to keep CO2 concentrations far below twice preindustrial levels, closer to 450 ppm. Ironically, if the world burns significantly less coal, that would lessen CO2 emissions but also reduce aerosols in the atmosphere that block the sun (such as sulfate particulates), so we would have to limit CO2 to below roughly 405 ppm. We are well on our way to surpassing these limits.”
Science: What we are concerned with is not CO2 simpliciter, but CO2-equivalent. CO2 itself contributes only 70% of the anthropogenic enhancement of the greenhouse effect. The (admittedly arbitrary) target of 450 ppmv CO2-equivalent is thus a target of only 315 ppmv CO2 – the concentration that prevailed in 1958. Mann’s suggested target of 405 ppmv CO2e would represent just 284 ppmv CO2. And that would fling us back to the pre-industrial CO2 concentration.
Verdict: Truth value 0. We are not “well on our way to surpassing these limits”: we passed them as soon as the industrial revolution began. The current CO2-equivalent concentration of 398 ppmv already exceeds the pre-industrial 284 ppmv by 40%, yet the world has warmed by only 0.9Cº since then, our contribution to that warming may well be 0.33 Cº or less.
Mann: “Some climate scientists, including James E. Hansen, former head of the NASA Goddard Institute for Space Studies, say we must also consider slower feedbacks such as changes in the continental ice sheets.”
Science: The IPCC already takes changes in ice-sheets into account. It says that in the absence of “dynamical ice flow” that cannot happen, the Greenland ice sheet would not disappear “for millennia”. And there is no prospect of losing ice from the vast ice sheet of East Antarctica, which is at too high an altitude or latitude to melt. Even the West Antarctic Ice Sheet, which has lost some ice, is proving more robust than the usual suspects had thought. Sea level, according to the GRACE gravitational anomaly satellites, has been falling (Peltier et al., 2009). During the eight years of ENVISAT’s operation, from 2004-2012, sea level rose at a scary 1.3 inches per century.
Verdict: Truth value 0. There is no reason to suppose the major ice sheets will disintegrate on timescales of less than millennia.
Mann: “Hansen and others maintain we need to get back down to the lower level of CO2 that existed during the mid-20th century–about 350 ppm.”
Science: 350 ppmv is, again, CO2-equivalent. That implies 245 ppmv, a value well below the pre-industrial 280 ppmv. At 180 ppmv, plants and trees become dangerously starved of CO2. Flinging CO2 concentration back to that value would reduce CO2 fertilization and hence crop yields drastically, and would do major damage to the rain-forests.
Mann: “In the Arctic, loss of sea ice and thawing permafrost are wreaking havoc on indigenous peoples and ecosystems.”
Science: The Arctic has not lost as much sea ice as had been thought. In the 1920s and 1930s there was probably less sea ice in the Arctic than there is today. The decline in sea ice is small in proportion to the seasonal variability, as the graph from the University of Illinois shows. And the part of the satellite record that is usually cited began in 1979. An earlier record, starting in 1973, showed a rapid growth in sea ice until it reached its peak extent in 1970. Indigenous peoples, like the polar bears, prefer warmer to colder weather. And almost all ecosystems also prefer warmer to colder weather.

Verdict: Truth value 0. The decline in sea ice in the Arctic is far more of a benefit than a loss.
Mann: “In low-lying island nations, land and freshwater are disappearing because of rising sea levels and erosion.”
Science: On the contrary, detailed studies show not only that low-lying island nations are not sinking beneath the waves, but that their territory is in many cases expanding. The reason is that corals grow to meet the light. As sea level rises, the corals grow and there is no net loss of territory. Also, sea level rises less in mid-ocean, where the islands are, than near the continental coasts. And sea level has scarcely been rising anyway. According to Grinsted et al., it was 8 inches higher in the medieval warm period than it is today.
Verdict: Truth value 0. If the world were once again to become as warm as it was in the Middle Ages, perhaps sea level would rise by about 8 inches. And that is all.
Mann: “Let us hope that a lower climate sensitivity of 2.5 degrees C turns out to be correct. If so, it offers cautious optimism. It provides encouragement that we can avert irreparable harm to our planet. That is, if–and only if–we accept the urgency of making a transition away from our reliance on fossil fuels for energy.”
Science: Mann is here suggesting that a climate sensitivity of 3 Cº would be disastrous, but that 2.5 Cº would not. The notion that as little as 0.5 Cº would make all the difference is almost as preposterous as the notion that climate sensitivity will prove to be as high as 2.5 Cº. As we have seen, on the assumption that less than half of the warming since 1950 was manmade, climate sensitivity could be as low as 1 Cº – a value that is increasingly finding support in the peer-reviewed literature.
Verdict: Truth value 0. The central error made by Mann and his ilk lies in their assumption that models’ predictions are as much a fact as observed reality. However, observed climate change has proven far less exciting in reality than the previous predictions of Mann and others had led us to expect. The multiple falsehoods and absurdities in his Scientific American article were made possible only by the sullen suppression by the Press of just how little of what has been predicted is happening in the real climate. In how many legacy news media have you seen the Pause reported at all? But it will not be possible for the mainstream organs of propaganda to conceal from their audiences forever the inconvenient truth that even the most recent, and much reduced, projections of the silly climate models are proving to be egregious exaggerations.
Whoa.
Whoa whoa whoa.
The effects of a CO2 doubling aren’t felt until 1000 years later?
So if we hit 520ppm we’ll in theory get 2.5°C of warming. But only 1.25°C will happen IN THE FIRST TWO HUNDRED YEARS???
Am I getting this right? Can anybody please confirm?
rgbatduke says:
March 24, 2014 at 7:48 pm
Um, well, no I didn’t — guilty as charged. Apologies for careless reading.
rgbatduke, I apologize if this sounds rude but debate me on the physics rather than a “made up” by your mind analogy as to how it works . Frankly I thought you missed the corresponding cooling by a country mile. I actually enjoy most of your posts.
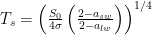

 is the mean surface temperature if there is no atmosphere at all (
 ). This is the practical maximum heating of a single layer atmosphere model, roughly 1.19 times the vacuum temperature.
OK, if you want the physics, perhaps you can invest in a copy of Grant Petty’s “A First Course in Atmospheric Radiation” and save me the trouble. Of course, I’m certain that (since you want to debate the physics) you already own a copy and have taken the time to learn quantum mechanics and quantum optics and classical electrodynamics and so on so that you understand the physics in this book pretty well. In which case, I’m sure you are familiar with section 6.4.3, Simple Radiative Models of the Atmosphere, in particular with the single layer, non-reflecting atmosphere that Petty walks you through, line by line, over the next four page, to arrive at a steady state surface temperature estimate of:
(Petty’s equation 6.37). This formula absolutely incorporates — explicitly — Kirchoff’s Law (absorptivity equals emissivity, which you seemed to want to state as molecules cool by as much as they heat as they absorb and emit photons, which is entirely irrelevant to the process). In this equation the short wavelength atmospheric absorptivity and long wavelength absorptivity are explicit parameters and as I noted symmetric, they are also used as the emissivity in the development of the formula.
In the simple limit of a perfectly transparent atmosphere in the visible light spectrum (short wave) and perfectly opaque atmosphere in the IR (long wave) spectrum, this expression simplifies to:
where
This is a simple greenhouse model, and most unlikely to be more that qualitatively correct. It doesn’t include any of the subtlety of Beers Law (exponential attenuation of the light according to the optical depth or mean free path of the medium), the modification of this law associated with variable molecular density as one ascends the atmospheric column, the Lorentzian (or not!) shape of the pressure-broadened or doppler broadened molecular lines, and so on. It doesn’t include the effects of albedo, aerosols, soot. It is utterly blind to water vapor, ignores both rotation and axial tilt, pretends there are no oceans nor mountains, treats TOA insolation as if it is a constant (it’s not) and doesn’t even specify a heat capacity and try to solve an actual single layer dynamical system of first order ODEs for the temperature but satisfies itself with looking for the stable steady state where the derivatives vanish.
However, it does suffice to show that the greenhouse effect cannot be argued away by any naive arguments. Your argument (and I mean this entirely respectfully) was a naive, incomplete, and IMO erroneous argument. In particular, it contained no meaningful physics aside from a misstatement of Kirchoff’s Law. That is why I replied with a physics free analogy. If you would like to try again to formulate your argument against a greenhouse effect, and this time use actual physics and equations and so on, I’d be happy to debate at that level. Hopefully we can begin with the single layer model (or better yet, the simplified single layer model with transparent SW and opaque LW that Willis once covered on WUWT as a “steel greenhouse”, although he was reinventing a very old wheel as he did so) so that we can focus on comparatively simple mechanisms that have some representation as equations instead of stating our various opinions about the solutions to insoluble Navier-Stokes equations.
rgb
LOL. Maybe Mikkie will produce the bristlecone pine he used to work out his tree ring theory. Presuming he hasn’t burnt it. That would be easy, then we get another and compare trunks. (Tree not human!) You don’t need to be an egg head to work out tree rings, although the tree rings of the bristlecone pine have been used to gauge bombardment to calculate C14.
rogerknights says:
March 24, 2014 at 3:01 pm
First he disappeared the MWP, now he’s disappeared the Southern Hemisphere. What a magician!
Exactly right Roger! Mann’s ostensible reason for dropping the MWP from reconstructions was a dearth of Southern Hemisphere proxies and supposed localized warming confined to Eurasia. In other words, lack of data was used to justify expunging the MWP from Mann’s reconstruction.
In this latest (and no less egregious) perversion of science; Mann willfully (and not inconveniently) neglects to include perfectly good Southern Hemisphere data in a graph purporting to detail global temperature.
Never trust a liar a thief or the Mann!
I think it would be more accurate to say that in c anything non-zero is true and 0 is false.
And I do, two or three comments up. And the quote is not my words, it is a quote of me quoting somebody else’s words way farther up.
Look, guys, my personal projects source directory is currently around 7 GB in size (and isn’t exhaustive — I have sources in other trees as well). That isn’t all C source (I have coded in fortran, perl, awk, bash, python, pl/1, c, c++, tcl/tk, php, apl, basic, and probably other languages I can’t offhand remember), and it isn’t all C source I personally have written, but the part that is C source that I have written is, really, really big. Probably well over a GB (where of course “written” in many cases means block copy old code and then tweak it — I’m not insane:-). But you are correcting me CORRECTING SOMEBODY ELSE, which is sort of like… er… not correcting me.
I’m just sayin’…
rgb
Looks like our friend M. Steyn has lawyered up big time. No fool he.
http://www.steynonline.com/6201/what-kind-of-fool-am-i#.UzDxUaaDiXs.twitter
So what happens when Mann’s lawyers say, listen Mike, let’s just drop the whole thing…real quiet like. More popcorn please.
@rk – You are SOOOO right! I suspect that Mikey’s nanny is going to have a messy laundry this week!
rgbatduke says:
March 24, 2014 at 8:26 pm
I blame Alan 🙂 I was just adding to the discussion that whether it’s -1 or 1 or 100, true is pretty compiler specific, and usually not 0. Gnu C seems to use true=1. I’m guessing Stallman was trying to save energy or something. I’ll go now.
Right about machine code but virtually all assemblers have codified standards of -1 = true and use it extensively.:
No arguments from me.
It’s just that one can do a direct comparison and branch (which is all if/then ever really is) without the concept of true at all. “True” is basically an upper-level language construct, but nowadays assembler isn’t as pure a textual rendering of machine language as it was way, way back when I took machine programming (and even then there were assembler macros that imposed a veneer of upper level language sensibility on the low level commands).
And even then, it is (as one other person pointed out) probably more appropriate to say that 0 is false and anything else is true, more than -1 (all 1’s in two’s complement in some register) is true, 0 is false, and 27 is neither. Usually 27 will work just as well as 1 as well as -1 as “not false” on a conditional.
However, we now stray far afield from the original minor correction of Mr. Monckton’s sort-of-correct original statement that caused the original completely incorrect refutation of Monckton’s that I replied to with a refutation, that caused several people to think somehow that I had personally claimed that C treated 0 as true even though the statement I quoted was italicized as usual.
Blame WordPress — Slashdot has buttons that allow one to include and quote with attribution. Goodreads has a bloggish interface that allows previewing and correction and more. Piazza has a built in latex translator that allows previewing and editing, as does Wikipedia. There are tools out there that might better support algebraic threads, quoting, inclusions of graphics and links, and more. WordPress seems to be little more than a text entry box with a limited ability to handle embedded latex and some simple html markup. It’s fine, it works, but there are things out there that work better and more powerfully, maybe.
rgb
rgbatduke, You can deke and dive all you want with irrelevant claptrap but I ask you, “Do you really believe despite all of the physics out there that somehow CO2 is amplifying (only way to heat) energy coming in from the sun? No, this isn’t possible physically. You can change a temperature profile but “in energy” is going to equal “out energy” and balancing happens mostly at the speed of light except where it intercepts our atmosphere for brief moments.
if you’re talking logic- which is binary, then you have only 2 choices to represent the only 2 possible choices.
if you are talking about a bit comparison, you’re working with one bit vs one bit.
nobody uses 8 bits to represent a logical state. but the processor has a built in circuit to test for zero.
when a processor does a comparison for equality, it is performing a logical computation:
if (A and B) or (not (A or B)) for many bits in parallel.
you know the truth table for that is not gonna have anything but ones and zeros, right?
anyway, the issue is phony. 1 and 0 are abstract convention for representing a logical state, which is binary and not a definition of any particular numerical value.
GregB;
You can change a temperature profile but “in energy” is going to equal “out energy” and balancing happens mostly at the speed of light except where it intercepts our atmosphere for brief moments.
>>>>>>>>>>>>>>>>>>>>
Greg, you’ve been given an analogy and the specific physics by RGB. They’re both accurate to the extent possible in a blog post. You’re own explanation is wrong for the simple reason that you are confusing two very different concepts. Yes CO2 molecules absorb and emit and the net is zero. But it isn’t that net energy that is the issue it is the energy flux that is the issue. The process of absorbing and emitting changes the flux at any given point, not the net energy in and out of the system (unless we’re talking about the transition between equilibrium states, which we aren’t).
Consider a slightly different analogy, that of a damn that forms a lake. The water flowing into the lake does so at exactly the same rate as water flows over the damn. Raise the damn a few feet. There’s a period when no water flows (between equilibrium states). But once equilibrium is reached again, the water flowing in does so at the exact same rate it did before, and it goes over the damn at exactly the same rate that it did before. But there’s no argument that the lake is deeper.
I suggest you apologize to rgb. You asked for the physics, he gave you what you asked for, and you called it claptrap. Either you didn’t understand a word of what he said, or you just weren’t interested in the facts in the first place.
I cannot believe I misspelled dam that may times in a row. Dam spell checkers ought to know which dam damn I dam well meant.
And which ewer your using to make you’re point, huh?
🙂
Perhaps when the variable is viewed arithmetically, as this will be the *arithmetic value* of the internal integer (pos and negative *whole* number) representation with the number “-1” represented internally in “two’s complement” form, when all bits within the ‘referenced’ byte (or word, or double word etc) variable (ostensibly a BOOL in this case) will be set to a “1” for a value of -1.
The way this works, is: For an integer byte (8 bits, 7…0) value, the MSB (bit 7) represents “-128”. The next MSB (bit 6) represents +64 and so on down to the LSB (bit 0) which represents “+1”. Set all bits high, sum the values they represent, and one gets the sum “-1”.
Depending on the processor language and compiler, for a BOOL (Boolean value) variable, YMMV.
.
davidmhoffer, I don;t give a dam. \i actually wanted to get to the point you are making. You call it flux, I call it temperature profile, i believe that a profile allows one to measure where the heat is coming from.. Yes, energy can be delayed on it’s exit from the atmosphere but for every watt delayed there is a corresponding greater thirst by the above. The 3 K temp of space has an absolute damping mechanism on energy build up.
rk says:
March 24, 2014 at 8:32 pm
Looks like our friend M. Steyn has lawyered up big time. No fool he.
http://www.steynonline.com/6201/what-kind-of-fool-am-i#.UzDxUaaDiXs.twitter
======================
This is a huge development.
Mr Steyn, if you’re reading this, don’t insult the judges, just educate them. I’ve been there ….
… and won.
The legal win is way more important for the world than your personal ability to pee further than Michael Mann’s half an inch.
I think Mark is rubbing more salt in the wound and hoping to irritate Mann. Just get your own bristle cone pine and demonstrate how it is a faulty way to do research. Get an archaeologist who knows how to do it. Tree growth is governed by environmental conditions, and rain levels. As bristle cone pines are evergreen, they can live in temperate areas rather than tropical because they need a lot of rain to grow and are naturally slow growers anyway. Although long lived. They were used to calculate or recalculate C.14 (carbon 14) dating methodology, as the planet has been receiving varying levels of C.13-c.14 over the years, and that comes from outer space or atmospheric atom bombs explosions. That is why you will see on an dating of organic artifacts, a plus or minus from the date proposed.
Hence my earlier posting:
I am interested in how closely the model-generated curves match the historical data. I’m thinking they have to be curve-fit. I don’t know a lot about these Energy Balance Models, but from reading the article it looks like the numbers they have to play with are the solar constant (S) and forcing from volcanic aerosols (which they call a). They briefly described how they varied S. It sounded like it took solar cycles into account, but I couldn’t tell if they also gave themselves leeway to play with it. Even if the changes in “S” were tied to actual cycles, that still leaves “a” to play with. Has anyone looked at the data for any sign that the “S” and “a” data come from anything other than curve fitting? If either of them were chosen purely to force the model runs to follow the white line through history, then readers might get an incorrect impression that these models impressively match historical temperatures by using actual data concerning solar output and volcano activity, combined with actual C02 data.
re: DirkH says March 24, 2014 at 11:08 am
… Rather, the highest bit of a register serves as sign in 2′s-complement arithmetic.
One sees this in print, in various places, and if one presses that into practice one finds oneself at odds with the practical implementation of numbers in Two’s Complement form.
If, instead, one treats the MSB as the minimum value representable in the memory allocation ‘chunk’ (e.g. -128 for a byte,. -32768 for a 16-bit word, etc) or *register* one is working with, then ‘things’ work out in a much more straight-forward fashion; For human interpretation it is a simply matter of ‘summing’ the bit representations together to arrive at a value.
Then there is the practical matter of summing and subtracting these values as performed at the ‘hardware’ level (where normally *today* your compiler or interpreter ‘hides’ intimate register-level manipulations of bits in the CPU core) … all this becomes VERY apparent when writing and debugging assembly-level apps, targeted for a nominal ‘8-bit’ (there are some 16 bit ops using pairs of registers; addressing computations involve 16 bits for instance) CPU like a Z80 (some of the happiest days of my life, I might add.)
.
GregB;
You call it flux, I call it temperature profile, i believe that a profile allows one to measure where the heat is coming from..
>>>>>>>>>>>>>>>
How many times in a row do you intend to conflate two completely different things? Until and unless you understand the difference, you’re going to have trouble understanding the explanation. If you were right, the earth would not be warmer than the moon. But it is. Venus would not be warmer than Mercury. But it is. Putting on a an extra blanket would not keep you warmer at night. But it does. You are wrong, and demonstrably so. I suggest that you read the following:
http://wattsupwiththat.com/2011/05/07/visualizing-the-greenhouse-effect-light-and-heat/
http://wattsupwiththat.com/2011/03/29/visualizing-the-greenhouse-effect-molecules-and-photons/
http://wattsupwiththat.com/2011/02/28/visualizing-the-greenhouse-effect-atmospheric-windows/
You either want to understand how the physics works, in which case those are excellent starting points, or you want to cling to a belief system. If your belief system is correct, then millions of engineers the world over are designing everything from easy back ovens to nuclear reactors that don’t work. You’ll find that those things do in fact work, and they are based on the precise same physics that RGB pointed you to, and which is detailed at a less technical level in those three articles.
davidmhoffeer,
What I am saying about temperature profile relates directly to flux. It’s a derivative – think about it. It is simply a different way of looking at it and possibly simplifying the variables. There is no doubt that dragging a photon of heat energy on the back of a molecule will translate into our environment better than a photon on it’s way to outer space. The mathematical fact remains that a molecule giving up a certain amount of energy will cool by an “exactly equivalent amount of energy”. Try and deny this — I double dare you.. I also double dare you to say, ” It isn’t from the atmosphere that this cooling back radiation emanates from”.
What if…. we had a magic wand to reduce CO2 and attain an ideal global temperature and this wand was given to the warmistas? Do they have such “ideal” levels or would they fight each other tooth and nail to establish, each his own, preconceived notions of what is “best for the planet”?
You can deke and dive all you want with irrelevant claptrap but I ask you, “Do you really believe despite all of the physics out there that somehow CO2 is amplifying (only way to heat) energy coming in from the sun? No, this isn’t possible physically. You can change a temperature profile but “in energy” is going to equal “out energy” and balancing happens mostly at the speed of light except where it intercepts our atmosphere for brief moments.
Thereby demonstrating my point. All you are capable of grasping is indeed a simple analogy, if the best you can do when you ask me to reply with physics is call the physics I reply with “irrelevant claptrap” and then try to put words in my mouth about belief in non-existent CO_2 “amplification” (whatever that might be, however much it is the “only way to heat”).
Look, why not admit that you don’t understand one thing about radiation physics? It’s really ok not to — you are in the position of 99.99% of the world’s humans. But please try to understand — there are Real Physics Books that do, in fact, go through the physics a line at a time, written by and read by people that do understand what they are writing and reading and who can in turn reproduce it, stuff that has been repeatedly tested experimentally to where nobody really doubts the general ideas any more, even though some of what is written is only known to some approximation or in some idealized context.
I don’t believe “despite” all of the physics out there that CO_2 is “somehow” contributing to a greenhouse effect. I understand how CO_2 differentially interacts with incoming (shortwave) and outgoing (longwave) radiation to produce a relative surface heating compared to what one would have in a CO_2-free perfectly transparent atmosphere. Understanding — especially when it is quantative and can be derived, if only in an oversimplified model — is not really the same thing as blind belief or the use of words you do not understand, out of context.
One of the things you clearly do not understand is the idea of detailed balance. The rate at which energy is received by the surface (incident power) has to balance the rate at which energy is lost by the surface. In an imaginary atmosphere that is perfectly transparent to the short wavelength energy of sunlight which falls onto a perfect absorber surface, the first rate is determined by the intensity of sunlight only. However, the rate at which the surface loses heat is determined by its temperature. The wavelengths at which the energy is lost by the surface are not the same as the incoming energy — they are long wavelength IR radiation. If the atmosphere above is opaque to LWIR — a perfect absorber/emitter of LWIR — it will on average redirect 1/2 of the outgoing LWIR back towards the surface. The rate that the surface receives energy is then SW visible sunlight (unchanged) PLUS this back radiation, 1/2 the outgoing surface radiation.
In order for the surface to be in detailed balance and lose energy to outgoing radiation at the same rate it receives it from the mix of sunlight and back radiation from the atmosphere, it has to be at a higher temperature than it would be if there were no back radiation. It is really very simple.
We can work through the equations a line at a time if you want. But I’m going to have to invoke a “Willis clause” on our discussion. YOU asked for me to discuss the physics with you and not give you simple analogies that would help you see why your assertions that CO_2 has no effect, or a cooling effect, are wrong (quite aside from the direct spectrographic data that demonstrates that CO_2 without any question at all creates a greenhouse effect, reproduced in Petty’s previously mentioned book). If you want to discuss the physics, that’s fine. I’m a Ph.D. physicist. I make a living teaching physics. I write physics textbooks. I’m happy to teach you the physics you need to know to understand that the greenhouse effect is real and is responsible for a substantial net warming of the Earth’s surface compared to what it would be with identical albedo and emissivity with either no atmosphere or with a perfectly transparent atmosphere. That doesn’t mean GCMs are right, that CO_2 will lead to catastrophe, or anything of the sort.
It does mean that it is simply silly to assert that CO_2 is not a greenhouse gas and does not produce any greenhouse effect warming of the planetary surface, especially backed by a verbal, not even qualitative or conceptual argument containing phrases that nobody has ever even heard in this context. You’ll have to decide for yourself if it is silly to argue with a physics professor about physics when you don’t really know any physics (or, I’ll guess, calculus or higher math). But if you want my further attention, it will come when you provide some actual algebra and argument founded on actual laws of physics, not statements about energy escaping “at the speed of light” that have very little to do, really, with the process involved in general or with detailed balance in particular. The process is quite adequately modelled by basketballs at the speed of basketballs. So far, you haven’t even managed to address that supersimple model. Backradiation is real, because we can direct measure it with simple tools. It is added to equally directly measurable sunlight. Outgoing surface radiation is real, and we can directly measure it. Outgoing radiation at the top of the atmosphere is real, and we can directly measure it. When one does simple bookkeeping on the rates of these experimentally observed rates, one concludes that the existence of backradiation from greenhouse gases in bands where the atmosphere is optically opaque with a short mean free path causes net differential warming of the surface in order for the surface to remain in detailed balance.
It is really quite simple.
rgb