No mention though of the possibility that this is all part of a natural pattern, and of course no mention of Ms. Stroeve’s Greenpeace connections to her research, which brings her scientific objectivity into question. UPDATE: A graph submitted by a commenter suggests otherwise as does recently published paper. See below. UPDATE2: data source has been added.
From NSIDC and UCL:
New data confirms Arctic ice trends: sea ice being lost at a rate of five days per decade
The ice-free season across the Arctic is getting longer by five days per decade, according to new research from a team including Prof Julienne Stroeve (Professor of Polar Observation and Modelling at UCL Earth Sciences). New analysis of satellite data shows the Arctic Ocean absorbing ever more of the sun’s energy in summer, leading to an ever later appearance of sea ice in the autumn. In some regions, autumn freeze-up is occurring up to 11 days per decade later than it used to.
The research, published in a forthcoming issue of the journal Geophysical Research Letters, has implications for tracking climate change, as well as having practical applications for shipping and the resource industry in the arctic regions.
“The extent of sea ice in the Arctic has been declining for the last four decades,” says Julienne Stroeve, “and the timing of when melt begins and ends has a large impact on the amount if ice lost each summer. With the Arctic region becoming more accessible for long periods of time, there is a growing need for improved prediction of when the ice retreats and reforms in winter .”
While temperatures have been increasing during all calendar months, trends in melt onset are considerably smaller than that of autumn freeze-up. Nevertheless, the timing of melt onset strongly influences how much of the Sun’s energy gets absorbed by the ice and sea. This in turn is affected by how reflective the surface is. Highly reflective surfaces, such as ice, are said to have a high albedo, as they reflect most of the incoming heat back into space. Less reflective surfaces like liquid water have a low albedo, and absorb most of the heat that is directed at them.
This means that even a small change in the extent of sea ice in spring can lead to vastly more heat being absorbed over the summer, leading to substantially later onset of ice in the autumn. There is also a second effect, in that multi-year ice (which survives through the summer without melting) has a higher albedo than single-year ice that only covers the sea in winter. Since the 1980s, the proportion of the Arctic winter ice that is made up of multi-year ice has dropped from around 70% to about 20% today, so the changes are quite substantial
These feedback effects, in which small changes in atmospheric temperature and sea ice lead to large changes in heat absorption, was what the team set out to study.
Stroeve’s team analysed satellite imagery of the Arctic region, dating back over 30 years. The data breaks down the whole region into 25x25km squares, and the team analysed the albedo of each of these for each month for which they had data. This allowed them to update trends and add an extra 6 years onto the most recent analysis of its kind. The new data continues the trend towards longer ice-free periods previously observed.
“The headline figure of five days per decade hides a lot of variability. From year to year, the onset and freeze-up of sea ice can vary by about a week. There are also strong variations in the total length of the melt season from region to region: up to 13 days per decade in the Chukchi Sea, while in one, the Sea of Okhotsk, the melt season is actually getting shorter.”
The amounts of energy involved in these changes are enormous – hundreds of megajoules of extra energy accumulated in every square metre of sea. This is equivalent to several times the energy released by the atom bomb at Hiroshima for every square kilometre of the Arctic ocean.
For organisations such as oil drillers operating in the Arctic region, a sophisticated understanding of when the sea will freeze up is essential. For climate scientists, this type of study helps them better understand the feedback mechanisms inherent in the Arctic climate. The results from this study are closely in line with previous work and therefore give added confidence that models of the complex Arctic climate are broadly correct.
Notes
- The research appears in a paper entitled “Changes in Arctic melt season and implications for sea ice loss”, to be published in a forthcoming issue of the journal Geophysical Research Letters. An online pre-print is available now on the journal website.
- Julienne Stroeve is a recent appointment to UCL Earth Sciences, joining the department from the National Snow and Ice Data Centre in Colorado, USA.
Related links
- Article in Geophysical Research Letters
- UCL Earth Sciences
- National Snow & Ice Data Center
- Centre for Polar Observation and Modelling
High-resolution images
Satellite view of sea ice
This image may be reproduced freely as it is in the public domain
Map of changing melt seasons in the Arctic
This image is available under a Creative Commons Attribution Non-commercial No-derivatives licence. It may additionally be reproduced for the purpose of news reporting.
Researcher profile
=================================================================
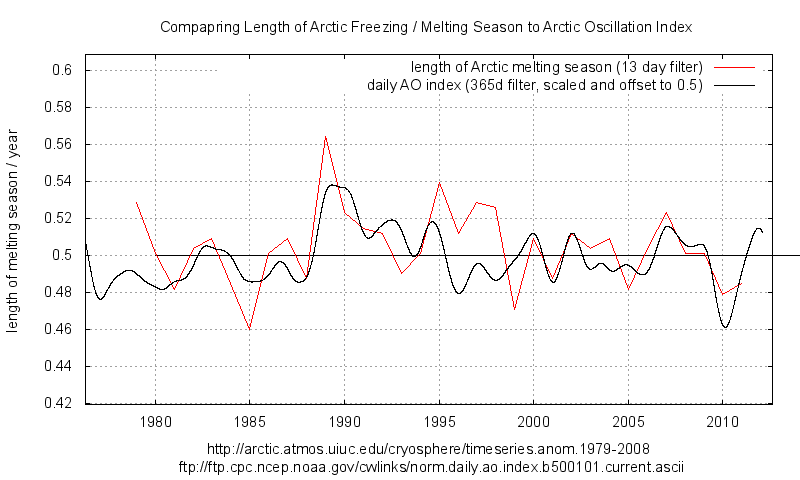
UPDATE: Gail Combs offers this graph in comments which suggests that there is no long term trend for the data back to 1979, only a recent drop. FTP Data source listed below.

UPDATE2: Les Johnson Sends over his spreadsheet with data. He writes:
This is my spreadsheet on arctic ice max/min. The data is taken from the link in the sheet. I apologize as its not user friendly, nor fully automated. I did not expect to share it. I filter by year, and take the max/min and the respective dates. That’s it. The assumption is that after max, the ice is melting, until minimum is reached.
1979-2011 arctic melt season (XLSX)
Also Greg of “climategrog” says he thinks the graph needs more context. So, here it is with his links:
The data source listed on that graph is the original data source from which it is derived. It is not the data which is shown in the plot. I know because it’s my processing of that data.
Taken out of context it is rather misleading. Indeed you seem to have (not unreasonably) misunderstood it be the data in the FTP link that is plotted directly. It would seem more appropriate to provide a link to my documentation of how it was derived.

==============================================================
By way of explaining the recent drop in days, we have this recently published paper Via the Hockeyschtick:
New paper finds lows of Arctic sea ice in 2007 and 2012 were due to storms
A new paper published in The Cryosphere finds that the 2 recent lows in Arctic sea ice over the past decade during 2007 and 2012 were strongly related to storm activity, rather than a long-term effect of climate change. According to the authors, “Strong summer storms on the Siberian side of the Arctic Ocean may have been important contributions to the recent [Arctic sea ice minimums] in 2007 and 2012.” Arctic sea ice strongly rebounded in 2013 by up to 78% in comparison to 2012, suggesting the 2007 and 2012 lows were just natural variation.
The paper adds to many other peer-reviewed publications finding Arctic sea ice extent is due to natural variability from winds and storms, not AGW.
The Cryosphere, 8, 303-317, 2014
http://www.the-cryosphere.net/8/303/2014/tc-8-303-2014.html
Cyclone impact on sea ice in the central Arctic Ocean: a statistical study
A. Kriegsmann1,* and B. Brümmer1
1Meteorological Institute, University of Hamburg, Hamburg, Germany
*now at: Climate Service Center, Hamburg, Germany
Abstract.
This study investigates the impact of cyclones on the Arctic Ocean sea ice for the first time in a statistical manner. We apply the coupled ice–ocean model NAOSIM which is forced by the ECMWF analyses for the period 2006–2008. Cyclone position and radius detected in the ECMWF data are used to extract fields of wind, ice drift, and concentration from the ice–ocean model. Composite fields around the cyclone centre are calculated for different cyclone intensities, the four seasons, and different sub-regions of the Arctic Ocean. In total about 3500 cyclone events are analyzed. In general, cyclones reduce the ice concentration in the order of a few percent increasing towards the cyclone centre. This is confirmed by independent AMSR-E satellite data. The reduction increases with cyclone intensity and is most pronounced in summer and on the Siberian side of the Arctic Ocean. For the Arctic ice cover the cumulative impact of cyclones has climatologic consequences. In winter, the cyclone-induced openings refreeze so that the ice mass is increased. In summer, the openings remain open and the ice melt is accelerated via the positive albedo feedback. Strong summer storms on the Siberian side of the Arctic Ocean may have been important contributions to the recent ice extent minima in 2007 and 2012.
Whether the longer ice-free periods are from more solar heat or from increased circulation from the Gulf stream, it would be nice to be able to predict the opening of more sea lanes in the future.
Anthony,
I agree with you. It’s pertinent. In my view, it’s a free country sure. Scientists are free to be activists in their fields. And reasonable people are free to doubt their objectivity as a result.
5/3650 =0 .13% change. There is no way that they have measured sea ice that accurately.
This is another alarmist bit of arm waving.
In traditional Climate Change, things went in cyclical patterns.
In New Age Climate Change, things are linear and prove the magic beans we threw into our computer models are working to enhance our reverence and devotion to Gaia.
Philip Haddad says:
March 4, 2014 at 11:06 am
Whether the longer ice-free periods are from more solar heat or from increased circulation from the Gulf stream, it would be nice to be able to predict the opening of more sea lanes in the future.
Sure, but they can’t serve two masters. For them, CAGW reigns supreme. Any and all “predictions” then are suspect. Their statements regarding serving the interests of shipping and oil companies is mere pretense, and laughable on its face.
I guess they teach climate scientists everything but cycle math so that they appear to ignore dynamics of curves and turning points. This too shall pass. Something similar must have happened during the Black Plague when they were clueless about fleas.
do they differentiate between reduction in sea ice extent due to ‘ice melt’ vs reduction in ice coverage due to winds and currents causing ice compaction?
i thought arctic ice ended in sept 2013? that was the prediction?
does anyone know what the ‘correct’ climate is for the earth? why is the current situation the MOST desirable one? why not ice age or ice free?
Munch screaming about ‘change’ is what kids do.
Response to Gail Combs:
Gail, either you are not aware of the problem of curve fitting to segments of data all the way through the end points, or you are being deliberate in your misinformation. The start and end of your data set are not unusual compared to the rest of the set, but happen to start on a local high point and end on a single low point that happens to be near a previous low point. For example, if you started in 1980 rather than 1979, the start of the curve would be down, not up. This is called being not robust, among other comments. Also, if you observe 1985, 1999, and 2010, you see three similar negative spikes, but 1999 is the lowest, not 2010 or the present. You simply do not have a long enough data set to come to the conclusions you make. Your basic argument is that a couple of years is a real trend. If that is so, the 17 years the global temperature has not increased is absolute proof that there is no global warming. I don’t even believe that , but it is far more convincing than your point.
1. Fewer days is better.
2. Whole thing added to my collection of Girly Science
3. Anyone have any thoughts on this please.For part of November all December, January and part of February almost every day the UK weather forecasts showed winds at gale force blowing Northwards straight up the Irish Sea and the North Sea up the coast of Norway into the Arctic region. Often these winds originated over Iberia or the Bay of Biscay and I would think contributed some warmth to the north as well as giving the North Atlantic Drift a bit of a boost.
Is there any ice left in the Arctic sea this year? How soon will any effects of these warm(er) winds be attributed to AGW?
As this layman sees it, the sun never reaches 45 degrees above any Arctic horizon thus more sunlight energy is reflected than absorbed by ice free sea water. Also ice free sea water radiates more energy to space than an ice covered sea surface. The ice surface can be several tens of degrees Celsius BELOW zero. It seems to me ice on the Arctic waters is a good insulator REDUCING energy loss at the North Pole during winter.
The present low level of Arctic ice cover definitely follows storm weather events that rapidly break up newly forming ice. Look at records available at:
http://www.ijis.iarc.uaf.edu/en/home/seaice_extent.htm
Leonard Weinstein says:
March 4, 2014 at 11:44 am
Response to Gail Combs:
Gail, either you are not aware of the problem of curve fitting to segments of data all the way through the end points, or you are being deliberate in your misinformation.
===
Leonard, the graph Gail linked is one of mine Gail apparently found on a pastebin. I also linked to that analysis above, where I covered it in some detail how it was derived.
http://climategrog.wordpress.com/?attachment_id=210
http://climategrog.wordpress.com/?attachment_id=206
Perhaps you should look at that description and then post back with any criticisms of the method.
If you think there is some problem with the end points please be specific.
“This allowed them to update trends and add an extra 6 years onto the most recent analysis of its kind. The new data continues the trend… ”
Only in post-normal science is ‘projection’ called ‘data’…
Steven Mosher says:
March 4, 2014 at 10:19 am
Look. nothing is more un scientific than attacking a person because of their politics or religion.
Hey Stephen, I just copied and pasted the first line of your post. I used “ctrl c” to copy the highlighted text and “ctrl v” to paste the text. So could you please do me the honour of doing the same from the original thread which supports your assertion.
I must be really dim because I cannot see it.
Or maybe you could apologise to your host. {but I guess I won’t hold my breath waiting for that to happen…}
I also did the melt season charts. It shows that the melt season is increasing over the record, by 0.5 days per 100 years.
The dates of maximum and minimum ice are remarkably flat, especially minimum.
http://oi62.tinypic.com/20uae79.jpg
Ms Stroeve then looked at the data from Antarctica and concluded that if the current trend continues, by 2100 winter sea ice will be visible from Tasmania.
Mosher (and everyone else). That paper is crap. 5 days per decade? Not a chance. Using max and min dates, the melt season is getting longer by 0.5 days per 100 years.
This paper is only out by two orders of magnitude.
http://oi62.tinypic.com/20uae79.jpg
“The ice-free season . . .”
Did I miss one of Winston Smith’s memos?
I don’t know where this came from. Didn’t find it in the article.
A question: When these types of studies measure/calculate albedo, especially of the liquid ocean, are they measuring it from the high elevation angle of the satellite, or of the elevation angle of the sun, which is what primarily matters?
In the late summer, when sea ice extent is at its minimum, and has seen the most decrease in recent decades, the elevation of the sun is so low that most sunlight would get reflected off the water’s surface (at least if relatively smooth), so the effective albedo to sunlight would actually be quite high.
“NSIDC’s Greenpeace connected researcher claims less days of Arctic sea ice being seen”
Yeah, well, one can not see the ice when they have their eyes and mind closed.
I agree also with some comments upstream regarding what is happening at the other pole – Antarctic Ice is increasing which may be keeping a relative total ice amount somewhat balanced.
Remember, as mentioned, it is “Global Warming” or even “Global Climate Change” that is the supposed concern.
early in the report:
With the Arctic region becoming more accessible for long periods of time, there is a growing need for improved prediction of when the ice retreats and reforms in winter .”
funding please.? How obvious can you get!
Anthony
Last year I wrote ‘Historic variations in Arctic Ice part two.
http://judithcurry.com/2013/04/10/historic-variations-in-arctic-sea-ice-part-ii-1920-1950/
The edited version was carried at Climate Etc but there is also a much longer, much more detailed version which has never been published on the web. As it involves the subject of your post I have included a lengthy abstract from it, which seems to indicate that the certainty over our estimates of ice might be somewhat over confident.
——— ———- ——– Abstract——– ——-
This was noted by the author in the library of the Scott Polar institute in Cambridge and has parallels in one of the news items previously quoted;
‘Observational data of the drifting station 1950-51-by M Somov -Volume 1 of 3 of this Russian North pole station on an ice floe.’
Middle of June onwards ‘the melting of the snow and ice took place very quickly although the air temperature remained close to freezing’
‘the sun shone…could walk about without a coat…some even tried to get a sun tan.’
‘because of the thaw an enormous amount of water accumulated on the ice’
‘walking was only possible if one wore high rubber boots reaching above the knees’ (because of the water sitting on the ice.’
‘many problems because of the thawing.’
The book described how later in the season some high spots became dry and these were little hillocks in a sea of icy water sitting on solid ice. This caused me to ask the following question of NSIDC;
“ …..how did pre satellite researchers estimating sea ice extent tell the difference between water, water floating on ice, and solid ice, and how can satellites differentiate between the three states? I was struck by Russian reports from the 1950’s at The Scott Polar institute in Cambridge when staff at the floating research stations commented about using Wellington boots in order to walk around the station, and how little dry ice islands eventually formed by the end of the summer surrounded by water on top of ice.”
I received the following reply from Julienne Stroeve ;(reproduced with permission)
“ … using passive microwave data it is very easy to tell the difference between ice and water as the dielectric constant differs quite a bit and this is reflected in large differences in the microwave emission. The main advantage of using passive microwave is that it can see the ice even if it’s cloudy or dark. There is a problem however in summer when melt ponds form on the ice since the sea ice algorithms then underestimate how much ice there really is (they think it’s open water). That’s one reason why we focus on extent rather than true ice area for the NSIDC sea ice news and analysis web site.
Visible and thermal imagery provides higher spatial resolution but is often hampered by clouds. Trying to do this work using earlier visible and thermal imagery requires the scientists to go through each image and manually filter out the clouds and determine where the ice is.”
The arctic in those pre satellite days was simply too large to be effectively and continually monitored. Observers getting close enough to the ice edge to make physical observations might be deterred from proceeding further by apparently impenetrable ice although better, more open conditions, might lie beyond. Data from such as the Russian sector – where much warming occurred, was not always taken into account. (However, the reader should be aware that, as Larsen noted, ice did sporadically return whilst reports from 1939-45 are sparse for obvious reasons.)
In trying to determine the true extent of sea ice melt during the period we run the risk of comparing apples-physical observations, and oranges- satellite altimetry, and the different methods employed over the years creates uncertainties over whether each accurately picked up what is ice, what is water covered ice and what is open water. This makes it difficult to determine how modern ice extent compares to the past with any certainty.
However, the conclusion must be that drawn that warming was more widespread in the arctic-not just the Atlantic side-than is currently noted in the official sea ice data bases covering1920-1945/50 and that the official records appear to very substantially overstate the ice area extent. Some of the thinning of the ice and reduction of glaciers noted today appears to have had their genesis in the period.
——— ——— End——–
tonyb
Les Johnson. “That paper is crap. 5 days per decade? Not a chance. Using max and min dates, the melt season is getting longer by 0.5 days per 100 years. ”
To be fair, it may be better to do something a little more subtle than just taking one day minima and maxima to determine before declaring a paper to be “crap”.
I also disagree with the result of the paper but dismissing it as “crap” without even reading it is not very sensible or fair.
Greg: Its crap. The melt season is NOT getting 5 days longer per decade, based on min/max ice dates. Its out by 2 orders of magnitude.
Just ask the guy what pot he is smoking.
Must be the same pot the Russians found when they boarded the GreenPeace ship protesting the Russian oil platform.
Something tells me this dope has huge influence on judgement.
Just send the guy to the Rehab and he will come to his senses.