Guest essay by Don J. Easterbrook, Dept. of Geology, Western Washington University
Last week in my post ‘‘The cause of pause in global warming,” I presented data showing that the lack of global warming was not the ‘biggest mystery in climate science,’ “but, in fact, it really isn’t a mystery at all, it was predicted in 1999 on the basis of consistent, recurring patterns of the Pacific Decadal Oscillation (PDO) and Atlantic Multidecadal Oscillation (AMO) and global climate.” This precipitated an avalanche of caustic comments by Bob Tisdale, almost all of which were totally irrelevant to what I said. This post is to set the record straight so there is no misunderstanding of the situation.
I like Willis Eschenback’s caveat: “if you disagree with something that I or someone else said, please QUOTE THEIR EXACT WORDS and state your objection. That way we can all understand just what you are objecting to, and the nature of your objection.” With that in mind, here is the crux of what I said.
“Each time the PDO was warm, global climate warmed; each time the PDO was cool, global climate cooled.” “Each of the two PDO warm periods (1915-1945 and 1978-1998) and the three cool periods (1880-1915, 1945-1977, 1999-2014) lasted 25-30 years. If the flip of the PDO into its cool mode in 1999 persists, the global climate should cool for the next several decades. “

Figure 4. (Top) PDO fluctuations and projections to 2040 based on past PDO history.

Figure 4. (Bottom) Projected global cooling in coming decades based on extrapolation of past PDO recurring patterns.
I plotted the oxygen isotope measurements made by Stuiver and Grootes (1997) for the past 450 years, which,
”showed about 40, regularly-spaced, warm/cool periods with average cycles of 27 years, very similar to the PDO cycle. There was no way to determine what the PDO looked like that far back, but the GISP2 warm/cool cycles were so consistent that correlation with PDO 25-30 year cycles seemed like a good possibility. Historically known warm/cool periods showed up in the GISP2 curve, i.e., the 1945-1977 cool period, the 1915-1945 warm period, the 1880-1915 cool period, the Little Ice Age, Dalton Minimum cooling, the Maunder Minimum cooling, and many others, lending credence to the validity of the GISP2 measurements.”

Figure 5. Warm and cool periods to 1480 AD from oxygen isotope measurements from the GISP2 Greenland ice core. The average length of a warm or cool cycle is 27 years.
Conclusions
“The ‘mysterious pause’ in global warming is really not mysterious at all. It is simply the continuation of climatic cycles that have been going on for hundreds of years. It was predicted in 1999, based on repeated patterns of cyclical warm and cool PDO phases so it is neither mysterious nor surprising. The lack of global warming for the past 17 years is just as predicted. Continued cooling for the next few decades will totally vindicate this prediction. Time and nature will be the final judge of these predictions.
What drives these oceanic/climatic cycles remains equivocal. Correlations with various solar parameters appear to be quite good, but the causal mechanism remains unclear.”
Bob Tisdale immediately launched an insulting verbal attack in which he said:
“Easterbrook’s post is misleading, it misinforms, it is contrived, it is far from good science”
“Easterbrook continues to present his misunderstandings of the PDO”
“Easterbrook does more to mislead and misinform than to teach and inform”
“It’s bogus!”
“He insists on misinforming readers”
“Easterbrook’s bogus-looking global temperature anomaly data”
“I suspect it’s a fantasy dataset”
Now I enjoy a spirited discussion of issues as much as anyone and am always willing to discuss any scientific issue, but these unprofessional, insulting remarks are not what I call science and do nothing to advance the understanding of issues. Tisdale completely missed the point of what I said and the basis for saying it. Virtually everything he said was irrelevant to the data that I presented and nothing he said disproves any of my data or my predictions (which so far seem to be right on track). Tisdale missed the boat when he ignored my statement at the outset, “it was clear that PDO drove global climate (Figs. 2,3), but what drove the PDO was not apparent,” and again at the end, “what drives these oceanic/climatic cycles remains equivocal. Correlations with various solar parameters appear to be quite good, but the causal mechanism remains unclear.”
In other words, I was correlating the chronology of the PDO with global climate and glacier fluctuations without worrying about the cause of the PDO. I don’t know what causes the PDO nor does anyone else, including Tisdale. I then used GISP2 Greenland ice core oxygen isotope data to show that 40 warm/cool cycles back to at least 1480 had 27 years cycle patterns very similar to those of the PDO and global warming cycles that we have observed in the past century. Tisdale vented his criticisms of my work on the basis of his interpretation of what causes the PDO, which is totally irrelevant to the data that I presented. The point here is I start with recognition of the existence of the PDO and it really doesn’t matter what the cause is—that’s a separate issue. Tisdale’s interpretations of the relationship of ENSO to the PDO may well be correct, but that does nothing to invalidate the data that I presented. As one of the commenters pointed out, “In addressing Don Easterbrook you assert repeatedly that the PDO is an “aftereffect” of the ENSO. This in no way contradicts anything that Don said, he left the cause of the PDO as unknown.” Tisdale failed to understand that none of his discussions about the cause of the PDO in any way invalidated the data presented.
Tisdale was very critical of figure 4, repeatedly calling it “bogus” (= false, fake, phony, counterfeit, sham) and “a fantasy dataset” (= made up, invented, fictional, imaginary, unreal) because the source of part of the curve from 1900-2000 wasn’t indicated. The logic of such a conclusion is not valid—just because you don’t know the source of data on a graph doesn’t render it ‘bogus’ or a ‘fantasy.’ Yes, it is perfectly reasonable to ask for source data and can reserve judgment until you get it, but Tisdale’s statements were way off base–not logical and unnecessarily insulting. Here is the original graph used for part of figure 4—it is neither ‘bogus’ nor a ‘fantasy.’

This curve is now 14 years old, but because this is the first part of the curve that I originally used in 2000, I left it as is for figure 4. Using any one of several more recent curves from other sources wouldn’t really make any significant difference in the extrapolation used for projection into the future because the cooling from 1945 to 1977 is well documented. The rest of the curve to 2010 was grafted on from later ground measurement data—again, which one really doesn’t make any difference because they all show essentially the same thing. The extrapolated parts of the curve show three possible projections: (1) cooling similar to 1945-1977, (2) somewhat deeper cooling, perhaps similar to 1880-1915, (3) somewhat deeper cooling, perhaps similar to that of the Dalton Minimum. The last two are diagrammatic only– really guesses, but are shown to illustrate possible options. Nothing that Tisdale says in his comments in any way invalids this figure.
The last three graphs in my post are intended merely as illustrations of the global cooling that has occurred since 1998, confirming (so far) the predictions that I made 14 years ago. If you don’t like figure 6, throw it out–Figures 7 and 8 make the same point. Tisdale’s conclusion that “cooling is not occurring from the peak around 2001 through 2010” is easily proven false by the Christopher Monckton graph below.

Global cooling from 1996 to 2013. Graph by Christopher Monckton http://wattsupwiththat.com/2013/08/07/the-agu-policy-statement-as-redrafted-by-monckton/
Conclusions
1. I have neither the desire nor reason to quarrel with Bob Tisdale—I suspect our differences are less than one might imagine. His Enso interpretations may well be correct, but they have no relevance to the data presented in my WUWT post.
2. Nothing in any of Tisdale’s comments invalidates any of the data that I presented.
3. The global cooling predictions that I made in 2000, based on recurring patterns of PDO and global climate, have so far proven to be correct.
4. Nature and time will ultimately prove whether or not my all of my predictions are correct.
5. I hope that we can now move on to more productive issues, especially what is the principal driving force of climate changes. I welcome open discussions of scientific issues with anyone, including Bob Tisdale, but I confess to having little patience with argumentum ad hominem.
Discover more from Watts Up With That?
Subscribe to get the latest posts sent to your email.
Personally, I would like to avoid making much of the PDO as a climate factor because all definitions of it that I have seen are too nebulous. If you need to measure twenty or thirty quantities to determine its state you are pretty far from what the climate is doing. What interests me, however, is the reference to cooling from 1945 to 1977 that is attributed to the PDO above. It does not look like cooling in every climate chart. Checking it on BEST global surface temperature chart that superposes four sources – GISS, Met Office, NOAA, and the Japanese Met Agency, there is a slight upward trend but certainly no cooling. That BEST chart also shows beautiful agreement among the four sources on the location of El Nino peaks from 1880 to 2009. Miller just says that “irregularities” of different temperature curves coincide. Irregularities they are not – what it shows is that the ENSO oscillation affects North America, Europe and Japan.equally. The only cooling involved in mid-twentieth century is the one that terminated the early century warming in 1940. That is the one responsible for the very cold winters of World War II that most temperature graphs show as a heat wave. From 1945 on we have recovery from that cold snap but temperature does not reach the previous peak again until about 1980. It is helped there partly by a step warming attributed to the PDO phase change in 1976. That is said to have raised global temperature by 0.2 degrees Celsius. It is hard to pick it out among all the El Nino peaks there. After 1980 all temperature curves are falsified and show you a fake warming when in fact there was an 18 year hiatus there, from 1979 to 1997. That fake warming just happens to cover the time period of James Hansen’s presentation to the Senate.
I believe Bob Tisdale had the best intentions. He just does not like misuse of his favorite terms; like combining PDO and AMO into a meaningless mix and comparing it against global temperature. PDO is a spatial pattern; AMO is a detrended SST. Cumulative ENSO creates PDO phase and not vice versa; etc.
pause [pawz]
noun
a temporary stop or rest, especially in speech or action: a short pause after each stroke of the oar.
The use of the term itself is indicative of bias. It suggests certainty that the warming will resume, for which there is no scientific basis. The models being used did not correctly predict the current situation, thus it is completely unscientific to assert that they are still a valid predictor, not to mention ludicrous on its face.
Tonyb says: “I reconstructed CET from its instrumental level of 1659 back to 1538 and hope to get it back to 1450 in next few months. I would be curious as to how well you believe it correlates with your graph.”
I’ve plotted the CET to 1659 (you need to blow it up considerably to extract the details, but it gives a very nice correlation with the data I’ve used). It shows the Maunder, 1700-1735 warming, Dalton coooling, 1850-1875 warming, 1875-1900 cooling, 1900-1950 warming, 1950-1975 cooling, 1975-2005 warming, and 2005-2013 cooling. All of these show up in my GISP2 ice core plot.
I would be much interested in what you find back to 1450.
Don
Don Easterbrook says, January 21, 2014 at 8:09 am:
“Perhaps I ought to refer to the PDO as an ‘indicator’ rather than a ‘driver.’”
This is the crux of the disagreement between you two …
PDO is in its essence merely an ‘indicator’, simply because it’s just an index portraying a certain variable SST pattern manifesting itself in the northern Pacific Ocean.
Thus, it does not represent an actual ‘physical process’ like ENSO.
PDO, however, is clearly an indicator of something big going on, of huge, abrupt and pan-Pacific climate regime shifts occurring at certain intervals that affect climate on a global scale.
There is evidence to suggest, though, that this basinwide decadal variability (let’s call it PDV), has its origin in the tropics rather than in the northern Pacific. The major climate shift of 1976/77 is a good case in point.
David L. Hagen says:
January 21, 2014 at 10:27 am
Bob Tisdale
Re: “I did not use ad hominem arguments”
I second Don’s observation that you did. e.g. you stated:
“Easterbrook’s post is misleading, it misinforms, it is contrived, it is far from good science”
“Easterbrook does more to mislead and misinform than to teach and inform”
not only is Figure 6 not the best way to show it, it’s misleading.
“He insists on misinforming readers”
These are ad hominem abusive attacks against Easterbrook’s character, inferring bad or evil character. See definitions of:
Mislead>
: to cause (someone) to believe something that is not true
Misinform
: to lead astray : give a wrong impression
You further stated:
“It’s bogus!”
“But I suspect it does not exist. I suspect it’s a fantasy dataset”
“. . .HADCRUT is based on data. Easterbrooks fantasy version is obviously not.”
“Easterbrook’s bogus-looking global temperature anomaly data”
This is another ad hominem abusive attack against Easterbrook’s character accusing him of concocting data, and contriving misleading data. See:
Bogus
not genuine : counterfeit, sham
Fantasy, definition:
the faculty or activity of imagining things, esp. things that are impossible or improbable.
That borders on serious libel against Easterbrook’s professional reputation as a scientist.
Libel
a published false statement that is damaging to a person’s reputation; a written defamation.
David L. Hagen says:
May I encourage you to actually study ad hominem attacks so you can avoid them. e.g. see The Fallacy Detective. .
You would be well advised to take your own advice. Except for the part about “The Fallacy Detective”. Haven’t read it, but it does not look particularly rigorous and that you suggest its use implies that it is the source of your own misapprehension on the matter. Reference to a proper philosophy text would likely have prevented you from calling out the things you did as ad hominem arguements. They are not.
Tisdale’s arguments were against and formed from the substance of Easterbrook’s post. The language he used was IMO something less than polite, perhaps ‘abusive’ in some eyes. Be that as it may, that is not ad hominem fallacy.
I generally agree with the findings of Dr. Easterbrook. I too have done some analysis of this very interesting phenomena. see http//www.bcclimate.com. I did some analysis of the PDO a few years ago (see website), and found a remarkable signal. I think that perhaps the most influence of the PDO itself is on the west Coast of North America. Of course the whole planet is teleconnected, but for the PDO the signal seems somewhat weaker than ENSO, for instance. That said, I believe most of the changes we have seen over the past one hundred years or so are linked to the Sun. And, as we are now (as I understand it) heading into a period of lower Sun activity, we should has Dr. Easterbook states, be expecting an overall cooling of the climate.
Don J. Easterbrook,
Would you be so kind and explain where the data in the post-2000 portion of your Fig.4 comes from, or what it respresents? Is this supposed to show actual observations from the late 90’s to present?
Thank you
Greg says: “We should concentrate on asking what is driving ENSO.”
The rotation of the Earth is driving ENSO.
jorgekafkazar says:
January 21, 2014 at 12:21 pm
Greg says: “We should concentrate on asking what is driving ENSO.”
The rotation of the Earth is driving ENSO.
><<<<<<<<<<>>>>>>>>>>>>>>>>
Bah! Impossible! The earth’s rotation is diurnal, ENSO is irregular at intervals of years.
A general observation: Could we stop using the term (word) “pause” to describe the lack of warming? Although the root of the word (Greek “pausis”) meant “a stopping” or an “ending,” the modern definitions are “temporary stop,” “break,” “rest,” “hesitation,” and “interruption,” which directly implies a later continuation of that which has paused. Could we use terms such as “cessation,” “stall,” “indefinite stop,” or some such expression that doesn’t implicitly stipulate that warming WILL continue after a pause? I understand that warming MAY continue, but it isn’t a certainty, is it?
I see the AGW Hoax has plenty of apologists and defenders even here at WUWT …
Don Easterbrook: A couple of days ago, I believe I determined how your graph (the disputed Figure 4) was created, but I was waiting for your reply to my comments. You threw me off with your statement in the post above that you had spliced land surface temperature data onto the end of the global land+sea surface temperature data, but it couldn’t have been land surface temperature data because that continued to climb higher.
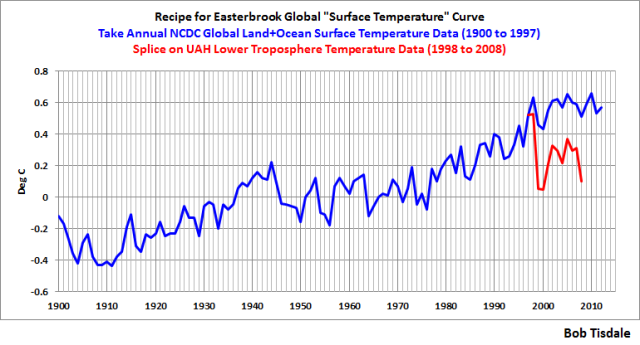
The following graph illustrates how you created your Figure 4. You presented land+sea surface temperature data through 1997. Then you spliced on lower troposphere temperature (TLT) data, starting in 1998 and ending in 2008. My graph (if we excluded the continuation of the surface data) is remarkably close to your Figure 4, especially when you consider the recent changes to the UAH TLT data and the 2008 changes to the NCDC sea surface temperature data. I suspect that if you go back to your old spreadsheet you’ll discover that’s what you did.
As shown, the global TLT data after your splice is in no way similar to global land+sea surface temperature data, so your Figure 4 is not a true representation of the global land+sea surface temperature record and would be confusing to anyone new to the instrument temperature record here at WUWT.
I tried to call your attention to the problem two and a half years ago in my post Comments On “Easterbrook on the potential demise of sunspots”, which Anthony linked to your post at that time. I sure wish you had corrected the problem back then. It would have saved me a lot of time and grief over the weekend. And it would have saved you the need to write this blog post.
In your reply to me above, you wrote:
I can’t throw it out, Don. It’s in your post, not mine. And as far as I know, we don’t delete stuff here at WUWT. We add updates, noting any errors. May I suggest that you add a note to that post from a few days ago, indicating the color-coding on the graph is in error. That way, newcomers to WUWT who are trying to learn won’t be confused or misled by that graph.
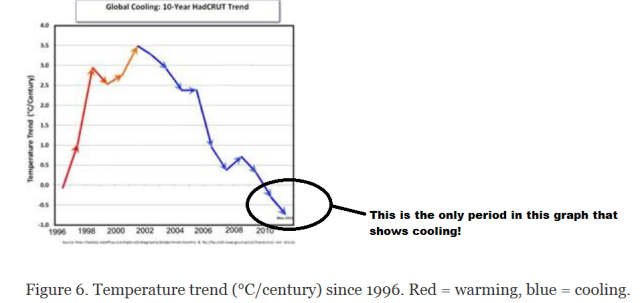
Pointing to Christopher Monckton’s graphs doesn’t solve the problem either, Don. The problem is you color coded a portion of your Figure 6 as being a cooling trend, when, in fact, the 10-year trends from about 2001 to about 2010 are above zero, meaning global surface temperatures had warmed during those 10-year periods. The only time the trend graph shows cooling is when the data points are less than zero. Granted, they were warming at reduced rates as they approached 2010, but they were still warming. See the illustration below, once again.
Don, you wrote in your post:
In reality, Don, on numerous occasions, I’ve provided reasonably easy-to-understand descriptions of how the PDO pattern (upon which the PDO data is based) is created. During an El Niño, coastally trapped Kelvin waves and other changes in atmosphere circulation cause the sea surface temperatures of the eastern North Pacific (near the west coast of the United States and Canada) to warm. The reversal of trade winds in the western tropical Pacific during the El Niño causes less warm water than normal to be transported poleward by the western boundary current in the North Pacific (the Kuroshio Current along the southeast coast of Asia). That reduction in the poleward transport of warm tropical waters in turn causes the cooling in the western and central North Pacific along the Kuroshio-Oyashio Current. Thus the positive PDO spatial pattern (warm in the east, and cool in the western and central portions of the North Pacific). See, it’s easy to explain.
For a La Niña, it’s just about the opposite, but much of the left over warm water from the El Niño gets spun up into the Kurosion-Oyashio extension during the trailing La Niña, and that explains much of the warm water in the western and central North Pacific during the “cool” PDO pattern.
However, because sea level pressure (and the interdependent surface wind patterns) also impact the PDO spatial pattern, the PDO data has a slightly different pattern in time than an ENSO index.
As for this post, you’ll have to make that decision after you update your Figure 4…as you have agreed to do at Anthony’s request.
In closing, once again, let me congratulate you for predicting the cessation of global warming.
Regards
Nature and time will ultimately prove whether or not my all of my predictions are correct.
And when they are proven horribly wrong?
what then???
what will you do when your economy collapses and food riots ensue, when people all over the planet have to shelter indoors to avoid heat stroke and we know that we are only just beginning to experience the increasing warming that has been locked in for the next 100 years or so.
what are you going to do when the Amazon rainforest burns, and plumes of methane erupt from the arctic?
in your figure 5 data from Struvier and Grootes (1997) you say you are using GISP2 data.
In tabulated GISP2 data it clearly says, Minimum age = .037Ky BP
That is 37 years “before present”
For GISP2 the before present is 1954
therefore, in your graph, you have erroneously shifted your timeline about 40 years toward the present because if you didn’t it wouldn’t fit your theory. This is such a simplistic error, it shows that you are really not doing science and really need to get some further education on the subject.
really, you work so hard on this stuff but in the end it is all a big deception, when are you going to stop?
What are you going to do when you realize that you helped to kill your own children?
Please forgive a novice question from a lurker…..
If you assume that Don has correctly identified a long-term cooling and warming cycles that occur on (roughly) a 27-30 year period.
And if you further assume that Bob’s Air-Sea temperature charts correctly do NOT show that cooling started around 2000, but that temperatures merely flattened (MAYBE slightly down to 2014).
Then can you theorize that the reason that the expected decrease in temeperature did NOT occur might be because of manmade increase of CO2?
That way, everyone is “right.” the warmists AND the doubters.
Bloke down the pub says: “Handbags at ten paces.”
Thanks. That’s very funny!
” The point here is I start with recognition of the existence of the PDO and it really doesn’t matter what the cause is—that’s a separate issue. Tisdale’s interpretations of the relationship of ENSO to the PDO may well be correct, but that does nothing to invalidate the data that I presented. ”
Dr. Easterbrook and Mr. Tisdale, while I appreciate the contributions you both have made I think one needs to take a broader view. The IPCC does too. Looking for a “cause” of climate change is a misnomer of “cause”. The earth, as part of the solar system, is a giant thermodynamic machine. “How” it operates is the question, along with understanding of how the details of the operation affect things we might measure or observe such as temperature or weather. The cause is obvious- the sun and the water/atmosphere on the surface of the earth interact in a very complicated way to produce weather and climate. Just look at the moon- no real climate change there.
A simplistic analogue might be a car factory, or better a petrochemical plant. At the factory a car rolls out every minute or two. What causes a car to come out? The driver? or the motor of the car? or the processes in the plant working together? In a large chemical plant a few inputs such as methane, oil, water, air get taken in. At other points out comes a tanker of vinyl chloride or a tanker of gasoline, or a truckload of polyethylene pellets. What causes the outputs? the workers? the various networks of pumps, tanks, and reactors? or the processes in the plant- distillation, catalysis, heat, pressure, sedimentation, etc.?
Ever since the UN Framework Convention assumed a cause for climate variations we’ve been fighting an uphill battle for the science to explain it. Until we can explain how the climate system works and predict(whatever is a suitable measure) is going to be affected we are most likely going to make bad decisions.
Thanks Dr. Easterbrook for the temperate, civil post.
jai mitchell says: “What are you going to do when you realize that you helped to kill your own children?”
Grow up, jai. You might want to peddle that claptrap somewhere else where people might listen to you.
Adios.
One can take no comfort from seeing Don J. Easterbrook and Bob Tisdale going at each other, hammer and tongs. Still at least neither of them is saying anything ridiculous, like, “Carbon Dioxide caused catastrophic global warming”!
Well come on Jai Mitchell tell us how to fix or mitigate YOUR CAGW. Should be a hoot. But remember the non OECD will emit 16 tonnes of co2 to the OECDs 1 tonne until 2040. So pack your bags and do your protesting in China or India. Unbelievably stupid post.
Data sources need to always be shown. It is highly suspicious to present findings and then not show source data.
It is no different to another crowd and it sets science back.
Charles Hart says: “Bob Tisdale, is Don missing something?”
See my comment above at January 21, 2014 at 1:13 pm.
Charles Hart says: “Besides, Tisdale, who would disagree with you and in what way?”
Anyone who understands the difference between ENSO and the PDO would disagree on that matter, but Don has now addressed that.
sabretruthtiger says:
January 21, 2014 at 11:03 am
….The Holocene climactic patterns show we’re at the peak of an optimum due for a descent into another ice age, no amount of CO2 is going to stop that….
>>>>>>>>>>>>>>>>>>>>>
More like head for the expiration date. graph
ARGGHHHHH
And STILL the use of HadCrut as if its actually representative of past (pre-1979) temperatures !!
Seriously ??????
Don Easterbrook: My apologies for being rude in my responses to you on that thread.
I will also ask that you correct your Figure 6 in the prior thread and update your Figure 4 on this thread and the former thread quickly. It should take less than 1/2 hour of your valuable time, and will put an end to this discussion.