Guest essay by Don J. Easterbrook, Dept. of Geology, Western Washington University
Last week in my post ‘‘The cause of pause in global warming,” I presented data showing that the lack of global warming was not the ‘biggest mystery in climate science,’ “but, in fact, it really isn’t a mystery at all, it was predicted in 1999 on the basis of consistent, recurring patterns of the Pacific Decadal Oscillation (PDO) and Atlantic Multidecadal Oscillation (AMO) and global climate.” This precipitated an avalanche of caustic comments by Bob Tisdale, almost all of which were totally irrelevant to what I said. This post is to set the record straight so there is no misunderstanding of the situation.
I like Willis Eschenback’s caveat: “if you disagree with something that I or someone else said, please QUOTE THEIR EXACT WORDS and state your objection. That way we can all understand just what you are objecting to, and the nature of your objection.” With that in mind, here is the crux of what I said.
“Each time the PDO was warm, global climate warmed; each time the PDO was cool, global climate cooled.” “Each of the two PDO warm periods (1915-1945 and 1978-1998) and the three cool periods (1880-1915, 1945-1977, 1999-2014) lasted 25-30 years. If the flip of the PDO into its cool mode in 1999 persists, the global climate should cool for the next several decades. “

Figure 4. (Top) PDO fluctuations and projections to 2040 based on past PDO history.

Figure 4. (Bottom) Projected global cooling in coming decades based on extrapolation of past PDO recurring patterns.
I plotted the oxygen isotope measurements made by Stuiver and Grootes (1997) for the past 450 years, which,
”showed about 40, regularly-spaced, warm/cool periods with average cycles of 27 years, very similar to the PDO cycle. There was no way to determine what the PDO looked like that far back, but the GISP2 warm/cool cycles were so consistent that correlation with PDO 25-30 year cycles seemed like a good possibility. Historically known warm/cool periods showed up in the GISP2 curve, i.e., the 1945-1977 cool period, the 1915-1945 warm period, the 1880-1915 cool period, the Little Ice Age, Dalton Minimum cooling, the Maunder Minimum cooling, and many others, lending credence to the validity of the GISP2 measurements.”

Figure 5. Warm and cool periods to 1480 AD from oxygen isotope measurements from the GISP2 Greenland ice core. The average length of a warm or cool cycle is 27 years.
Conclusions
“The ‘mysterious pause’ in global warming is really not mysterious at all. It is simply the continuation of climatic cycles that have been going on for hundreds of years. It was predicted in 1999, based on repeated patterns of cyclical warm and cool PDO phases so it is neither mysterious nor surprising. The lack of global warming for the past 17 years is just as predicted. Continued cooling for the next few decades will totally vindicate this prediction. Time and nature will be the final judge of these predictions.
What drives these oceanic/climatic cycles remains equivocal. Correlations with various solar parameters appear to be quite good, but the causal mechanism remains unclear.”
Bob Tisdale immediately launched an insulting verbal attack in which he said:
“Easterbrook’s post is misleading, it misinforms, it is contrived, it is far from good science”
“Easterbrook continues to present his misunderstandings of the PDO”
“Easterbrook does more to mislead and misinform than to teach and inform”
“It’s bogus!”
“He insists on misinforming readers”
“Easterbrook’s bogus-looking global temperature anomaly data”
“I suspect it’s a fantasy dataset”
Now I enjoy a spirited discussion of issues as much as anyone and am always willing to discuss any scientific issue, but these unprofessional, insulting remarks are not what I call science and do nothing to advance the understanding of issues. Tisdale completely missed the point of what I said and the basis for saying it. Virtually everything he said was irrelevant to the data that I presented and nothing he said disproves any of my data or my predictions (which so far seem to be right on track). Tisdale missed the boat when he ignored my statement at the outset, “it was clear that PDO drove global climate (Figs. 2,3), but what drove the PDO was not apparent,” and again at the end, “what drives these oceanic/climatic cycles remains equivocal. Correlations with various solar parameters appear to be quite good, but the causal mechanism remains unclear.”
In other words, I was correlating the chronology of the PDO with global climate and glacier fluctuations without worrying about the cause of the PDO. I don’t know what causes the PDO nor does anyone else, including Tisdale. I then used GISP2 Greenland ice core oxygen isotope data to show that 40 warm/cool cycles back to at least 1480 had 27 years cycle patterns very similar to those of the PDO and global warming cycles that we have observed in the past century. Tisdale vented his criticisms of my work on the basis of his interpretation of what causes the PDO, which is totally irrelevant to the data that I presented. The point here is I start with recognition of the existence of the PDO and it really doesn’t matter what the cause is—that’s a separate issue. Tisdale’s interpretations of the relationship of ENSO to the PDO may well be correct, but that does nothing to invalidate the data that I presented. As one of the commenters pointed out, “In addressing Don Easterbrook you assert repeatedly that the PDO is an “aftereffect” of the ENSO. This in no way contradicts anything that Don said, he left the cause of the PDO as unknown.” Tisdale failed to understand that none of his discussions about the cause of the PDO in any way invalidated the data presented.
Tisdale was very critical of figure 4, repeatedly calling it “bogus” (= false, fake, phony, counterfeit, sham) and “a fantasy dataset” (= made up, invented, fictional, imaginary, unreal) because the source of part of the curve from 1900-2000 wasn’t indicated. The logic of such a conclusion is not valid—just because you don’t know the source of data on a graph doesn’t render it ‘bogus’ or a ‘fantasy.’ Yes, it is perfectly reasonable to ask for source data and can reserve judgment until you get it, but Tisdale’s statements were way off base–not logical and unnecessarily insulting. Here is the original graph used for part of figure 4—it is neither ‘bogus’ nor a ‘fantasy.’

This curve is now 14 years old, but because this is the first part of the curve that I originally used in 2000, I left it as is for figure 4. Using any one of several more recent curves from other sources wouldn’t really make any significant difference in the extrapolation used for projection into the future because the cooling from 1945 to 1977 is well documented. The rest of the curve to 2010 was grafted on from later ground measurement data—again, which one really doesn’t make any difference because they all show essentially the same thing. The extrapolated parts of the curve show three possible projections: (1) cooling similar to 1945-1977, (2) somewhat deeper cooling, perhaps similar to 1880-1915, (3) somewhat deeper cooling, perhaps similar to that of the Dalton Minimum. The last two are diagrammatic only– really guesses, but are shown to illustrate possible options. Nothing that Tisdale says in his comments in any way invalids this figure.
The last three graphs in my post are intended merely as illustrations of the global cooling that has occurred since 1998, confirming (so far) the predictions that I made 14 years ago. If you don’t like figure 6, throw it out–Figures 7 and 8 make the same point. Tisdale’s conclusion that “cooling is not occurring from the peak around 2001 through 2010” is easily proven false by the Christopher Monckton graph below.

Global cooling from 1996 to 2013. Graph by Christopher Monckton http://wattsupwiththat.com/2013/08/07/the-agu-policy-statement-as-redrafted-by-monckton/
Conclusions
1. I have neither the desire nor reason to quarrel with Bob Tisdale—I suspect our differences are less than one might imagine. His Enso interpretations may well be correct, but they have no relevance to the data presented in my WUWT post.
2. Nothing in any of Tisdale’s comments invalidates any of the data that I presented.
3. The global cooling predictions that I made in 2000, based on recurring patterns of PDO and global climate, have so far proven to be correct.
4. Nature and time will ultimately prove whether or not my all of my predictions are correct.
5. I hope that we can now move on to more productive issues, especially what is the principal driving force of climate changes. I welcome open discussions of scientific issues with anyone, including Bob Tisdale, but I confess to having little patience with argumentum ad hominem.
Plateau Plateau’d Plateau-ing
None of these imply a future rise or fall. A plateau could be a peak, as on Table Mountain in S. Africa. Or it could be a mere shelf or stairstep on the way to higher things.
Please, folks; Bob T was attacking the data as presented, not the man. His fine and seminal work shows how and why ENSO really operates. The data runs mainly in steps and plateaux. This is because of cloud-mediated tropical Pacific insolation. All of it is meticulously and labouriously put together. Anyone who takes the trouble can jump ahead of most Climatologists, especially with a little help from Stephen Wilde. So, not ad hominem, but rather towards graphs which made it easier to misread the message. Bob, I am in awe of your work. Don, you have also carried the flame through thick and thin, and hopefully will continue to do so. Thankyou both.
Brett from NZ
We really have far-less-certain knowledge of the actual global average temperature variations than manufactured indices, such as HADCRUT4, would indicate. And despite more-or-less realistic empirical descriptions of ENSO-related phenomena, nothing resembling a compelling dynamical theory to explain them from first principles has been presented by anyone. Only the tempest in a sea of unreliable notions seems unmistakable.
Dr. Easterbrook and Mr. Tisdale: This is a tempest in a teapot, and one of you is guilty of indulging a bit loosely in “geologic arm-waving” and the other of you is guilty of some intemperate statements. Both of you have some command of the situation, and it is my humble opinion, neither of you is correct beyond a certain, limited stretch. And both of you should be ashamed of using the temperature records produced by the current “resident experts” whose bogus reworking of the original records is in fact a crime in process.
Let’s say Tisdale is correct in that ENSO is the key process. Well, if the sun’s visible light output is as restricted in range as it currently understood, then there is nothing solar to drive ENSO. So it’s an earthly phenomenon. Basically, something causes the equatorial winds to blow hard – giving us La Nina – or not so hard, giving us El Nino. That then sets all the other “processes” or “oscillations” moving. So what makes the wind blow, or not? I think Willis’s “thermostat” ideas are involved in the answer (along with that Russia paper presented here about how the ITCZ thunderstorms actually represent the pressure sinks that stimulate the equatorial winds).
Now shake hands, get together, and come up with “the theory of plate tectonics” for the Earth’s current climate regime.
Bob
Thank you for your well deserved compliment to Don Easterbrook.
That required major courage of his convictions to present his analysis at the height of the global warming bandwagon, especially when there was so little evidence for the PDO at the time.
and John Finn and JJ
I did not address the scientific substance of Bob Tisdale’s posts, only the logical fallacies where he attacked Don Easterbrook. If I erred in that, please quote exactly what I said and show where I was logically wrong in that quote.
Note that the term “abusive” is the technical sub category of the ad hominem logical fallacy, not just being “impolite”. Note that I gave the definitions of the terms Bob used to explicitly show why they were “abusive” ad hominem attacks.
I chose Fallacy Detective as a popular high school/college presentation appropriate for initial understanding. If you wish a technical discussion, see the 85 mentions of “abusive” under Ad Hominem Arguments, Douglas N. Walton University of Alabama Press, 1998, 315 pp
For litigation see the Federal Rule of Evidence 404(a).
This has been a great thread. I hope that many have had the patience to read through it all, because it demonstrates important elements of scientific methodology, dispute, discussion, and advancement.
Don Easterbrook and Bob Tisdale are both competent scientists and honorable men, as they have amply demonstrated in WUWT presentations and discussions before.
Don is a geologist (as am I) who looks at the long-term geologic record and sees ample evidence of climate fluctuation that far exceeds the (relatively) trivial ups and downs of the last few hundred years – – clear indications that nothing today is “unprecedented” and nothing that requires extraordinary explanations tied to human use of hydrocarbon fuels.
Bob T is a master analyst of patterns in data records for air temperatures, sea-surface temperatures, and related climatic variables. I believe that his careful analysis of these data sets has identified factors that drive the ENSO,PDO, and other derivative indices of climate variation – or at least has illuminated the relationships of these variables and what they say about the movement of heat through the oceans and atmosphere over decadal scales.
So Don and Bob have a disagreement over the description of these climatic phenomena, in part related to differing interpretations of cause and effect. Hooray! This is how science gets tested and discussed and, ultimately, improved.
Thank you both, gentlemen, for having this discussion amidst the chattering chorus of blog-posters. You have both demonstrated your passion for your interpretations and your humility to acknowledge short-comings or intemperate remarks.
Both of you will improve your explanations, and we have all been enriched, by these discussions.
“1945-1977 cooling as CO2 soared?”
How about having a look at any of the major surface indices. My favorite is HadCRUT3, which shows less warming (and greater correlation with both the UAH and RSS satellite indices) than HadCRUT4, GISS, or NCDC. http://hadobs.metoffice.com/hadcrut3/diagnostics/global/nh+sh/
The last year more than .1 degree C coolder than the 1961-1990 average was 1976, and the smoothed curve was sloped upwards then and in 1977. 1977 was the 4th warmest year from 1850 to 1980. The post-WWII bottom was at 1950. It generally warmed since then, although the warming was fast from 1976 to 1998. Smoothed HadCRUT3 even shows slight warming from the smoothing period centered on 1945 to the the smoothing period centered on 1977.
As for major satellite indices, RSS is not the only one. The other is UAH: http://www.drroyspencer.com/latest-global-temperatures/
That one can’t even show a decade of nonpositive linear trend ending within the past few months, despite a century-class spike centered in early 1998.
It appears to me that most on both sides of the global warming debate are overstating their cases.
Re: Figure 4 (bottom):
The cooling shown is much more than even HadCRUT3 indicates, for that matter even HadCRUT2. And CO2 is rising faster, even on log scale, than it did in 1945-1977. Effect of CO2 change is not zero. I think a solar effect will be needed to keep the slope nonpositive this time.
Which I do expect, and I expect this to show the case of IPCC and its likes to be overstated. However, I expect only very slight cooling.
Just to clarify then, we’re now saying we can’t tell if the PDO causes global warming or if they have a common cause or are related at all. And the graph is based on Marcott style spliced data.
So all we’re left:
‘As well as temperatures going up and down, the PDO is also something that happens. ‘
What is the point of this please?
milodonharlani:
I am interested in your statement in your post at January 21, 2014 at 4:43 pm which says
Please explain how the climate system can “want” anything.
And, assuming the climate system can have a desire, then please explain how we could know what that desire is.
Your entire post is meaningless in the absence of those explanations.
Richard
Both Don and Bob need to get together over a good bottle of red wine. Both offer invaluable insight into the climate question.
As to the PDO, it is obviously a function of solar activity as is every climate driving process but how these all intermix needs a lot of work.
Pete Brown says: “What is the point of this please?”
If we assume the PDO is a proxy for ENSO, and based on our understanding that the multidecadal variability of the strengths, frequencies and durations of El Nino and La Nina events are the primary cause of the PDO, then there are mechanisms (portraying themselves as El Nino and La Nina events) that makes this work. See the post here:
http://bobtisdale.wordpress.com/2014/01/17/comments-on-the-nature-article-climate-change-the-case-of-the-missing-heat/
Which was cross posted at WUWT here:
http://wattsupwiththat.com/2014/01/18/comments-on-the-nature-article-climate-change-the-case-of-the-missing-heat/
Regards
Don Easterbrook says:
January 21, 2014 at 11:48 am
“I’ve plotted the CET to 1659 (you need to blow it up considerably to extract the details, but it gives a very nice correlation with the data I’ve used). It shows the Maunder, 1700-1735 warming, Dalton coooling, 1850-1875 warming, 1875-1900 cooling, 1900-1950 warming, 1950-1975 cooling, 1975-2005 warming, and 2005-2013 cooling. All of these show up in my GISP2 ice core plot.
I would be much interested in what you find back to 1450.”
GISP shows a warm spike around 1695 at the coldest part of Maunder, it then cools towards 1725, the complete opposite of CET. GISP shows strong warming from 1830 to 1845, CET again does the opposite. There are a few sections where they follow each other, but not many, through most of it they move in opposition.
What if there is no single “main driver” of climate change?
Clearly our orbiting the sun makes it possible for earth to have a variable climate. Were earth a rogue planet circling the galactic center of mass at its average distance therefrom, it would be frozen pretty much all the time, although there might be some effect from its internal heat. Maybe more so if it also were accompanied by its moon. Despite variable bombardment from GCRs & differing gravitational forces on its journey, not much would be happening here. Without life, the atmosphere would be different too.
But is there any other factor that could account for 50 to 90% of observed climate change, as IPeCaC posits for CO2 on the time scale of a century?
Here are some candidate terrestrial & extraterrestrial “forcing” factors. Please feel free to add to the list, as I’m sure to leave out some that have been suggested.
1. Solar irradiance variation, both in intensity & spectral composition,
2. Solar magnetic field flux, including impact of GCRs,
3. The Moon,
4. Rotation rate of the planet, related to distance to the moon,
5. Orbital mechanics, known to affect climate on the scale of tens of thousands of years,
6. Other planets (arguably included above, as affecting how elliptical our orbit is, which is not much compared to Mars),
7. Continental drift & mountain building & weathering,
8. Volcanism, superplumes & internal heat dissipation,
9. The hydrological cycle or wetness of the air (itself dependent to some unknown extent on solar influences, an area that should be studied instead of paying for more GIGO general circulation models),
10. Clouds, high & low (perhaps subsumed in hydro cycle, above) & their condensation nuclei, controlled by some of the factors above & below, including life,
11. Composition & density of the atmosphere (to include amount of GHGs other than water, such as CO2),
12. Life, including human effects on various of the above & below.
13. Ocean composition & currents, plus amount of water on the surface in general,
14. Ice & albedo.
15. GHG sinks, known & unknown, & consequent dwell time the air of same (related to atmospheric composition above),
16. Earth’s own magnetic field,
17. Energy of the system, ie temperature of air, water & land, IMO not climate itself, but a determinant factor.
Clearly many of these & other factors I missed are inter-related.
I like Dr. Ball’s analogy of a car to climate, in which the sun is the engine, water vapor the transmission & man-made CO2 a lug nut on one wheel (whether powered or not, he doesn’t say). Not sure what’s the U-joint. Maybe clouds.
Bob Tisdale
Thank you for your apology and congratulations. As I said earlier, I have neither the desire nor any reason to quarrel with you. We’re on different tracks—nothing in your work disproves anything in my work and nothing in my work disproves anything in your work. So why are we having this big ruckus? It’s a mystery to me.
Nothing you have said in any way affects my data or my predictions. As soon as I can get to it, I will update the temperature curve in fig 4, but that isn’t going to change anything of importance. At most, it might slightly alter the slope of the 1945-1977 cooling curve, but the difference won’t be significant and it certainly won’t change any of the PDO/climate correlations. Steve Goddard has shown how NOAA and NASA have corrupted data and changed past temperature measurements, so what to use for a temperature curve becomes a problem. I’ll probably use them all and try to use originally measured data as well. The only part of the curves that might affect predictions will be the slope of the 1945-1977 cooling curve and that should be quite minor.
You bring up your responses to my earlier post, “The demise of sunspots.” The reason I didn’t respond to your criticisms then was that they were so full of personal insults and argumentum ad hominem that I tossed them into the waste basket. If you want me to respond to questions, you will need to frame them in a more professional manner.
Let’s end this hassle on a positive note. I wish you well in your research on ENSO related issues and will look forward to reading your work.
Don Easterbrook says: “As soon as I can get to it, I will update the temperature curve in fig 4, but that isn’t going to change anything of importance. At most, it might slightly alter the slope of the 1945-1977 cooling curve, but the difference won’t be significant and it certainly won’t change any of the PDO/climate correlations…”
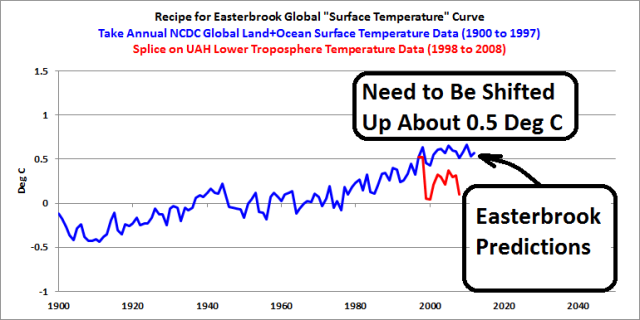
Don, many reading this thread are going to start believing that you’re avoiding making the correction. They know, as do I, that when you get around to updating that graph it will make a significant change to the presentation of your predictions. As I showed above, you appear to have spliced TLT data onto global land plus sea surface temperature data. In fact, it’s pretty obvious that’s what you did. Here, let me “update” your Figure 4 for you.
That’s the problem. Everyone understands it. Why not admit it and move on? Just eliminate the splice, forget showing the models and shift up your predictions. Then you can use that updated version in future posts.
The update will probably take you less time than it took to write your reply to me above.
As a reminder, Anthony asked you yesterday to update your Figure 4. It’s easy. Here’s a link to the source of the NCDC data:
http://www.ncdc.noaa.gov/monitoring-references/faq/anomalies.php
Just click on “Anomalies and Index Data” from the menu along the top. Then select “Annual”, “Global”, “Land and Ocean”. If you leave the last selection as csv, NOAA even provides you with the spreadsheet, so just save it as an Excel spreadsheet. No fuss. No muss.
Don Easterbrook says:
January 22, 2014 at 8:02 am
Nothing you have said in any way affects my data or my predictions. As soon as I can get to it, I will update the temperature curve in fig 4, but that isn’t going to change anything of importance.
Don
How can you say that (correctly) updating the temperature curve won’t change anything. You have spliced TLT anomalies on to the end of the NCDC graph. The two datasets use completely different base periods. UAH uses 1981-2010; NCDC uses 1951-1980. If you update Fig 4 with correct NCDC data , the 2001-2010 portion of the graph will be shifted upwards by at least 0.2 degrees.
Bob Tisdale has already done this and shown that the observations fall in line with the IPCC warming projection. See his post at Bob Tisdale says: January 21, 2014 at 8:42 am
@John, Bob, Don
No disrespect
but could you all stop looking at average global temps, ENSO, PDO, AMO, whatever
It does not work…
Start looking at maximum temperatures, i.e. evaluating energy that is let through the atmosphere.
http://blogs.24.com/henryp/2012/10/02/best-sine-wave-fit-for-the-drop-in-global-maximum-temperatures/
just me trying to set the record straight as William Arnold did in 1985
http://www.cyclesresearchinstitute.org/cycles-astronomy/arnold_theory_order.pdf
but up until now was ignored by everyone but me
http://blogs.24.com/henryp/2013/04/29/the-climate-is-changing/
btw does anyone here know what happened to William Arnold?
Bob Tisdale: Do you have any information on El Nino, La Nina, (ENSO), has not occurring about 5,000 BP, possibly back to the Younger Dryas about 13,000 BP? If so, and it was absent during any of those times, perhaps that deserves a further examination of what may drive ENSO. And yes, thank-you generally for the very good post, Rod Chilton Climatologist (http.www//bcclimate.com
Directed to Bob Tisdale: Overall a very good discussion, and I do think generally positive between you and Dr. Easterbrook. I have been doing some of my own research on both the PDO (see http//www.bcclimate.com) and the Younger Dryas. I came across some very interesting references (that I can provide if you are interested)? The crux of the matter is, that one of the references mentioned that El NINO was absent for a time 5,000 BP. Assuming that this was so, would not that be a good time to study further in hopes of determining something of the forcing that goes on of ENSO? Rod Chilton, climatologist.
CuMulus1 says: “Do you have any information on El Nino, La Nina, (ENSO), has not occurring about 5,000 BP, possibly back to the Younger Dryas about 13,000 BP?”
Nope. Have you checked the NOAA paleoclimatological data website?
http://www.ncdc.noaa.gov/data-access/paleoclimatology-data/datasets/paleoceanography
Even the sea surface temperature records of El Nino and La Nina events before 1950 are questionable. It’s likely the strengths of some El Nino events were under-reported then, and there was little ship traffic before the opening of the Panama Canal.
mysteryseeker says: “The crux of the matter is, that one of the references mentioned that El NINO was absent for a time 5,000 BP. Assuming that this was so, would not that be a good time to study further in hopes of determining something of the forcing that goes on of ENSO?”
It’s difficult at best to study sea surface temperature records before the satellite era–there’s so little source data for many parts of the globe–which is why I generally stick to the satellite era. And it works well, because that’s the period when manmade greenhouse gases are said (assumed) to be the cause of the warming.
Regards
John Finn says: “Bob Tisdale has already done this and shown that the observations fall in line with the IPCC warming projection.”
Actually, I don’t know the source of the model in Don’s graph and how he included it. Other model-data comparisons during that period show the models overestimating the warming. See:
http://bobtisdale.wordpress.com/2013/04/20/model-data-comparison-with-trend-maps-cmip5-ipcc-ar5-models-vs-new-giss-land-ocean-temperature-index/
And for that post I used GISS data.
Okay, I will bite.
You complain that climate scientists ignore your data/claims and attack you personally, but you fail to mention what response should they give someone who a) only uses “surface temperatures” when discussing Global Warming or b) is trying to pretend that “regional” temperature events like The Little Ice Age, The Medieval Warming Period, etc. have anything to do with “global”?
Only using surface temperatures indicates that you are a) ignorant of what “Global” means, or b) intentionally insulting people’s intelligence by pretending that cherry picking proves something other than A or C, or c) you are intentionally trying to deceive people by lying to them.
What would the response of a brain surgeon removing a brain tumor be to someone who shows up in the operating room and starts yelling that he is a quack because he has ignored a hangnail?
What would the response of a plumber fixing a leaking municipal pipe be to someone who shows up and starts yelling that he is a fraud trying to pad his bill at taxpayer’s expense because when he turned off the water feeding the pipe he is working on, was enough to stop the leak and thus no other billable work is needed?
Bob, I understand that you cannot say with absolute certainty which data Professor Easterbrook has used in the Fig 4 graph, but we do know that the post-2000 data is not from the same dataset as the pre-2000 data. We also know that if Professor Easterbrook updated the graph with a consistent set of data the graph would send a totally different message to the one Professor Easterbrook is intending.
Many commenters, including you, have praised the Professor for his ‘warming pause’ prediction. Don Easterbrook was, by no means the only person, to suggest that ocean influences explained at least some for the 1975-2000 and 1910-1940 warning. Several years ago I was banned from the Open Mind blog run by Grant Foster (Tamino) for daring to suggest that a modest warming in response increased CO2 concentrations had been amplified by natural factors.
I’m far from being on the CAGW side of the debate. This link shows an exchange between me and Michael Mann on the “hide the decline” issue with the hockey-stick graph. This took place in December 2004 – 5 years before “Climategate”.
http://www.realclimate.org/index.php/archives/2004/12/myths-vs-fact-regarding-the-hockey-stick/
As far as I’m concerned Mann and Don Easterbrook are, intentionally or not, guilty of exactly the same thing. They’ve both “mixed and matched” data to mislead their target audience.