Plus notes on the ARCUS sea ice forecasting contest
As I pointed out on September 16th in Sea Ice News Volume 4 Number 5: No ice free Arctic this year – it appears that Arctic sea ice has turned the corner sea ice has most definitely turned the corner now.
 Japan Aerospace Exploration Agency (JAXA) – International Arctic Research Center (IARC) – Click the pic to view at source
Details and raw data on this graph product here
From NSIDC, who finally made the call yesterday:
====================================================================
Arctic sea ice reaches lowest extent for 2013
On September 13, Arctic sea ice reached its likely minimum extent for 2013. The minimum ice extent was the sixth lowest* in the satellite record, and reinforces the long-term downward trend in Arctic ice extent. Sea ice extent will now begin its seasonal increase through autumn and winter. Meanwhile, in the Antarctic, sea ice extent reached a record high on September 18, tied with last year’s maximum.
Please note that this is a preliminary announcement. Changing winds could still push ice floes together, reducing ice extent further. NSIDC scientists will release a full analysis of the melt season in early October, once monthly data are available for September.
Overview of conditions

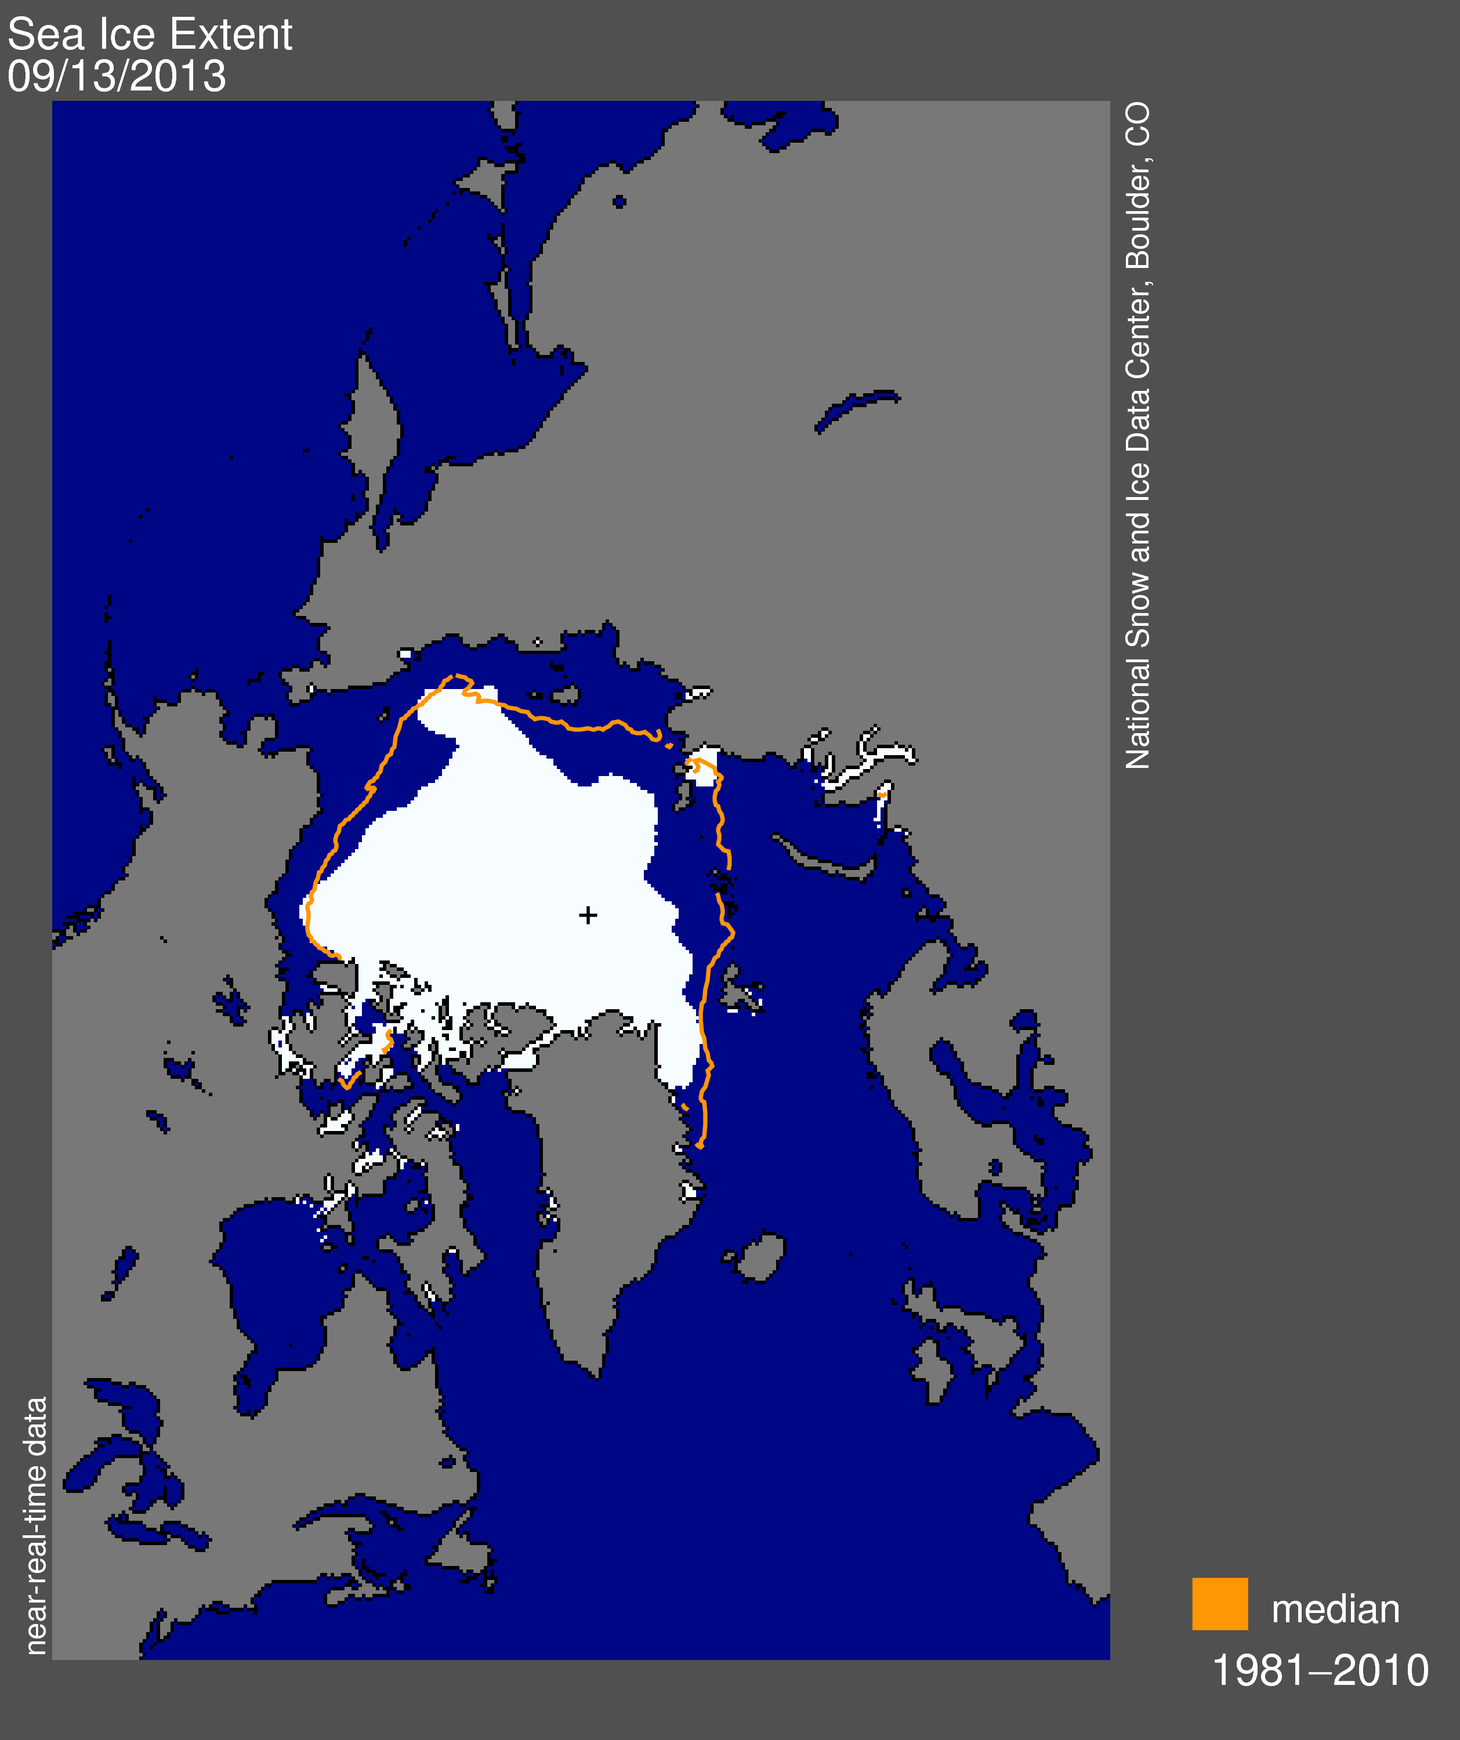
Figure 1. Arctic sea ice extent for September 13, 2013 was 5.10 million square kilometers (1.97 million square miles). The orange line shows the 1981 to 2010 median extent for that day. The black cross indicates the geographic North Pole. Sea Ice Index data. About the data
Credit: National Snow and Ice Data Center
On September 13, 2013, sea ice extent dropped to 5.10 million square kilometers (1.97 million square miles). This appears to have been the lowest extent of the year. In response to the setting sun and falling temperatures, ice extent will now climb through autumn and winter. However, a shift in wind patterns or a period of late season melt could still push the ice extent lower. The minimum extent was reached two days earlier than the 1981 to 2010 average minimum date of September 15.
Conditions in context

Figure 2. The graph above shows Arctic sea ice extent as of September 19, 2013, along with daily ice extent data for five previous years. 2013 is shown in blue, 2012 in green, 2011 in orange, 2010 in pink, 2009 in navy, and 2008 in purple. The 1981 to 2010 average is in dark gray. Sea Ice Index data.
Credit: National Snow and Ice Data Center
This year’s minimum was 1.69 million square kilometers (653,000 square miles) above the record minimum extent in the satellite era, which occurred on September 16, 2012, and 1.12 million square kilometers (432,000 square miles) below the 1981 to 2010 average minimum.
Varying distribution of ice in 2013 versus 2012

Figure 3. This image compares differences in ice-covered areas between September 13, 2013, the date of this year’s minimum, and September 16, 2012, the record low minimum extent. Light gray shading indicates the region where ice occurred in both 2013 and 2012, while white and dark gray areas show ice cover unique to 2013 and to 2012, respectively. Sea Ice Index data. About the data
Credit: National Snow and Ice Data Center
Comparing this year’s minimum extent to 2012, while extent was higher on average this year, there were variations from region to region. There was considerably higher sea ice extent in the Beaufort, Chukchi, and East Siberian sea regions, with the ice edge several hundred kilometers farther south compared to last year. This year the Canadian Archipelago also retained much more ice, keeping the Northwest Passage closed. The most notable area of less ice this year compared to last was off the east coast of Greenland, south of Fram Strait. Other small areas of decreased extent were found north of the Kara and Laptev seas.
See an animation of this summer’s sea ice extent produced by the NASA Scientific Visualization Studio at http://svs.gsfc.nasa.gov/goto?4104.
Previous minimum Arctic sea ice extents**
| YEAR | MINIMUM ICE EXTENT | DATE | |
|---|---|---|---|
| IN MILLIONS OF SQUARE KILOMETERS | IN MILLIONS OF SQUARE MILES | ||
| 2007 | 4.17 | 1.61 | September 18 |
| 2008 | 4.59 | 1.77 | September 20 |
| 2009 | 5.13 | 1.98 | September 13 |
| 2010 | 4.63 | 1.79 | September 21 |
| 2011 | 4.33 | 1.67 | September 11 |
| 2012 | 3.41 | 1.32 | September 16 |
| 2013 | 5.10 | 1.97 | September 13 |
| 1979 to 2000 average | 6.70 | 2.59 | September 13 |
| 1981 to 2010 average | 6.22 | 2.40 | September 15 |
* According to near-real-time data, this year’s minimum extent is slightly lower than 2009. However, the ranking between 2009 and 2013 is close, and may change once the final version of the data are processed. See our Frequently Asked Questions: Do your data undergo quality control? for more information about near-real-time data.
** Note that the dates and extents of the minimums have been re-calculated from what we posted in previous years; see our Frequently Asked Questions for more information.
====================================================================
The ARCUS sea ice forecasting contest
WUWT’s ARCUS Arctic sea ice forecast wasn’t far off the mark in June 2013, we actually did better than most with 4.8 million sqkm:
 for September 2013 sea ice extent (values are rounded to the tenths).")
Download High Resolution Version of Figure 1.
I had to laugh at the Met Office forecast. So much for supercomputer driven model skill.
WUWT didn’t participate in July due to scheduling conflicts with 4th of July holiday I had in making the deadline, but here are the entries:
 for September 2013 mean sea ice extent (values are rounded to the tenths).")
Download High Resolution Version of Figure 1.
The gloom and doom forecast of the Met Office didn’t change at 3.4, but it was bested by ultra-gloomer “Neven” at the Arctic Sea Ice Blog who said 3.2 would be the value.
WUWT did participate in August, essentially no change for the averaged top 5 vote.
Since ARCUS didn’t plot them, I’ve plotted all the participant forecasts below.

Figure 5: plot of September Arctic Sea Ice Extent Mean forecasts submitted to ARCUS in August 2013.
WUWT’s value is based on a weighted calculation of the top five vote getters in our poll here: http://wattsupwiththat.com/2013/08/11/sea-ice-news-volume-4-3-2013-sea-ice-forecast-contest/
The most popular value picked by WUWT readers was 5.0 msq/km 8.9% (94 votes), though it wasn’t a runaway vote, hence I opted for a weighted average of the top 5 vote getters.
The Met Office seems to have bowed out, and even at the late date, “Neven” was firmly in the gloom category again with 3.6.
The NCAR model ensemble guess didn’t do much better.
It should be noted that ARCUS has not made the final report yet, and that their forecast contest is based on the NSIDC September extent average, which has yet to be recorded. I’ll report that when it is available. Overall though, I’d say WUWT readers did better than gloomers, modelers, and of course, Wieslaw Maslowski.
Most certainly, even though the counter on the sidebar has not reached the Autumnal equinox indicating the end of summer, clearly Maslowski is falsified for 2013:
BBC – 12 December 2007
“Our projection of 2013 for the removal of ice in summer is not accounting for the last two minima, in 2005 and 2007,”…….”So given that fact, you can argue that may be our projection of 2013 is already too conservative.”
[Professor Wieslaw Maslowski]

Maslowski joins NASA’s Jay Zwally in the Hall of Lame:
National Geographic – 12 December 2007
“NASA climate scientist Jay Zwally said: “At this rate, the Arctic Ocean could be nearly ice-free at the end of summer by 2012, much faster than previous predictions.” ”
[Dr. Jay Zwally – NASA]
And of course, let’s not forget the Sierra Club:
Sierra Club – March 23, 2013
“For the record—I do not think that any sea ice will survive this summer. An event unprecedented in human history is today, this very moment, transpiring in the Arctic Ocean….”
[Paul Beckwith – PhD student paleoclimatology and climatology – part-time professor]

Source: http://www.sierraclub.ca/en/AdultDiscussionPlease
Read more on the ARCUS forecast here: http://www.arcus.org/search/seaiceoutlook
And of course, the WUWT sea ice reference page: http://wattsupwiththat.com/reference-pages/sea-ice-page/
jai mitchel,
from the link you gave me I had a look around at their ftp page and found this map showing a significant reduction in sea ice extent also from August in the year 1938. So, where did the Arctic feedback loop go after 1938? It’s a simple question.
Anybody else notice the ice breaker in the north pole web cam #2 ?
http://psc.apl.washington.edu/northpole/NPEO2013/18.jpg
The lens is too ice covered to tell the Flag of the ship, but it’s definitely an Ice Breaker.
I wonder if there is a correlation between the onset of new snow cover in Arctic land areas and the annual onset of sea ice growth? Change of subject … the pole cam is still providing images (after again thawing / having ice sublimate). Ship’s ahoy! An icebreaker entered the field of view today. Not sure whose it is.
RE: Tom Olsen says:
September 23, 2013 at 12:19 pm
THE SHIP’S SILHOUETTE RESEMBLES THAT OF THE NORWEGAN ICEBREAKER “H V SVALBARD” http://forsvaret.no/om-forsvaret/utstyrsfakta/sjo/Sider/Kystvaktens-fartoy-KV-Svalbard.aspx (The blogger “Billy Liar” pointed this out.)
That picture was the last. It was taken 0535z Saturday morning and there have been no pictures since. Usually it takes a picture every six hours.
I was hoping they were up there to fix the camera that got knocked over by the polar bear, but I now guess they picked up the cameras to use again next year. Those camera’s must cost a pretty penny, if it is worth hiring an ice breaker. Also the cameras the O-Buoy project uses across the pole are much better, and include time-laps films you can watch. You’d think they’d want their old camera sunk, and have to get a new one. I speculate money is running short, and they have to use the battered, old camera over again. (If they want to nip speculation in the bud, they ought to issue a statement on their site.)
Here’s the last picture: http://sunriseswansong.files.wordpress.com/2013/09/np-sep-21-c-18.jpg
Yep, looks like the pole cam is done for this year.
RE:James at 48 says:
September 24, 2013 at 3:13 pm
At least they left the barometer, thermometer and GPS in place, and that is giving us some interesting information about the Camera-site. It is about to cross 84 degrees north latitude for the eleventh time, since last April.
It took decades of hard work to identify the Transpolar Drift, and all that work, I think, is now being falsified. The Transpolar Drift only occurs for around half of a cycle which may or may not be sixty years long. Then, just as certain equatorial currents revert to counter-currents, the Transpolar Drift could change to a drift which I humbly suggest ought be named the “Caleb Counter Current.” (After all, all three words begin with the letter “C,” and the phrase does have a nice ring to it.)
I show the backward-motion of nearby buoys on drift-maps, at the bottom of my post at:
http://sunriseswansong.wordpress.com/2013/09/19/arctic-sea-ice-minimum-the-darkness-decends/ Or check out the “Navy drift map” on Anthony’s Sea Ice Page. It shows the Caleb Counter Current quite clearly, today (Tuesday, September 24.)
The Arctic is looking very chilly. Much of the Russian side of the coast has temps ranging from 23F to 5F, with large land areas inland also below 23F. The sea ice extent is growing at a good pace. In the last 4 days growth, the ice grew by 0.125 million sq km.