Plus notes on the ARCUS sea ice forecasting contest
As I pointed out on September 16th in Sea Ice News Volume 4 Number 5: No ice free Arctic this year – it appears that Arctic sea ice has turned the corner sea ice has most definitely turned the corner now.
 Japan Aerospace Exploration Agency (JAXA) – International Arctic Research Center (IARC) – Click the pic to view at source
Details and raw data on this graph product here
From NSIDC, who finally made the call yesterday:
====================================================================
Arctic sea ice reaches lowest extent for 2013
On September 13, Arctic sea ice reached its likely minimum extent for 2013. The minimum ice extent was the sixth lowest* in the satellite record, and reinforces the long-term downward trend in Arctic ice extent. Sea ice extent will now begin its seasonal increase through autumn and winter. Meanwhile, in the Antarctic, sea ice extent reached a record high on September 18, tied with last year’s maximum.
Please note that this is a preliminary announcement. Changing winds could still push ice floes together, reducing ice extent further. NSIDC scientists will release a full analysis of the melt season in early October, once monthly data are available for September.
Overview of conditions

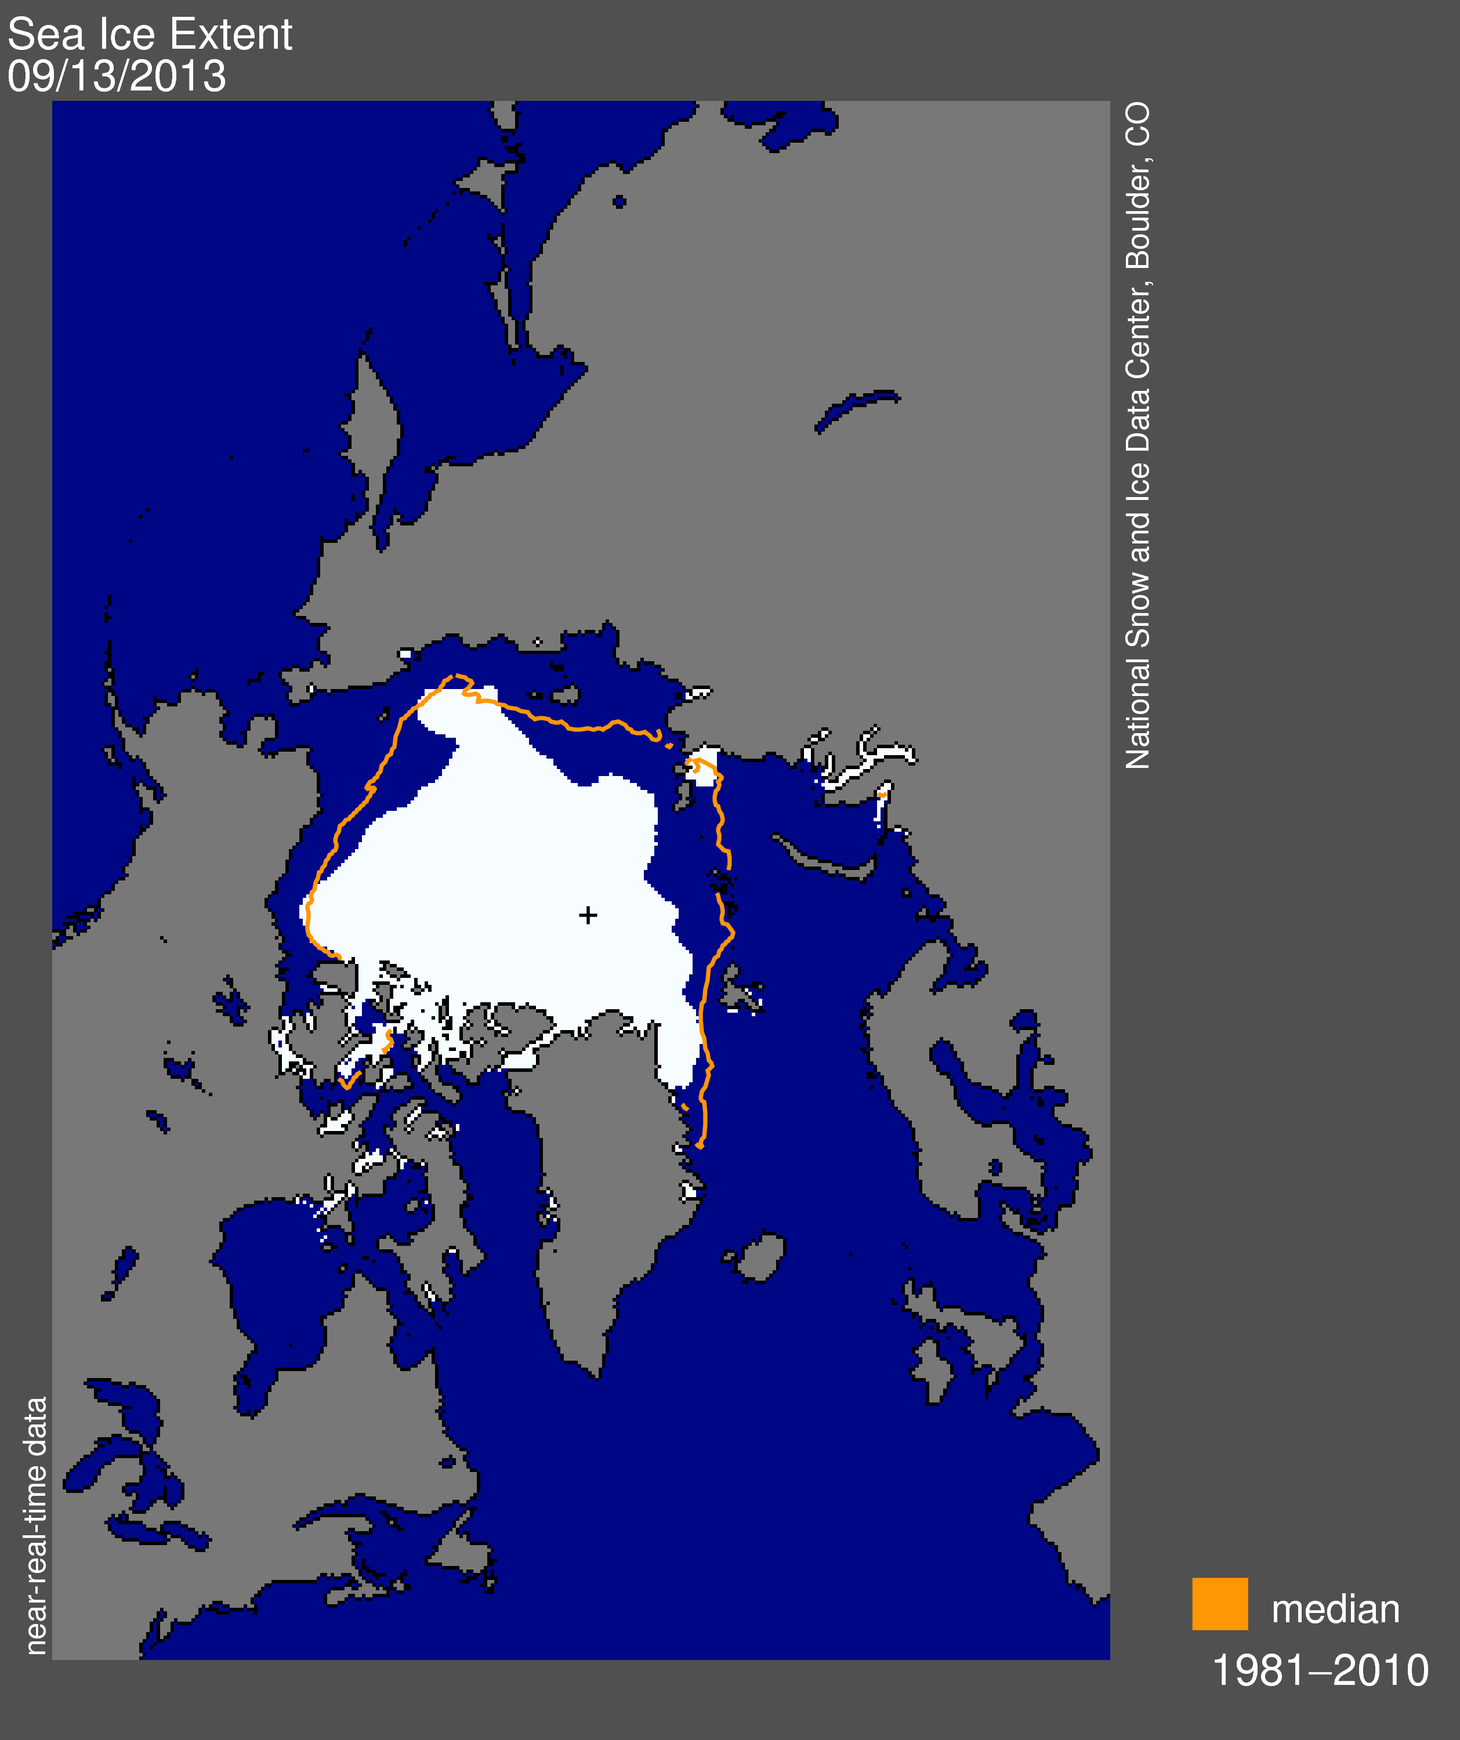
Figure 1. Arctic sea ice extent for September 13, 2013 was 5.10 million square kilometers (1.97 million square miles). The orange line shows the 1981 to 2010 median extent for that day. The black cross indicates the geographic North Pole. Sea Ice Index data. About the data
Credit: National Snow and Ice Data Center
On September 13, 2013, sea ice extent dropped to 5.10 million square kilometers (1.97 million square miles). This appears to have been the lowest extent of the year. In response to the setting sun and falling temperatures, ice extent will now climb through autumn and winter. However, a shift in wind patterns or a period of late season melt could still push the ice extent lower. The minimum extent was reached two days earlier than the 1981 to 2010 average minimum date of September 15.
Conditions in context

Figure 2. The graph above shows Arctic sea ice extent as of September 19, 2013, along with daily ice extent data for five previous years. 2013 is shown in blue, 2012 in green, 2011 in orange, 2010 in pink, 2009 in navy, and 2008 in purple. The 1981 to 2010 average is in dark gray. Sea Ice Index data.
Credit: National Snow and Ice Data Center
This year’s minimum was 1.69 million square kilometers (653,000 square miles) above the record minimum extent in the satellite era, which occurred on September 16, 2012, and 1.12 million square kilometers (432,000 square miles) below the 1981 to 2010 average minimum.
Varying distribution of ice in 2013 versus 2012

Figure 3. This image compares differences in ice-covered areas between September 13, 2013, the date of this year’s minimum, and September 16, 2012, the record low minimum extent. Light gray shading indicates the region where ice occurred in both 2013 and 2012, while white and dark gray areas show ice cover unique to 2013 and to 2012, respectively. Sea Ice Index data. About the data
Credit: National Snow and Ice Data Center
Comparing this year’s minimum extent to 2012, while extent was higher on average this year, there were variations from region to region. There was considerably higher sea ice extent in the Beaufort, Chukchi, and East Siberian sea regions, with the ice edge several hundred kilometers farther south compared to last year. This year the Canadian Archipelago also retained much more ice, keeping the Northwest Passage closed. The most notable area of less ice this year compared to last was off the east coast of Greenland, south of Fram Strait. Other small areas of decreased extent were found north of the Kara and Laptev seas.
See an animation of this summer’s sea ice extent produced by the NASA Scientific Visualization Studio at http://svs.gsfc.nasa.gov/goto?4104.
Previous minimum Arctic sea ice extents**
| YEAR | MINIMUM ICE EXTENT | DATE | |
|---|---|---|---|
| IN MILLIONS OF SQUARE KILOMETERS | IN MILLIONS OF SQUARE MILES | ||
| 2007 | 4.17 | 1.61 | September 18 |
| 2008 | 4.59 | 1.77 | September 20 |
| 2009 | 5.13 | 1.98 | September 13 |
| 2010 | 4.63 | 1.79 | September 21 |
| 2011 | 4.33 | 1.67 | September 11 |
| 2012 | 3.41 | 1.32 | September 16 |
| 2013 | 5.10 | 1.97 | September 13 |
| 1979 to 2000 average | 6.70 | 2.59 | September 13 |
| 1981 to 2010 average | 6.22 | 2.40 | September 15 |
* According to near-real-time data, this year’s minimum extent is slightly lower than 2009. However, the ranking between 2009 and 2013 is close, and may change once the final version of the data are processed. See our Frequently Asked Questions: Do your data undergo quality control? for more information about near-real-time data.
** Note that the dates and extents of the minimums have been re-calculated from what we posted in previous years; see our Frequently Asked Questions for more information.
====================================================================
The ARCUS sea ice forecasting contest
WUWT’s ARCUS Arctic sea ice forecast wasn’t far off the mark in June 2013, we actually did better than most with 4.8 million sqkm:
 for September 2013 sea ice extent (values are rounded to the tenths).")
Download High Resolution Version of Figure 1.
I had to laugh at the Met Office forecast. So much for supercomputer driven model skill.
WUWT didn’t participate in July due to scheduling conflicts with 4th of July holiday I had in making the deadline, but here are the entries:
 for September 2013 mean sea ice extent (values are rounded to the tenths).")
Download High Resolution Version of Figure 1.
The gloom and doom forecast of the Met Office didn’t change at 3.4, but it was bested by ultra-gloomer “Neven” at the Arctic Sea Ice Blog who said 3.2 would be the value.
WUWT did participate in August, essentially no change for the averaged top 5 vote.
Since ARCUS didn’t plot them, I’ve plotted all the participant forecasts below.

Figure 5: plot of September Arctic Sea Ice Extent Mean forecasts submitted to ARCUS in August 2013.
WUWT’s value is based on a weighted calculation of the top five vote getters in our poll here: http://wattsupwiththat.com/2013/08/11/sea-ice-news-volume-4-3-2013-sea-ice-forecast-contest/
The most popular value picked by WUWT readers was 5.0 msq/km 8.9% (94 votes), though it wasn’t a runaway vote, hence I opted for a weighted average of the top 5 vote getters.
The Met Office seems to have bowed out, and even at the late date, “Neven” was firmly in the gloom category again with 3.6.
The NCAR model ensemble guess didn’t do much better.
It should be noted that ARCUS has not made the final report yet, and that their forecast contest is based on the NSIDC September extent average, which has yet to be recorded. I’ll report that when it is available. Overall though, I’d say WUWT readers did better than gloomers, modelers, and of course, Wieslaw Maslowski.
Most certainly, even though the counter on the sidebar has not reached the Autumnal equinox indicating the end of summer, clearly Maslowski is falsified for 2013:
BBC – 12 December 2007
“Our projection of 2013 for the removal of ice in summer is not accounting for the last two minima, in 2005 and 2007,”…….”So given that fact, you can argue that may be our projection of 2013 is already too conservative.”
[Professor Wieslaw Maslowski]

Maslowski joins NASA’s Jay Zwally in the Hall of Lame:
National Geographic – 12 December 2007
“NASA climate scientist Jay Zwally said: “At this rate, the Arctic Ocean could be nearly ice-free at the end of summer by 2012, much faster than previous predictions.” ”
[Dr. Jay Zwally – NASA]
And of course, let’s not forget the Sierra Club:
Sierra Club – March 23, 2013
“For the record—I do not think that any sea ice will survive this summer. An event unprecedented in human history is today, this very moment, transpiring in the Arctic Ocean….”
[Paul Beckwith – PhD student paleoclimatology and climatology – part-time professor]

Source: http://www.sierraclub.ca/en/AdultDiscussionPlease
Read more on the ARCUS forecast here: http://www.arcus.org/search/seaiceoutlook
And of course, the WUWT sea ice reference page: http://wattsupwiththat.com/reference-pages/sea-ice-page/
Old newspaper reports often provide an insight or a good laugh when it comes to Arctic temperatures and ice extent.
e.g. a few Australian press reports …
http://trove.nla.gov.au/ndp/del/article/74081229 – Adelaide Advertiser April 1923:
Is the North Pole going to melt entirely? Are the Arctic regions warming up, with prospect of a great climatic change in that part of the world?
Science (says ‘Popular Science’) is asking these questions. Reports from fishermen, seal hunters, and explorers who sail the seas around Spitzbergen and the eastern Arctic all point to a radical change in climatic conditions, with hitherto unheard-of high temperatures on that part of the earth’s surface. Observations to that effect have covered the last five years during which the warmth has been steadily increasing. etc ….
http://trove.nla.gov.au/ndp/del/article/69638689 – Wodonga and Towong Sentinel September 1939:
Scientists have confirmed the fact that the Arctic regions around Spitzbergen are warming up at the rate of approximately one degree in every two years. Since 1910, when observations first started in those regions, the cumulative rise of winter temperature has amounted to nearly 16 degrees. etc …
http://trove.nla.gov.au/ndp/del/article/126972551 – Canberra Times January 1993:
Temperatures over the Arctic Ocean over the past 40 years have not shown the increase predicted by computer simulations that forecast global warming, according to a study.
The lack of an overall warming trend appeared in analysis of more than 27,000 recordings of temperature at the surface and various altitudes, made between 1950 and 1990. etc …
http://trove.nla.gov.au/ndp/del/article/127231000 – Canberra Times June 1993:
A layer of haze which appeared and thickened over the Arctic during the late 1970s and early 1960s appears to be thinning due to decreased industrial pollution. According to a report published in Geophysical Research Letters, scientists earlier had feared that the deepening layer of haze would store solar heat and lead to a rise in Arctic temperatures, worsening global warming. Virtually all the haze came from industrial smokestacks in Europe and the former Soviet Union.
The problem appears to have improved both because the former Soviet Union switched from coal and oil to cleaner-burning natural gas during the 1980s, and because western European nations clamped down on sulfur dioxide emissions to reduce acid rain.
Claude Harvey says:
September 21, 2013 at 12:33 pm
Whatever happened to that “green” fleet of sailboats caught in the North-West Passage this summer and reportedly awaiting rescue? I suggest naming that shivering band of adventurers, “The Wadhams Expedition”.
———————————–
Many of them made it through due to a break in conditions for exiting to the west. There some some who made it recently through on the east side, but that was probably with the help of an icebreaker.
Janice Moore says:
September 21, 2013 at 11:21 pm
——————————————
I still have some memories back to 1953 at 3 years of age.
So now that this is over in the Arctic for the moment, what is the latest date for the Antarctic peak sea ice? Can it grow into October?
Is this a downslope of a cycle or a real decline?
I don’t know. But the measurements we have only show the decline. They may not be long measurement’s but they are all we have.
Again, this doesn’t mean a thing – global sea ice would be the relevant statistic for global warming – but that is why the sea ice decline should be addressed as real instead of having to backtrack if the decline does continue.
Remember, there is a growth of urban settlements on rivers throughout Canada and Siberia. This change in the Arctic may well be manmade and permanent.
the great difference in ice extent between 2012 and 2013 suggests to me that the weather (temperature and storms) has a huge impact.
Hope somebody is doing a proper study of the two years along these lines.
tonyb
It’d be cool if someone could track all these failed predictions (including future predictions). Maybe have a link to it in Climate Failed Files or somewhere accessible.
Anthony, you are a hero. You clearly work very hard at this wonderful website of yours. You manage to triage an enormous volume of news and data for us, your grateful public. Having filtered it you then create articles with clarity, integrity and wit. I do hope that your wonderful work is rewarding. Future historians will celebrate you as a bastion of Reason at a time when Pseudoreligion was enjoying great success.
According to the following graph from the Sea ice Page –
http://www7320.nrlssc.navy.mil/hycomARC/navo/arcticictnowcast.gif
– we are expected to believe that around the North Pole Sea Ice, which was still over 2 meters – 7 feet – thick only two weeks ago, has melted down from one meter to almost nil by now.
How’s that?
Regarding the vast area concerned – at least 40,000 square kilometers – the alledged loss of ice roughly amounts to 20 to 30 cubic-KILOMETERS of ice being lost over mere 14 days – while the temps up there are well below freezing again, already.
I rather suspect that the satellites are measuring not loss of sea ice there, but melting ponts on top of still-existing sea ice.
Hey Jai, noticed your Piomas death spiral chart doesn’t include 2013. Might want to add it.
PIOMAS September 2013
Personally I think it’s too soon to declare a recovery. One year doesn’t make a trend. By 2016 we should have enough data to know if Ice volume is still declining or if it is stabilizing at this new area. The fact that Arctic sea ice MAXIMUM has been fairly stable for years would seem to indicate the latter.
What I have been wondering about is why it seems like Arctic sea ice area has become so much more Variable since about 2007.
NH Sea Ice Area Anomaly
Before 2007 it looks like yearly variability averaged about 1M sq km. Since 2007 it looks like about 2M sq km.
Alright, so we can’t model arctic sea ice a few months in advance worth a damn; but trust us, we can model the entire world’s climate decades out.
M Courtney says:
Is this a downslope of a cycle or a real decline?
I don’t know. But the measurements we have only show the decline. They may not be long measurement’s but they are all we have.
===
Indeed, it’s all we have but it is very high time resolution so we ought to be doing something a bit more relevant that drawing a bloody straight line through it all.
We are told that “global warming” is melting the ice. surface temps have been in ‘hiatus’ since circa y2k, so this should be reflected in the ice data, though it may take more than one year to play out. And guess what …
http://climategrog.wordpress.com/?attachment_id=521
I’m working on a more rigorous derivation but indications so far are a time const of 9y seems likely. There’s more to it than that and I’ll comment in more detail later, but it’s a first shot at getting beyond fitting physically meaningless linear regressions to every dataset and extrapolating 100 years beyond 30 years worth of actual data.
Yes , medium scale rate of change is negative and remains negative. But is has not been _constant_ for the last 34 years. It sped up , now it’s slowing down. One explanation would be a significant cyclic component. There are others. One thing the certainly does not fit the observational data is the idea of continued acceleration that would be the result of ‘tipping points’ , run-away warming or catastrophic collapse of arctic ice cover.
Once a dominant positive feedback is set in motion, it does not back off.
Roger A. Pielke Sr. says: September 21, 2013 at 12:43 pm
It is worth noting that the date of the end of the seasons melt, and beginning of the cold season expansion continues to change very little if at all. The reason this is important is that the added CO2 and other greenhouse gases does not yet (if it ever does) alter the dominance of the seasonal solar cooling with respect to when the sea ice recommences to freeze.
__________________________
Translation:
It’s the Sun, stupid…..
😉
jai mitchell says: @ur momisugly September 21, 2013 at 7:27 pm
Gail Combs
in your graph it shows, “years before present” at the bottom.
by convention, “present” is 1950 so your graph doesn’t show modern temperatures which are over .7 degrees C higher than your graph shows.
>>>>>>>>>>>>>
No they are not!
Quantifying The Size Of The USHCN Adjustment Fraud This shows 0.6 degrees C in recent “Adjustments” to the Temperature Data. And this shows the same for GISS GRAPH
This set ofGRAPHS showing the continuing data manipulations by GISS to get rid of the 1930’s high temperature record.
Köppen climate classification (using plants) The map also showing that 1900 to 1949 was higher compared to the 1975 to 1990 and that 1900 decade and the 1930 decade was as high or higher as the 1990 decade.
The CAGW crowd can only ‘WIN’ by the use of cheating and propaganda. When asked for the adjustments so they can be validated we get The Dog Ate My Homework and (Alternate link) and The Goat Ate My Data excuses. So by part of the scientific method, validate and verify, adjustments are invalid because they are not vetted by outsiders.
None of this is problem of course , because they still have the the old stand by , ‘will happen’ so if its not happened now it will some time in the future . Which of course is most useful because as it offers no time frame it cannot be disproved. Of course it also scientifically worthless but this is not an issue of science in the first place but of religions like certainty in ‘the punishment of evil doers’ .
Meanwhile, the Greenpeace boat is being towed to Murmansk, where a bus is waiting to take the crew to a very pleasant gulag. A court case has already been scheduled for 2019, and the Russians have agreed to make the judicial process as swift as possible.
http://www.theglobeandmail.com/news/national/russian-coast-guard-towing-greenpeace-ship-with-two-canadians/article14431977/
/sarc
Greg Goodman says: @ur momisugly September 21, 2013 at 9:06 pm
….this is yet another manifestation of fitting linear models to snippets of data from a system that anything but linear, and pretending it is representative of longer term behaviour. This fallacy has sadly become standard practice in the anti-science of climatology.
>>>>>>>>>>>>>>>>
BINGO!
As Doctor R.G. Brown has been at pains to point out we are looking at a chaotic system with ‘Strange Attractors’
More on Strange Attractors
http://www.stsci.edu/~lbradley/seminar/attractors.html
If you look at the NH Summer Energy: The Leading Indicator Graph from engineer, John Kehr (link to article) you see the Holocene is continuing at a relatively high temperature. That is clinging to one of the Strange Attractors despite a major but gradual fall in solar insolation.
As far as I can tell from the geologic evidence we have been darn lucky the temperature has been as mild as it has been for centuries since ‘Abrupt Climate Change’ is part of the geologic history of the earth and persistence at a higher temperature for long geologic periods rather rare during this current Ice Age. Vostok Graph Presently the earth is in a temporary warm period called an interglacial during a continuing Ice Age. (See WIKI – Greenhouse and Icehouse Earth)
The “tendencies of abrupt onset and great persistence” sure sounds like the Dr. Brown’s Strange Attractors in action doesn’t it?
M Courtney says: @ur momisugly September 22, 2013 at 1:01 am
….Remember, there is a growth of urban settlements on rivers throughout Canada and Siberia. This change in the Arctic may well be manmade and permanent.
>>>>>>>>>>>>>>>>>
Nothing is really permanent. Climate changes and people move. Think Anasazi and the Alexander Tytler Cycle.
Perhaps you would like to send a weblink of this article, highlighting the performance of the UK Met Office, to Will Hutton, heavyweight socialist journalist at the Guardian Newsaper (Will.hutton@guardian.co.uk), since he has written an article stating ‘we must trust scientific truth’ today (well, what he actually tries to mean is that we must trust that the IPCC is telling the truth, since he is doom-mongering as usual).
Perhaps you could cc it to the Editor Alan.rusbridger@guardian.co.uk as well? Not to mention the Prime Minister (camerond@parliament.uk), the Leader of Her Majesty’s Opposition (milibande@parliament.uk) and the Deputy Prime Minister and leader of the Liberal Democrats (cleggn@parliament.uk)?
In fact, it might be good to organise a blitz of these global warming coconspirators, fellow travellers or head-in-the-sand ostriches every time the scientists’ predictions are so far from measured reality??
Whatever it takes, 2000 emails over 10 years, if that’s what it takes.
After all, if the scientists end up being right, then WUWT will no doubt be acknowledging that, won’t they?
“This change in the Arctic may well be manmade and permanent” –
One wonders if that is a theory or just a guess. I do believe that it has already been soundly demonstrated that the weather just does whatever it damn well pleases. We are but an insignificance in comparison. There has yet to be demonstrated beyond doubt that we can have any effect at all apart from just taking up space.
You talk of lies jai mitchell. I have some simple questions:
Did the Arctic recover after the 1920s to 1940s Arctic Warm Period?
Was Man to blame?
If man was to blame then how come it recovered?
Sometimes the key to the future can be found in the past. Arctic feedback look went missing back then. What a con job.
Silver Ralph says: @ur momisugly September 22, 2013 at 3:26 am
Meanwhile, the Greenpeace boat is being towed to Murmansk, where a bus is waiting to take the crew to a very pleasant gulag. A court case has already been scheduled for 2019…
>>>>>>>>>>>>>>>>>>>
Continually kicking the Russian Bear in the rear and not expecting a reaction just goes to show how really stupid Greenpeace is. Especially when the Russians are in saber rattling mode due to Syria. I doubt other countries really want to get involved in trying to save a bunch of idiots who are trying for a Darwin Award but we will see.
Once they climbed onto that Russian oil rig they were OUT of international waters and onto Russian property. That the Russians previously escorted Greenpeace out of the area peacefully, AND that Greenpeace had applied three times for permission to enter the area and were refused, kinda kills the ‘International Waters’ defense since they already acknowledged that they were entering Russian controlled waters.
Greenpeace has been getting a ‘Free Pass’ for their
terrorist activitiessabotage for years. I think reality just bit them. Its about time.I am sure these members of Greenpeace will enjoy that nice warm Russian winter that will shortly be upon them. Perhaps they will join Mikhail Khodorkovsky who was sent to Murmansk Oblast “…Mikhail Khodorkovsky and his companion Platon Lebedev, convicted of fraud and tax evasion in a first trial in 2005, were found guilty of theft and money laundering over Yukos’ operations in a second trial on 30 December 2010….”
There is also this tidbit from the article.
Some how I do not see any dignitaries bothering to actually travel to the Arctic to argue the case if those members of Greenpeace are incarcerated in the nearest jail.
Correction:
….Sometimes the key to the future can be found in the past. Arctic feedback loop went missing back then. What a con job…..
rtj1211, has anyone started a blog about how woeful and inept the Met Office is? They should be hammered for their performance over the past 10 years or more. I think I heard last week that they just got a pay rise!
Has the good Professor Wieslaw Maslowski been contacted for comment? Or any of the others?