Plus notes on the ARCUS sea ice forecasting contest
As I pointed out on September 16th in Sea Ice News Volume 4 Number 5: No ice free Arctic this year – it appears that Arctic sea ice has turned the corner sea ice has most definitely turned the corner now.
 Japan Aerospace Exploration Agency (JAXA) – International Arctic Research Center (IARC) – Click the pic to view at source
Details and raw data on this graph product here
From NSIDC, who finally made the call yesterday:
====================================================================
Arctic sea ice reaches lowest extent for 2013
On September 13, Arctic sea ice reached its likely minimum extent for 2013. The minimum ice extent was the sixth lowest* in the satellite record, and reinforces the long-term downward trend in Arctic ice extent. Sea ice extent will now begin its seasonal increase through autumn and winter. Meanwhile, in the Antarctic, sea ice extent reached a record high on September 18, tied with last year’s maximum.
Please note that this is a preliminary announcement. Changing winds could still push ice floes together, reducing ice extent further. NSIDC scientists will release a full analysis of the melt season in early October, once monthly data are available for September.
Overview of conditions

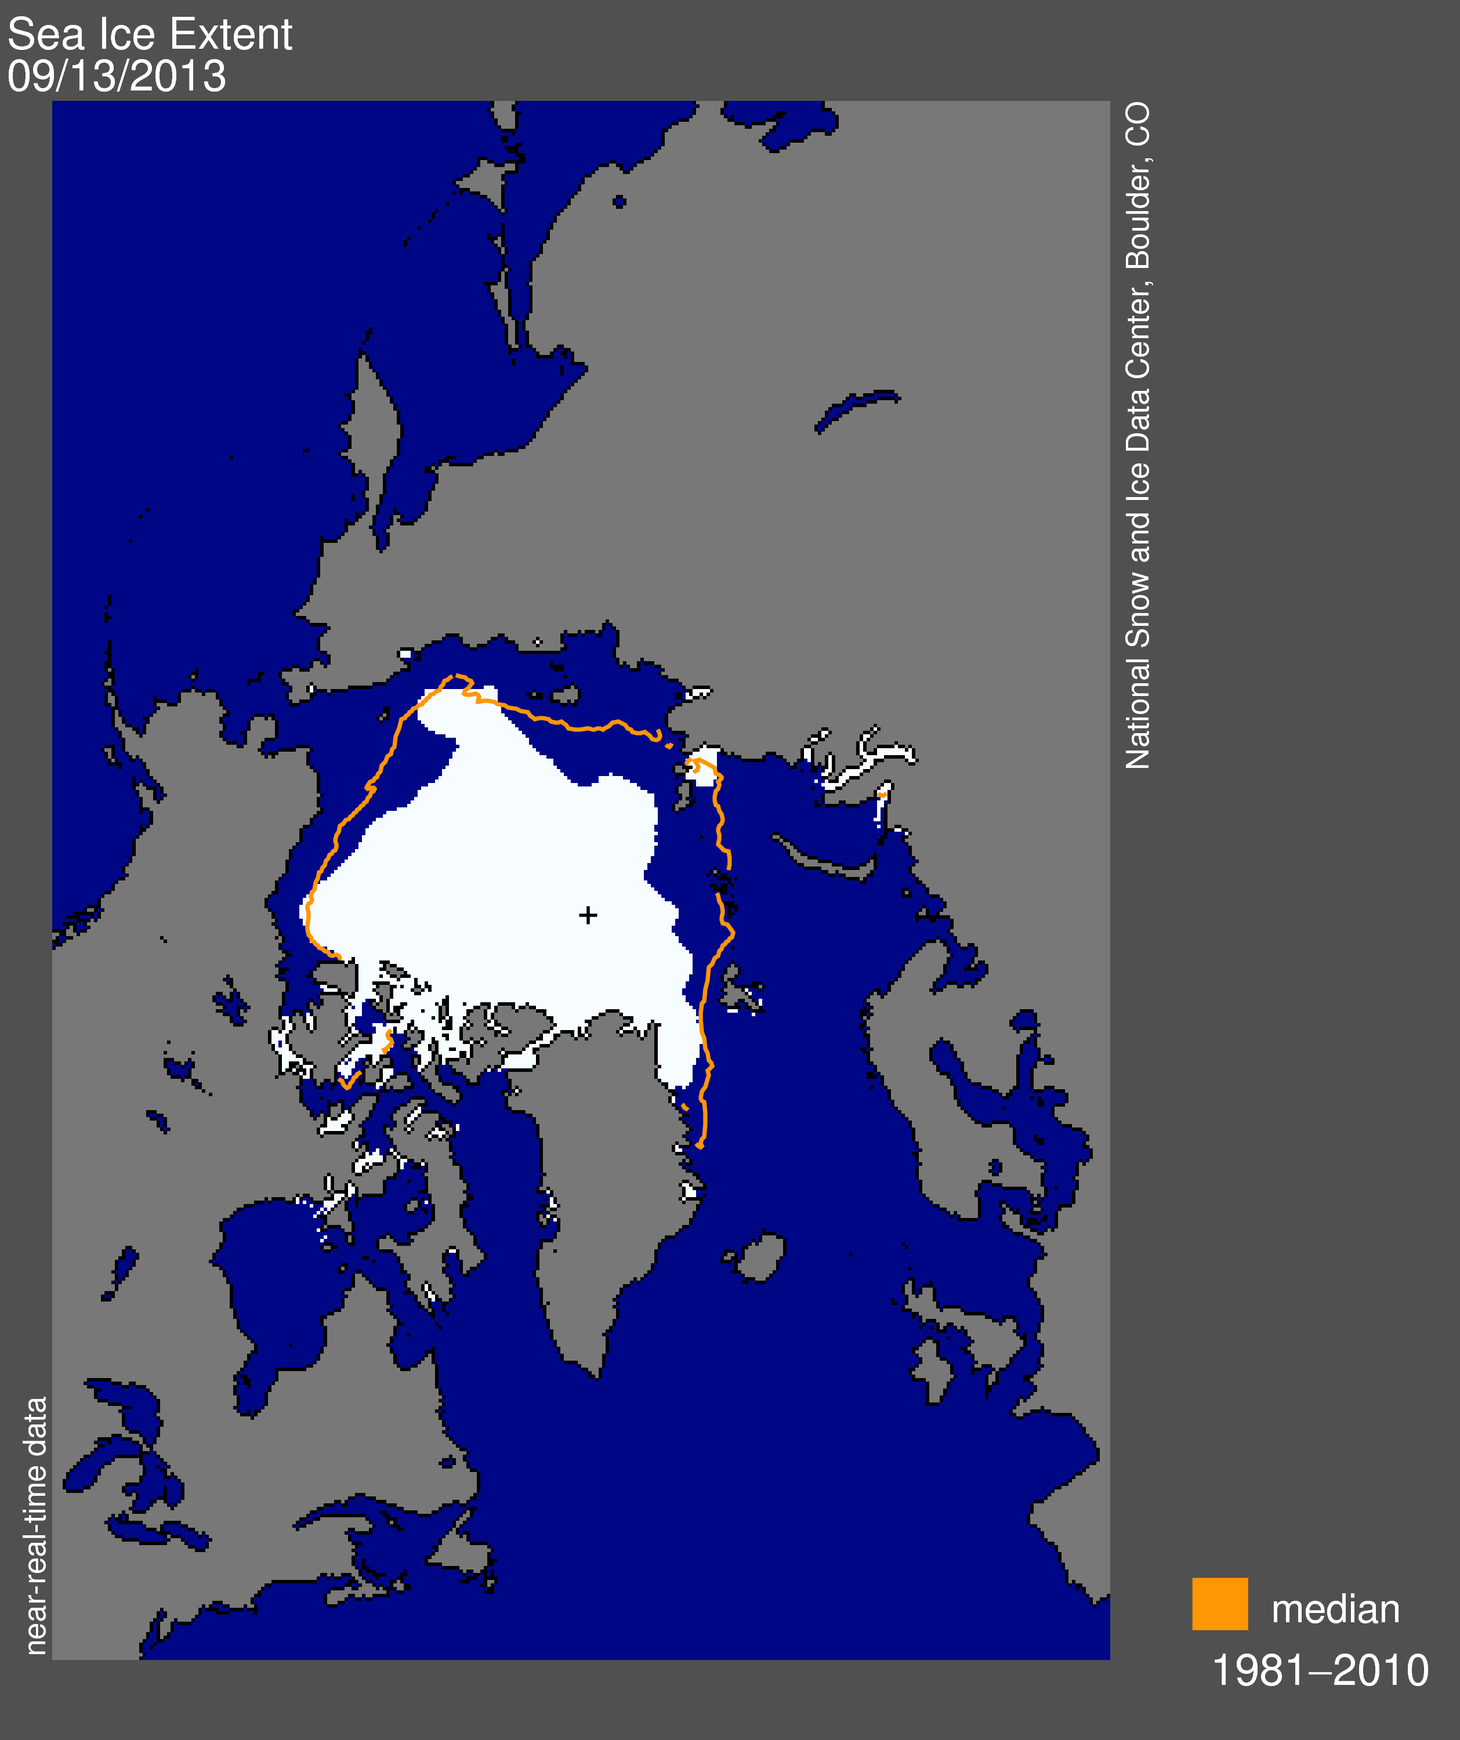
Figure 1. Arctic sea ice extent for September 13, 2013 was 5.10 million square kilometers (1.97 million square miles). The orange line shows the 1981 to 2010 median extent for that day. The black cross indicates the geographic North Pole. Sea Ice Index data. About the data
Credit: National Snow and Ice Data Center
On September 13, 2013, sea ice extent dropped to 5.10 million square kilometers (1.97 million square miles). This appears to have been the lowest extent of the year. In response to the setting sun and falling temperatures, ice extent will now climb through autumn and winter. However, a shift in wind patterns or a period of late season melt could still push the ice extent lower. The minimum extent was reached two days earlier than the 1981 to 2010 average minimum date of September 15.
Conditions in context

Figure 2. The graph above shows Arctic sea ice extent as of September 19, 2013, along with daily ice extent data for five previous years. 2013 is shown in blue, 2012 in green, 2011 in orange, 2010 in pink, 2009 in navy, and 2008 in purple. The 1981 to 2010 average is in dark gray. Sea Ice Index data.
Credit: National Snow and Ice Data Center
This year’s minimum was 1.69 million square kilometers (653,000 square miles) above the record minimum extent in the satellite era, which occurred on September 16, 2012, and 1.12 million square kilometers (432,000 square miles) below the 1981 to 2010 average minimum.
Varying distribution of ice in 2013 versus 2012

Figure 3. This image compares differences in ice-covered areas between September 13, 2013, the date of this year’s minimum, and September 16, 2012, the record low minimum extent. Light gray shading indicates the region where ice occurred in both 2013 and 2012, while white and dark gray areas show ice cover unique to 2013 and to 2012, respectively. Sea Ice Index data. About the data
Credit: National Snow and Ice Data Center
Comparing this year’s minimum extent to 2012, while extent was higher on average this year, there were variations from region to region. There was considerably higher sea ice extent in the Beaufort, Chukchi, and East Siberian sea regions, with the ice edge several hundred kilometers farther south compared to last year. This year the Canadian Archipelago also retained much more ice, keeping the Northwest Passage closed. The most notable area of less ice this year compared to last was off the east coast of Greenland, south of Fram Strait. Other small areas of decreased extent were found north of the Kara and Laptev seas.
See an animation of this summer’s sea ice extent produced by the NASA Scientific Visualization Studio at http://svs.gsfc.nasa.gov/goto?4104.
Previous minimum Arctic sea ice extents**
| YEAR | MINIMUM ICE EXTENT | DATE | |
|---|---|---|---|
| IN MILLIONS OF SQUARE KILOMETERS | IN MILLIONS OF SQUARE MILES | ||
| 2007 | 4.17 | 1.61 | September 18 |
| 2008 | 4.59 | 1.77 | September 20 |
| 2009 | 5.13 | 1.98 | September 13 |
| 2010 | 4.63 | 1.79 | September 21 |
| 2011 | 4.33 | 1.67 | September 11 |
| 2012 | 3.41 | 1.32 | September 16 |
| 2013 | 5.10 | 1.97 | September 13 |
| 1979 to 2000 average | 6.70 | 2.59 | September 13 |
| 1981 to 2010 average | 6.22 | 2.40 | September 15 |
* According to near-real-time data, this year’s minimum extent is slightly lower than 2009. However, the ranking between 2009 and 2013 is close, and may change once the final version of the data are processed. See our Frequently Asked Questions: Do your data undergo quality control? for more information about near-real-time data.
** Note that the dates and extents of the minimums have been re-calculated from what we posted in previous years; see our Frequently Asked Questions for more information.
====================================================================
The ARCUS sea ice forecasting contest
WUWT’s ARCUS Arctic sea ice forecast wasn’t far off the mark in June 2013, we actually did better than most with 4.8 million sqkm:
 for September 2013 sea ice extent (values are rounded to the tenths).")
Download High Resolution Version of Figure 1.
I had to laugh at the Met Office forecast. So much for supercomputer driven model skill.
WUWT didn’t participate in July due to scheduling conflicts with 4th of July holiday I had in making the deadline, but here are the entries:
 for September 2013 mean sea ice extent (values are rounded to the tenths).")
Download High Resolution Version of Figure 1.
The gloom and doom forecast of the Met Office didn’t change at 3.4, but it was bested by ultra-gloomer “Neven” at the Arctic Sea Ice Blog who said 3.2 would be the value.
WUWT did participate in August, essentially no change for the averaged top 5 vote.
Since ARCUS didn’t plot them, I’ve plotted all the participant forecasts below.

Figure 5: plot of September Arctic Sea Ice Extent Mean forecasts submitted to ARCUS in August 2013.
WUWT’s value is based on a weighted calculation of the top five vote getters in our poll here: http://wattsupwiththat.com/2013/08/11/sea-ice-news-volume-4-3-2013-sea-ice-forecast-contest/
The most popular value picked by WUWT readers was 5.0 msq/km 8.9% (94 votes), though it wasn’t a runaway vote, hence I opted for a weighted average of the top 5 vote getters.
The Met Office seems to have bowed out, and even at the late date, “Neven” was firmly in the gloom category again with 3.6.
The NCAR model ensemble guess didn’t do much better.
It should be noted that ARCUS has not made the final report yet, and that their forecast contest is based on the NSIDC September extent average, which has yet to be recorded. I’ll report that when it is available. Overall though, I’d say WUWT readers did better than gloomers, modelers, and of course, Wieslaw Maslowski.
Most certainly, even though the counter on the sidebar has not reached the Autumnal equinox indicating the end of summer, clearly Maslowski is falsified for 2013:
BBC – 12 December 2007
“Our projection of 2013 for the removal of ice in summer is not accounting for the last two minima, in 2005 and 2007,”…….”So given that fact, you can argue that may be our projection of 2013 is already too conservative.”
[Professor Wieslaw Maslowski]

Maslowski joins NASA’s Jay Zwally in the Hall of Lame:
National Geographic – 12 December 2007
“NASA climate scientist Jay Zwally said: “At this rate, the Arctic Ocean could be nearly ice-free at the end of summer by 2012, much faster than previous predictions.” ”
[Dr. Jay Zwally – NASA]
And of course, let’s not forget the Sierra Club:
Sierra Club – March 23, 2013
“For the record—I do not think that any sea ice will survive this summer. An event unprecedented in human history is today, this very moment, transpiring in the Arctic Ocean….”
[Paul Beckwith – PhD student paleoclimatology and climatology – part-time professor]

Source: http://www.sierraclub.ca/en/AdultDiscussionPlease
Read more on the ARCUS forecast here: http://www.arcus.org/search/seaiceoutlook
And of course, the WUWT sea ice reference page: http://wattsupwiththat.com/reference-pages/sea-ice-page/
geran “Reality: Antarctic ice is near record levels since satellites began tracking.”
All time record was set September 14th and it may get broken again.
http://sunshinehours.wordpress.com/2013/09/16/antarctica-sea-ice-extent-all-time-record-maximum-on-sept-14-2013/
http://sunshinehours.wordpress.com/2013/09/21/52nd-daily-record-of-year-for-antarctic-sea-ice-extent-on-sept-20th/
dbstealey
you can say it is a lie but the PIOMAS model has been verified by satellite data (cryostat-2)
you can call it a lie because you don’t agree with it, but the real lie is to say that sea ice in the arctic has “recovered” because it is tied with levels seen only 4 years ago (but still 1/5th of the average values seen between 1979 and 2000)
Remember, the average curve that you see today includes dates through 2010 which has the 2007 value added in.
btw, thanks for adding a picture, the one that I tried to link (which is perfectly safe by the way, use your virus checker) has a gompertz trend line that lets it drag out a bit at the trailing end.
correction: *1/2 of the 1979-2000 average*
but remember, the extent is 1/2 the average but the thickness of that ice is also 1/2 of the thickness of 1979-2000
so 1/4 of the total ice compared to the minimums found in the 1980s.
Gail Combs
in your graph it shows, “years before present” at the bottom.
by convention, “present” is 1950 so your graph doesn’t show modern temperatures which are over .7 degrees C higher than your graph shows.
Jai.. You need to understand that people here now just by-pass your posts as meaningless rants,
as they have always been.
You are wasting your time and the blog’s space.
Nobody reads or follows your posts or links.
“Release The Kraken.”
😉
RE: M Courtney says:
September 21, 2013 at 12:39 pm
——————
Let’s not get carried away here.
The long-term trend in Arctic Ice is till, most definitely, down.
Personally, I don’t think that means a thing… but it will not surprise me if the Arctic is ice-free in my lifetime.
———————————
You are noting a short term trend, not a long term. That is since 1979, which is half a cycle. The cycles are 60-70 years for Arctic Ice. as was noted, IPCC had levels before 1979 which were lower, but they have now chosen to cherry pick from 1979.
“Until it turns for enough years to cause the trend line to change direction, the NSIDC will be able to continue making their claim whether anyone likes it or not.”
Well it has changes “direction”, though it has not yet changed sign.
http://judithcurry.com/2013/09/16/inter-decadal-variation-in-northern-hemisphere-sea-ice/
The NSIDC statement is misleading because this years ice is above the straight line long term trend therefore, even though one year can make little difference either way, factually it REDUCES the long term trend and does NOT reinforce it.
Their statement is factually incorrect.
AndyG55,
You are exactly right: jai mitchell must be living on a different planet, because his emotional, fear-based rants have nothing to do with the real world we live in.
For example, his PIOMAS chart shows a ridiculous, exponentially declining Arctic ice cover — when in fact, satellite data shows a 60% increase in Arctic ice in just the past year alone. That is known as ‘natural climate variability’. The climate is never static. If it was, then there would never be declines or rises in polar ice.
But there is no reasoning with True Believers like jai mitchell. His mind is made up, and closed tighter than a drumskin. His belief is based on visceral emotion; never on facts, or data, or logic, or the Scientific Method, or the Null hypothesis, or Occam’s Razor, or anything else quantified and measured in the real world. His Belief is based only on fear. He is a frightened individual. He is simply a scaredy-cat. jai mitchell is afraid of things that don’t exist.
Empirical evidence always trumps computer ‘models’. The empirical [real world] evidence shows conclusively that the catastrophic global warming scare is complete nonsense. But try telling that to deluded AGW cultists like jai mitchell. Their beliefs are emotion-based, and as such, reason cannot cause them to change their minds. They Believe, and that is enough for them. There is no room for thinking when emotion-based Belief is involved.
People used to be burned at the stake for expressing any doubts that the witch doctors stated. I used to think those days were far behind us. But I am beginning to think I may have been wrong. People like jai mitchell would gladly execute unBelievers like scientific skeptics, in order to keep their version of reality unchallenged. My own fear is that scoundrels like mitchell might get into positions of power. There is no telling how insanely, murderously destructive they could be. Fortunately, there is the internet. But there are now people with an agenda, who want to eliminate even this last bastion of free speech…
…how would you like jai mitchell calling the [literal] shots? Scary, eh?
Why did you take an average of top five vote getters for the contest? Why not the average of ALL votes? It would have made for a better forecast…
dbstealey says…
“For example, his PIOMAS chart shows a ridiculous, exponentially declining Arctic ice cover”
That chart does not show ice cover at all.
AndyG55 (to jai) “Nobody reads or follows your posts or links.”
Not only do you read them you reply to them. That makes your statement totally self-contradictory and patently untrue.
I’m sure jai will be reassured that not only do you read his comments you think they are important enough to reply to. LOL
I’ve read papers suggesting a lack of correlation between PDO/AMO warm cycles and Arctic ice loss, however, I find it interesting that when the PDO entered its 30-yr cool cycle in 2008, Arctic Ice Extents on the Pacific side of the Arctic starting setting record highs, and when the AMO entered its 30-yr warm cycle in 1995, that’s when the Arctic started losing ice.
I know that correlation doesn’t equate to causation, but intuitively, it would seem that warm PDOs/AMOs would dump more heat in the Arctic under the 2nd Law of Thermodynamics and less heat during PDO/AMO cool cycles, as we now seem to be seeing on the Pacific side of the Arctic.
I’d greatly appreciate any cryogenic expert to explain why 30-yr PDO/AMO cool cycles don’t necessarily lead to more Arctic Ice.
BTW, my guess for the Arctic Ice Minumum was 4.9 million KM^2. Not too shabby..
Cheers!
Richard Vada says:
September 21, 2013 at 5:59 pm
Magic Gais,
Ya’w!
====
jai mitchell says:
September 21, 2013 at 10:51 am
In a single picture
__________________________
Richard, your accent- isn’t that Texas hill country, while Jai- well, don’t you wonder if he’ll ever catch on?
Gerald Machnee: “You are noting a short term trend, not a long term. That is since 1979, which is half a cycle. The cycles are 60-70 years for Arctic Ice. as was noted, IPCC had levels before 1979 which were lower, but they have now chosen to cherry pick from 1979.
”
Yes this is yet another manifestation of fitting linear models to snippets of data from a system that anything but linear, and pretending it is representative of longer term behaviour. This fallacy has sadly become standard practice in the anti-science of climatology.
It is pretty obvious that detailed observations started almost exactly at the recent maximum of arctic ice cover, we are now approaching the minimum:
http://climategrog.wordpress.com/?attachment_id=521
Bill,Caleb , re. Beaufort gyre.
Someone using the moniker AK made a similar comment on my Curry article. Maybe more attention should be given to the regional displacement of the ice mass. I identified what looks like a rectified circa 11y cycle in ice area data:
http://climategrog.files.wordpress.com/2013/09/art_nh_ice_area_short_anom_2007_wkg.png
Perhaps this is related to regular variations in the flow of water in and out of the Arctic Ocean principally via the Fram Straight.
Although there was a skip between 1997-2007, that pattern reappears with the same frequency and phase by 2007. The regularity and form would seem to suggest a celestial origin rather than internal oscillation.
Is this evidence of a long term tidal phenomenon?
No Greg, I read his name. and skipped the rest.
The density difference at the thermocline is about three orders smaller than that of the air/water interface. That would lead us to expect tidal “waves” (not tsunami sense) on a scale of years to be present in the thermocline.
Despite the fact that we tend to observe the vertical displacement, tides are longitudinal waves involving huge horizontal movement of water mass…. and with it heat energy.
LOL, Andy and Greg — Jai is FUN!
Here’s to you, Magic Jai …
(someday, get off the bus and join us in mind as well as body!)
Magic Jai’s Bus
I’m amazed that the UK Met Office forecast was a miss even though they gave an estimate with +/- 1.5 million sq. km. So even with a 3.0 million sq. km range they didn’t get it right. Of course they were too low.
It’s not as bad as they thought.
What should the Arctic Ice look like today? Higher, lower, or the same as the 1960’s-1970’s cold period.
We’re now just over 30 years out of that era. You might want to get a coat and prepare for the inevitable ride back down the sine wave..
Dear D. B.,
I see your point about Envirostalinists (at 8:21pm). (shudder) Nevertheless, take heart, O Valiant Mo-d-e-r-ator. There is still electability… . Hm. There is such a thing as stealing votes (in JM’s home town, Seattle, esp. bad), too… . Well, anyway, cheer up! With the bowing wooden-headed puppet who’s been to all 57 states (not counting Alaska and Hawaii and 2 or 3 more)
teleprompter-reading community organizer in the White House…………. WE HAVE NOWHERE TO GO, BUT UP! #(:))
Thanks again for making WUWT a great place (and a much more pleasant place!) to learn,
Janice
Samaurai: “I’ve read papers suggesting a lack of correlation between PDO/AMO warm cycles and Arctic ice loss..”
Since it is REAL actual temperatures that melt ice I’m not too surprised that these ‘detrended’ and mixed up indices do not correlate with ice coverage.
http://climategrog.wordpress.com/?attachment_id=521
I looked at the additive effect of SST and extra-tropical N. Atlantic fitted very closely to ice area. N.Pacific and the region between Norway and Greenland fitted notably less well, with recent similarity but also significant divergence.
Since the major opening of the of the Arctic Ocean is to the Atlantic, this would suggest oceanic link is more important than atmospheric, Also the deviations form SST in the immediate vicinity may indicate deeper water (which is warmer in the Arctic) maybe more of a factor that SST.
See above comments on tidal variations in the thermocline.
I had the right idea with my first thought. I had said that 2013 would follow the 2009 trajectory. Then I had the bright thought that the record cool summer up there might leave more ice, so I voted for 5.3 mil/sq km. So much for bright thoughts on that one, but I did learn a bit watching how it changed.
Hey, Goldminor — how are you doing? I hope all is well. I learned much by reading about the Arctic (current and past) on the threads here on WUWT, also.
And I just learned what an excellent memory you have — WOW! I voted, but, have only the vaguest memory of the exact number. Congratulations on a wonderful gift.