Plus notes on the ARCUS sea ice forecasting contest
As I pointed out on September 16th in Sea Ice News Volume 4 Number 5: No ice free Arctic this year – it appears that Arctic sea ice has turned the corner sea ice has most definitely turned the corner now.
 Japan Aerospace Exploration Agency (JAXA) – International Arctic Research Center (IARC) – Click the pic to view at source
Details and raw data on this graph product here
From NSIDC, who finally made the call yesterday:
====================================================================
Arctic sea ice reaches lowest extent for 2013
On September 13, Arctic sea ice reached its likely minimum extent for 2013. The minimum ice extent was the sixth lowest* in the satellite record, and reinforces the long-term downward trend in Arctic ice extent. Sea ice extent will now begin its seasonal increase through autumn and winter. Meanwhile, in the Antarctic, sea ice extent reached a record high on September 18, tied with last year’s maximum.
Please note that this is a preliminary announcement. Changing winds could still push ice floes together, reducing ice extent further. NSIDC scientists will release a full analysis of the melt season in early October, once monthly data are available for September.
Overview of conditions

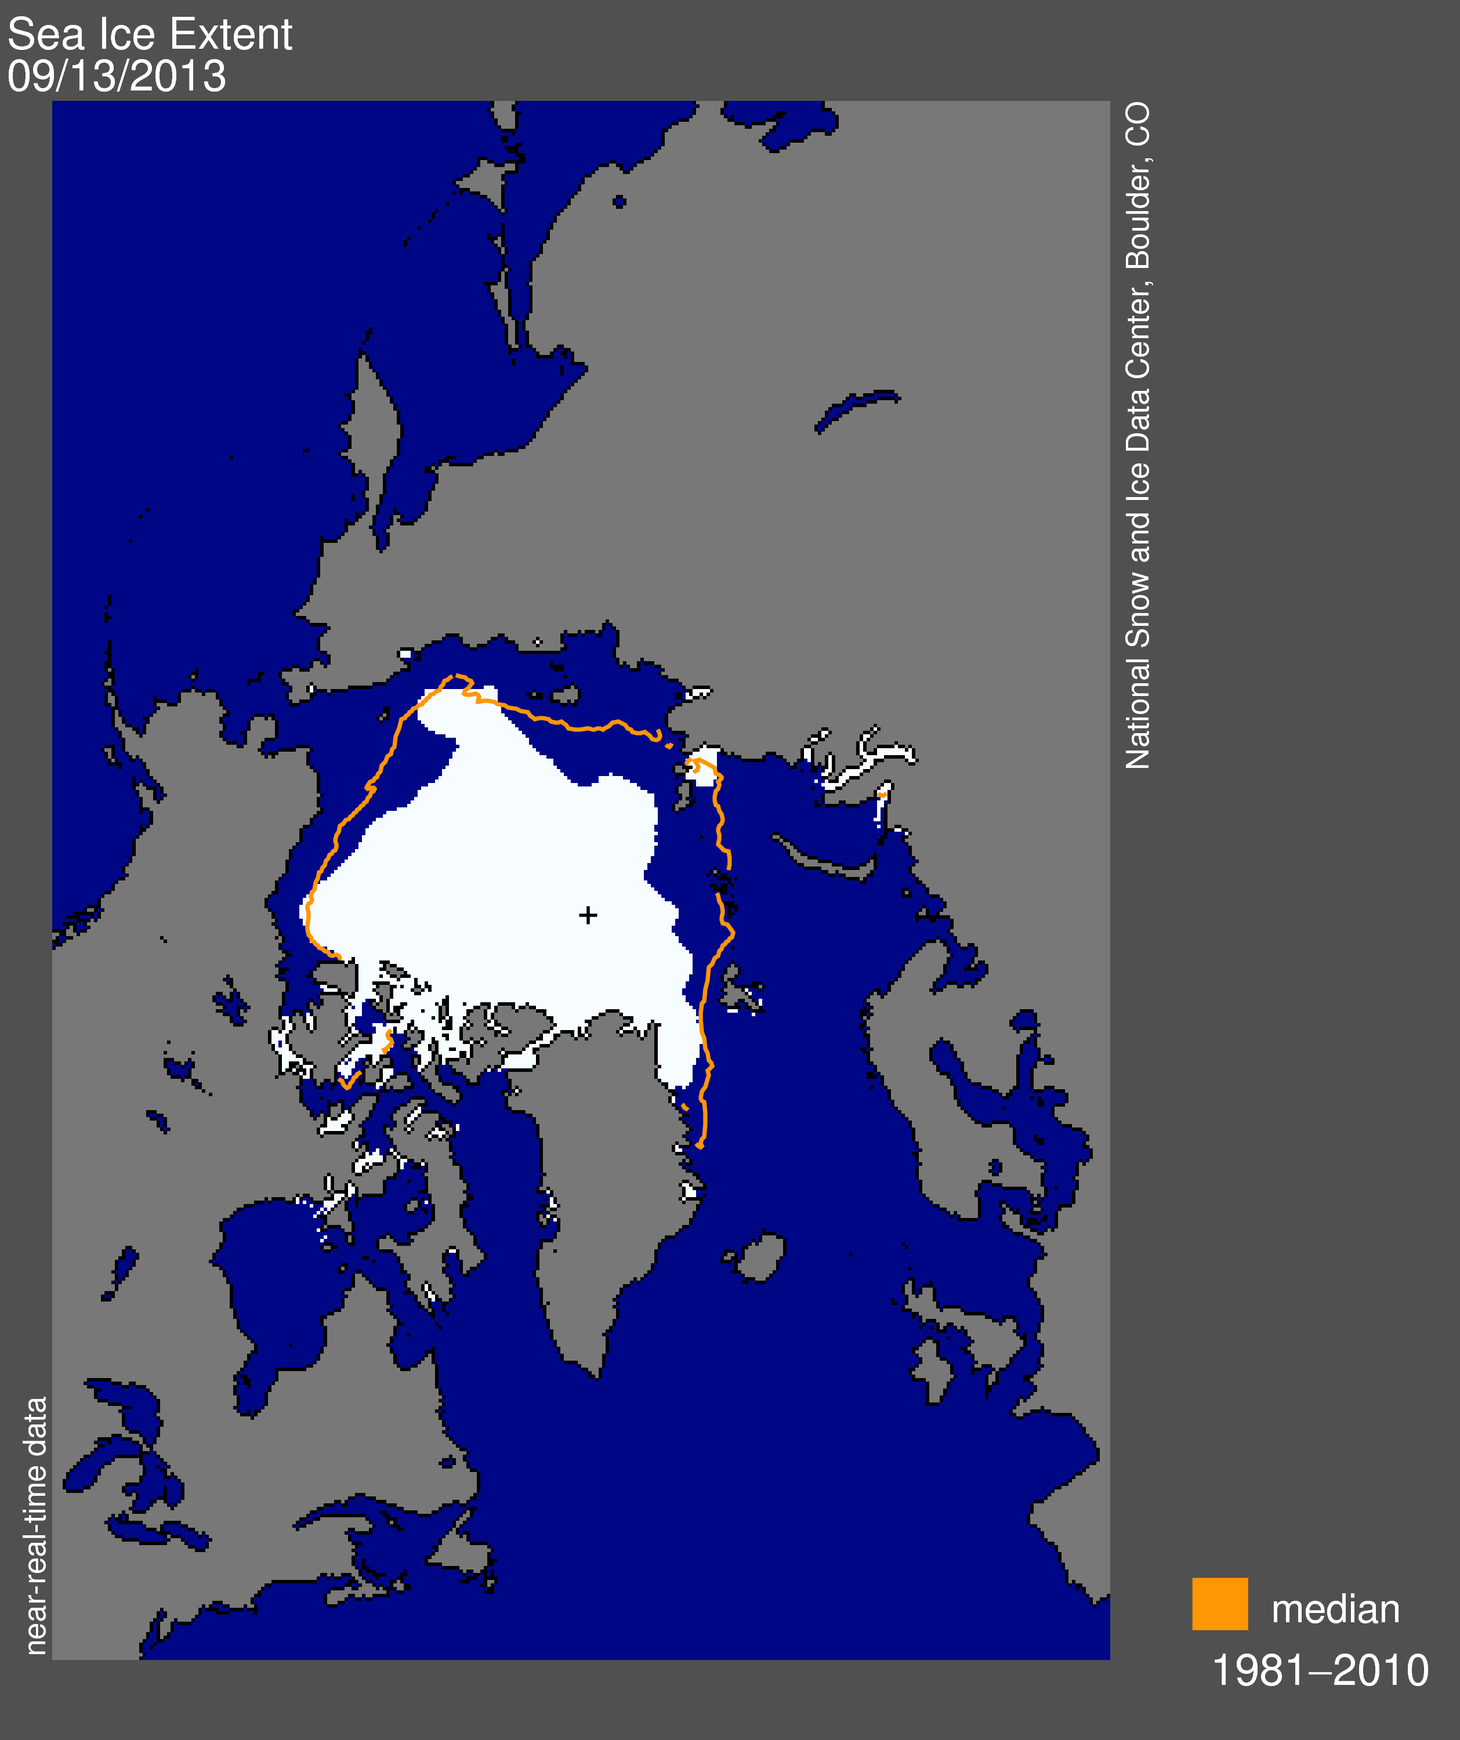
Figure 1. Arctic sea ice extent for September 13, 2013 was 5.10 million square kilometers (1.97 million square miles). The orange line shows the 1981 to 2010 median extent for that day. The black cross indicates the geographic North Pole. Sea Ice Index data. About the data
Credit: National Snow and Ice Data Center
On September 13, 2013, sea ice extent dropped to 5.10 million square kilometers (1.97 million square miles). This appears to have been the lowest extent of the year. In response to the setting sun and falling temperatures, ice extent will now climb through autumn and winter. However, a shift in wind patterns or a period of late season melt could still push the ice extent lower. The minimum extent was reached two days earlier than the 1981 to 2010 average minimum date of September 15.
Conditions in context

Figure 2. The graph above shows Arctic sea ice extent as of September 19, 2013, along with daily ice extent data for five previous years. 2013 is shown in blue, 2012 in green, 2011 in orange, 2010 in pink, 2009 in navy, and 2008 in purple. The 1981 to 2010 average is in dark gray. Sea Ice Index data.
Credit: National Snow and Ice Data Center
This year’s minimum was 1.69 million square kilometers (653,000 square miles) above the record minimum extent in the satellite era, which occurred on September 16, 2012, and 1.12 million square kilometers (432,000 square miles) below the 1981 to 2010 average minimum.
Varying distribution of ice in 2013 versus 2012

Figure 3. This image compares differences in ice-covered areas between September 13, 2013, the date of this year’s minimum, and September 16, 2012, the record low minimum extent. Light gray shading indicates the region where ice occurred in both 2013 and 2012, while white and dark gray areas show ice cover unique to 2013 and to 2012, respectively. Sea Ice Index data. About the data
Credit: National Snow and Ice Data Center
Comparing this year’s minimum extent to 2012, while extent was higher on average this year, there were variations from region to region. There was considerably higher sea ice extent in the Beaufort, Chukchi, and East Siberian sea regions, with the ice edge several hundred kilometers farther south compared to last year. This year the Canadian Archipelago also retained much more ice, keeping the Northwest Passage closed. The most notable area of less ice this year compared to last was off the east coast of Greenland, south of Fram Strait. Other small areas of decreased extent were found north of the Kara and Laptev seas.
See an animation of this summer’s sea ice extent produced by the NASA Scientific Visualization Studio at http://svs.gsfc.nasa.gov/goto?4104.
Previous minimum Arctic sea ice extents**
| YEAR | MINIMUM ICE EXTENT | DATE | |
|---|---|---|---|
| IN MILLIONS OF SQUARE KILOMETERS | IN MILLIONS OF SQUARE MILES | ||
| 2007 | 4.17 | 1.61 | September 18 |
| 2008 | 4.59 | 1.77 | September 20 |
| 2009 | 5.13 | 1.98 | September 13 |
| 2010 | 4.63 | 1.79 | September 21 |
| 2011 | 4.33 | 1.67 | September 11 |
| 2012 | 3.41 | 1.32 | September 16 |
| 2013 | 5.10 | 1.97 | September 13 |
| 1979 to 2000 average | 6.70 | 2.59 | September 13 |
| 1981 to 2010 average | 6.22 | 2.40 | September 15 |
* According to near-real-time data, this year’s minimum extent is slightly lower than 2009. However, the ranking between 2009 and 2013 is close, and may change once the final version of the data are processed. See our Frequently Asked Questions: Do your data undergo quality control? for more information about near-real-time data.
** Note that the dates and extents of the minimums have been re-calculated from what we posted in previous years; see our Frequently Asked Questions for more information.
====================================================================
The ARCUS sea ice forecasting contest
WUWT’s ARCUS Arctic sea ice forecast wasn’t far off the mark in June 2013, we actually did better than most with 4.8 million sqkm:
 for September 2013 sea ice extent (values are rounded to the tenths).")
Download High Resolution Version of Figure 1.
I had to laugh at the Met Office forecast. So much for supercomputer driven model skill.
WUWT didn’t participate in July due to scheduling conflicts with 4th of July holiday I had in making the deadline, but here are the entries:
 for September 2013 mean sea ice extent (values are rounded to the tenths).")
Download High Resolution Version of Figure 1.
The gloom and doom forecast of the Met Office didn’t change at 3.4, but it was bested by ultra-gloomer “Neven” at the Arctic Sea Ice Blog who said 3.2 would be the value.
WUWT did participate in August, essentially no change for the averaged top 5 vote.
Since ARCUS didn’t plot them, I’ve plotted all the participant forecasts below.

Figure 5: plot of September Arctic Sea Ice Extent Mean forecasts submitted to ARCUS in August 2013.
WUWT’s value is based on a weighted calculation of the top five vote getters in our poll here: http://wattsupwiththat.com/2013/08/11/sea-ice-news-volume-4-3-2013-sea-ice-forecast-contest/
The most popular value picked by WUWT readers was 5.0 msq/km 8.9% (94 votes), though it wasn’t a runaway vote, hence I opted for a weighted average of the top 5 vote getters.
The Met Office seems to have bowed out, and even at the late date, “Neven” was firmly in the gloom category again with 3.6.
The NCAR model ensemble guess didn’t do much better.
It should be noted that ARCUS has not made the final report yet, and that their forecast contest is based on the NSIDC September extent average, which has yet to be recorded. I’ll report that when it is available. Overall though, I’d say WUWT readers did better than gloomers, modelers, and of course, Wieslaw Maslowski.
Most certainly, even though the counter on the sidebar has not reached the Autumnal equinox indicating the end of summer, clearly Maslowski is falsified for 2013:
BBC – 12 December 2007
“Our projection of 2013 for the removal of ice in summer is not accounting for the last two minima, in 2005 and 2007,”…….”So given that fact, you can argue that may be our projection of 2013 is already too conservative.”
[Professor Wieslaw Maslowski]

Maslowski joins NASA’s Jay Zwally in the Hall of Lame:
National Geographic – 12 December 2007
“NASA climate scientist Jay Zwally said: “At this rate, the Arctic Ocean could be nearly ice-free at the end of summer by 2012, much faster than previous predictions.” ”
[Dr. Jay Zwally – NASA]
And of course, let’s not forget the Sierra Club:
Sierra Club – March 23, 2013
“For the record—I do not think that any sea ice will survive this summer. An event unprecedented in human history is today, this very moment, transpiring in the Arctic Ocean….”
[Paul Beckwith – PhD student paleoclimatology and climatology – part-time professor]

Source: http://www.sierraclub.ca/en/AdultDiscussionPlease
Read more on the ARCUS forecast here: http://www.arcus.org/search/seaiceoutlook
And of course, the WUWT sea ice reference page: http://wattsupwiththat.com/reference-pages/sea-ice-page/
It doesn’t reinforce it; it’s “not inconsistent with.” That’s how scientists would have phrased it.
Booker chimes in.
http://www.telegraph.co.uk/earth/environment/globalwarming/10324738/The-ice-is-not-melting-yet-still-the-scaremongers-blunder-on.html
“The Met Office seems to have bowed out, and even at the late date, “Neven” was firmly in the gloom category again with 3.6.”
Maybe he thought he ‘voting’ on ice _area_ LOL.
So much for the uban myth : Neven the ice expert. He’s so busy trying to talk down the ice extent so that he can say he’s right about CAGW, he’s totally lost the plot.
*sigh* In previous WUWT polls, I was too optimistic & voted 5.0 M sq. km. This year, anticipating another storm like in 2012, I voted more conservatively, 4.0 M sq.km. I’m doing about as well as an IPCC computer model….maybe I could rent my brain out?
” and reinforces the long-term downward trend in Arctic ice extent. ”
On what planet? This years extent goes against a downward trend.
Whoever wrote and authorized this press release should be fired..
and funding for the agency should be cut till they act responsibly.
@Anthony, I keep asking how good the satellites are doing at measuring ice, and, *crickets*.
So, here’s an odd coincidence; the SST frozen listed by the DMI (http://ocean.dmi.dk/arctic/satellite/plots/satsst.arc.d-00.png) is a much larger area that the ice listed by anyone and looks remarkably like the anamaly line in NSIDC’s sea ice extent (http://nsidc.org/data/seaice_index/images/daily_images/N_bm_extent.png) How does anyone know that the old 1970s era satellites were actually good a differentiating an ice signal from a freezing point signal? In other words, could we already be back at a 1970s type polar ice area if the old satellites gave more credit for ice than the current ones?
Whadams in an interview.
The 2013 extent is 60% higher than 2012. Did it return? You decide.
One thing that happened this year is the Beaufort Sea “clockwise” Gyre restarted after not being very prominent in the last few years.
This moved more multi-year ice to the western Beaufort where it has more chance to survive the melt season rather than getting moved to the Eastern Arctic where it just gets flushed out the Fram Strait by the prevailing ocean currents and melts in warmer water.
Two very good animations which make this quite clear. The second being the early March 2013 “Crackopalyspe” which had the warmers all excited but was merely restarting what is the normal circulation pattern of Arctic sea ice.
http://www.youtube.com/watch?v=9YWX7ChjtxY
RE: Daryl M says:
September 21, 2013 at 12:14 pm
I was watching those two maps as well, and agree they made the ice look very thin, especially at the start of the ice season. I started to scratch my head as summer crawled by and the thin ice just swirled about and never got thinner. WUWT? It is one reason I think the water is colder, especially down at 200-400 feet. Even when we had a couple of midsummer gales right atop the pole, the thin ice didn’t melt away, as it seemingly did during the storm the summer before.
Now we are facing several more months where there will be an above normal area of open water on the Eurasian side of the Pole. All that water is getting a double dose of cooling-to-depth. Therefore I expect air temperatures to again be cooler than normal up there, next summer.
I noticed, like you, that far less ice got flushed out through Fram Strait. Instead the ice has been pushed over to the Beaufort Gyre, which looks to be rebuilding its ice mass, as long as the PDO stays cold and doesn’t inject warm water from the Aleutian side of the Bering Strait.
What we may be seeing is the second half of a sixty year cycle starting to manifest. For the thirty years the ice dwindled, and now for thirty years it may well increase. The cool thing is that, while I am a rank amateur next to the scientists who have deeply studied the dwindling of ice, they don’t know so much about the dynamics of how ice grows, for back when it last happened there were no satellites, people tended to use sled dogs and dirigibles more, and anyway, there was a small matter called World War Two and its aftermath to attend to. In other words, we are seeing something never truly seen before, in the amazing ways we are now able to see.
We are standing at a new frontier. I think that is awesome, and refuse to allow anyone to spoil my pleasure with their numskull politics.
As agent Smart puts it “chief, miss by this much” ( showing an inch or so with his finger). May be that is how the MetOffice should put it even if the miss were millions of sq km.
Last year the North Pacific was very cold, but in the Chukchi sea part of the Arctic ocean – the part nearest the Pacific, there was record ice melt.
This year North Pacific temperatures are quite high, but we get dramatic recovery of Chukchi sea ice in summer.
I’m confused – Bob Tisdale, any comment?
rogerknights says:
September 21, 2013 at 1:28 pm
” and reinforces the long-term downward trend in Arctic ice extent. ”
It doesn’t reinforce it; it’s “not inconsistent with.” That’s how scientists would have phrased it.
You’re being pedantic, but I prefer your wording over that of the NSIDC. People can debate the merits of the words “long-term”, but if you consider the context of the “trend”, you can’t argue that for the duration of the satellite record, the arctic ice extent has been decreasing. Until it turns for enough years to cause the trend line to change direction, the NSIDC will be able to continue making their claim whether anyone likes it or not.
Warmist: “The Arctic sea ice will all be gone in 2013.”
Reality: The sea ice is above minimums of 3 years since 2000.
Warmist: “Well, the TOTAL polar ice is declining”.
Reality: Antarctic ice is near record levels since satellites began tracking.
Warmist: “Well, sea ice is not an indicator anyway!”
Reality: There are some folks that do not seek TRUTH.
From Sierra Club: “This is abrupt climate change in real-time.”
What? Climate is real-time?
Who pays this twit?
I see the Ice Desk (http://pafc.arh.noaa.gov/ice.php) states that Chukchi sea temperatures are up to 4C warmer than usual this year, so they are expecting slow ice formation. However, careful inspection of the Sea Surface Temperature & Anomaly charts (replicated on the Sea Ice page here) shows that the temperature equals the anomaly for all Arctic waters cooler than 6C. Evidently their tack for those waters is that the baseline shall be ice at 0C. That’ll teach those deniers!
Jimbo says on September 21, 2013 at 11:28 am
Just 2 years to go!
That’s always how it goes with those in the prognostication and divination business.
If you perform daily rain dances, eventually it will rain. Presto! You, clever shaman, created the rain!
geran says perceptively at September 21, 2013 at 3:18 pm
There are some folks that do not seek TRUTH.
Correct. Those in public office are called POLITICIANS, those in academia are called LYSENKOIST.
If ANYONE needs confirmation that PIOMAS lies with charts, check out the bogus graph posted by jai mitchell. That is the kind of scary chart that frightens weak-kneed folks like jai mitchell above.
Keep in mind that Arctic ice has increased by 60% since last year — and that Antarctic ice cover is still increasing, continuing its multi-decadal, non-stop rise.
The ONLY way the alarmist contingent can argue is by outright lying, and the PIOMAS graph posed by jai mitchell proves it.
When you have to lie to win your argument… you lose.
I predict Paul Beckwith will rake in record funding this year.
Seriously.
Peter Ward says:
September 21, 2013 at 12:01 pm
To me, the most relevant thing here is that the 2013 line is within the 2sd area. This means “move along, nothing to see here”. We’re back to normal.
>>>>>>>>>>>>>>>>>>
That is the comment I have been posting lately on Alarmist news stories with writers that wouldn’t know statistics if it took a good chunk out of their ….
Anything is possible says:
September 21, 2013 at 1:23 pm
… The current interglacial has lasted 12,000 years
They have 34 years worth of data.
How the [self snip] do you determine long-term trends from 34 years worth of data?
>>>>>>>>>>>>
By ignoring the past which shows there are cycles.
Long term we are cooling down from the Holocene Optimum. Graph
I wasn’t really being pedantic, because the distinction in wording is a distinction with a difference. (A one-year increase in extent doesn’t (and can’t) reinforce a downward trend in extent–especially not such a sharp increase as the one seen this year.)
Marcos @ur momisugly 12.36
I believe 1979 was the start of the satellite age of measuring the artic ice. What is also interesting is that 1979 also was one of the years with the most ice ever measured. It has been all down hill from then. It would be interesting if they used the chart you mentioned from 1973. There would be much less panic by certain misguided people.
Magic Gais,
Ya’w!
====
jai mitchell says:
September 21, 2013 at 10:51 am
In a single picture
This statement jumped out at me, as obviously it did for others.
In fact, this year reinforces the theory that there is no straight line decline, only that we have passed a low part of the long-term climate cycle that everyone who knows anything about climate is already aware of.
I enjoy seeing people get publicity on these ridiculous and ignorant statements, it will make it easier for them to choose to fade into the woodwork once the fraud is exposed for all to see.