Plus notes on the ARCUS sea ice forecasting contest
As I pointed out on September 16th in Sea Ice News Volume 4 Number 5: No ice free Arctic this year – it appears that Arctic sea ice has turned the corner sea ice has most definitely turned the corner now.
 Japan Aerospace Exploration Agency (JAXA) – International Arctic Research Center (IARC) – Click the pic to view at source
Details and raw data on this graph product here
From NSIDC, who finally made the call yesterday:
====================================================================
Arctic sea ice reaches lowest extent for 2013
On September 13, Arctic sea ice reached its likely minimum extent for 2013. The minimum ice extent was the sixth lowest* in the satellite record, and reinforces the long-term downward trend in Arctic ice extent. Sea ice extent will now begin its seasonal increase through autumn and winter. Meanwhile, in the Antarctic, sea ice extent reached a record high on September 18, tied with last year’s maximum.
Please note that this is a preliminary announcement. Changing winds could still push ice floes together, reducing ice extent further. NSIDC scientists will release a full analysis of the melt season in early October, once monthly data are available for September.
Overview of conditions

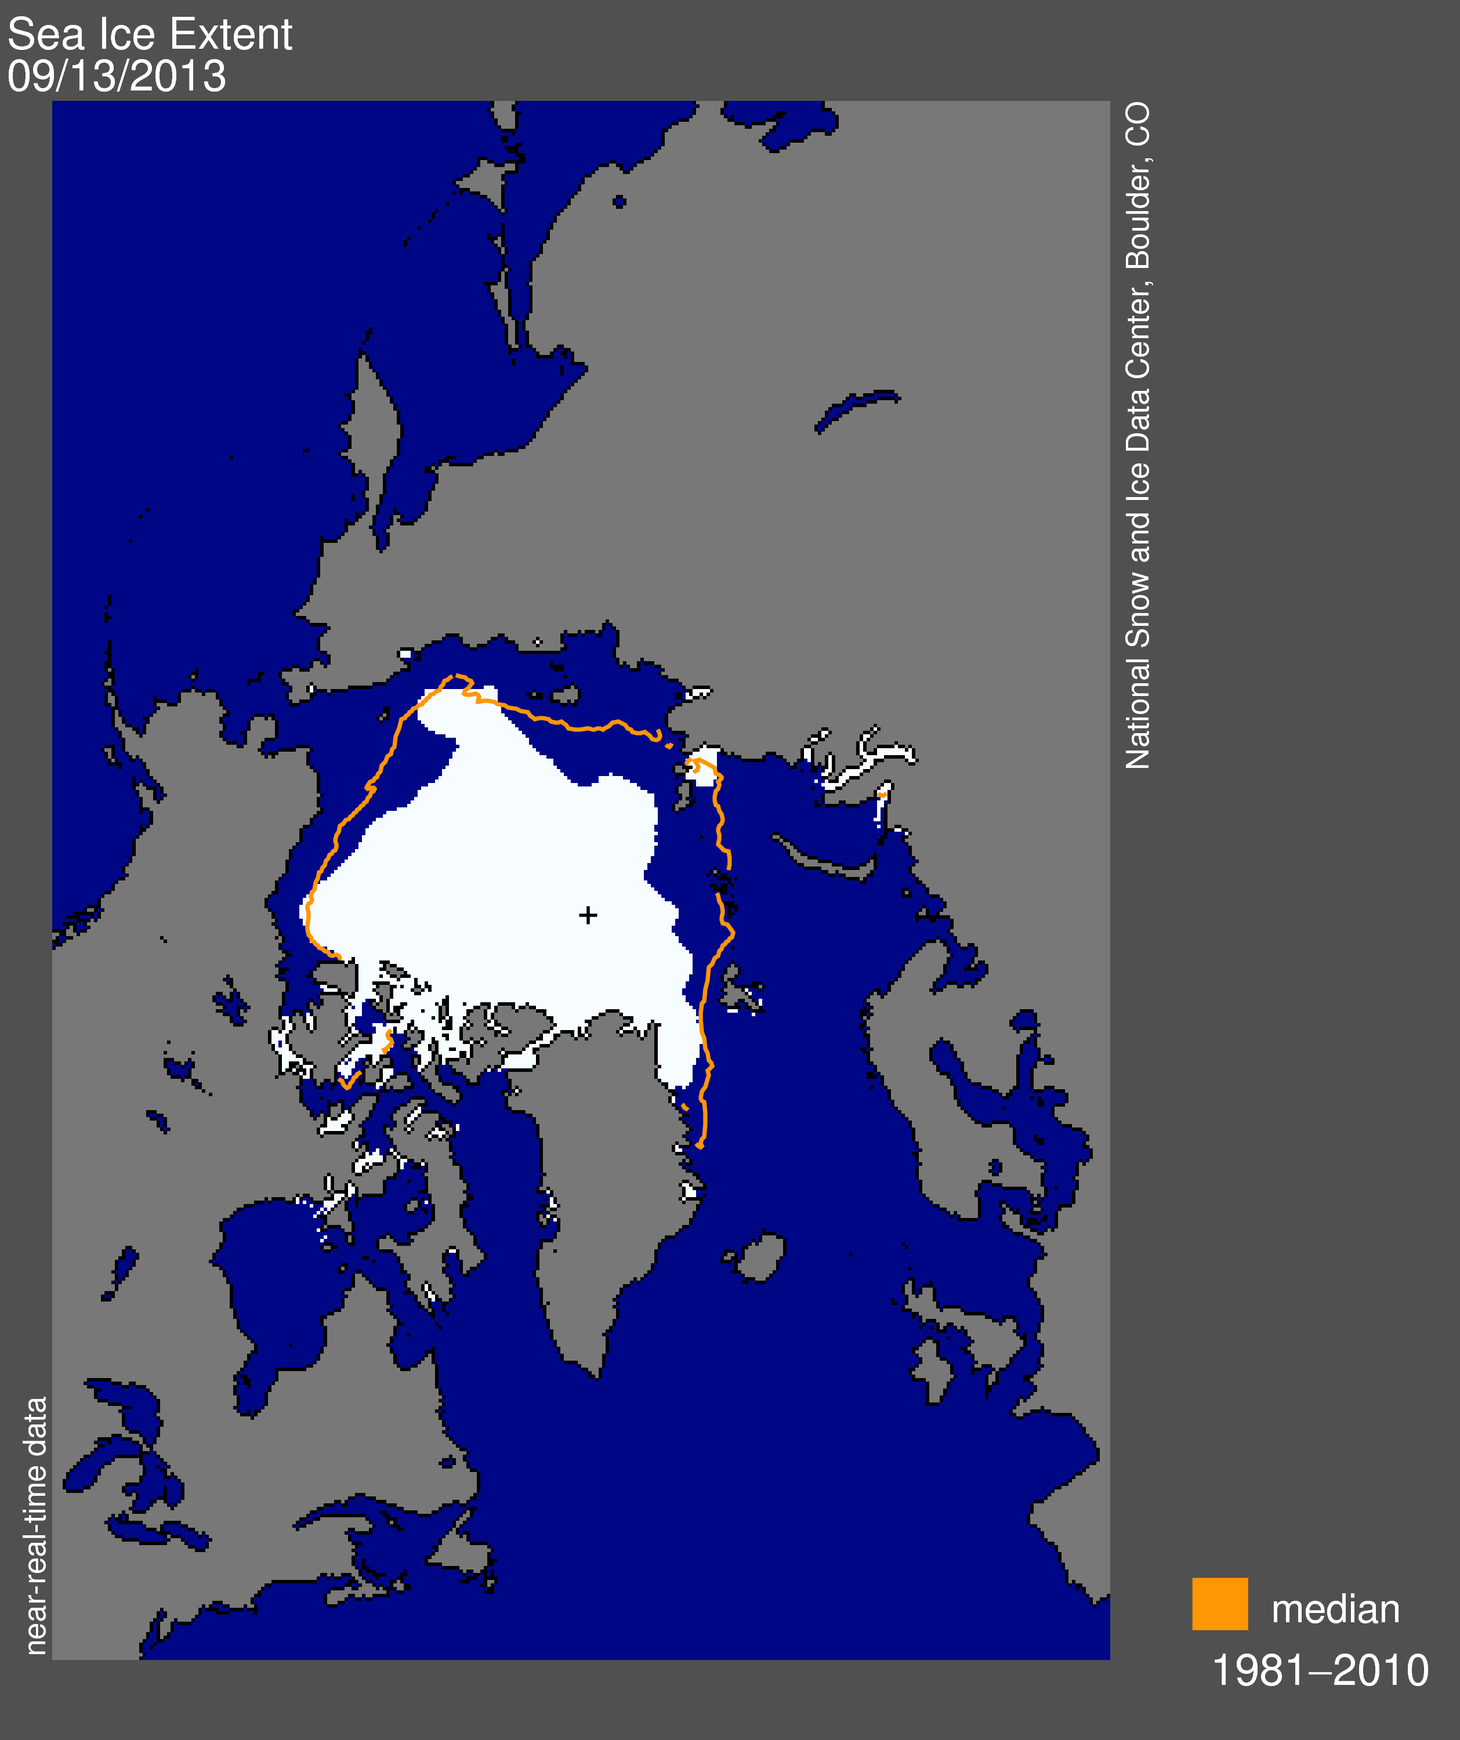
Figure 1. Arctic sea ice extent for September 13, 2013 was 5.10 million square kilometers (1.97 million square miles). The orange line shows the 1981 to 2010 median extent for that day. The black cross indicates the geographic North Pole. Sea Ice Index data. About the data
Credit: National Snow and Ice Data Center
On September 13, 2013, sea ice extent dropped to 5.10 million square kilometers (1.97 million square miles). This appears to have been the lowest extent of the year. In response to the setting sun and falling temperatures, ice extent will now climb through autumn and winter. However, a shift in wind patterns or a period of late season melt could still push the ice extent lower. The minimum extent was reached two days earlier than the 1981 to 2010 average minimum date of September 15.
Conditions in context

Figure 2. The graph above shows Arctic sea ice extent as of September 19, 2013, along with daily ice extent data for five previous years. 2013 is shown in blue, 2012 in green, 2011 in orange, 2010 in pink, 2009 in navy, and 2008 in purple. The 1981 to 2010 average is in dark gray. Sea Ice Index data.
Credit: National Snow and Ice Data Center
This year’s minimum was 1.69 million square kilometers (653,000 square miles) above the record minimum extent in the satellite era, which occurred on September 16, 2012, and 1.12 million square kilometers (432,000 square miles) below the 1981 to 2010 average minimum.
Varying distribution of ice in 2013 versus 2012

Figure 3. This image compares differences in ice-covered areas between September 13, 2013, the date of this year’s minimum, and September 16, 2012, the record low minimum extent. Light gray shading indicates the region where ice occurred in both 2013 and 2012, while white and dark gray areas show ice cover unique to 2013 and to 2012, respectively. Sea Ice Index data. About the data
Credit: National Snow and Ice Data Center
Comparing this year’s minimum extent to 2012, while extent was higher on average this year, there were variations from region to region. There was considerably higher sea ice extent in the Beaufort, Chukchi, and East Siberian sea regions, with the ice edge several hundred kilometers farther south compared to last year. This year the Canadian Archipelago also retained much more ice, keeping the Northwest Passage closed. The most notable area of less ice this year compared to last was off the east coast of Greenland, south of Fram Strait. Other small areas of decreased extent were found north of the Kara and Laptev seas.
See an animation of this summer’s sea ice extent produced by the NASA Scientific Visualization Studio at http://svs.gsfc.nasa.gov/goto?4104.
Previous minimum Arctic sea ice extents**
| YEAR | MINIMUM ICE EXTENT | DATE | |
|---|---|---|---|
| IN MILLIONS OF SQUARE KILOMETERS | IN MILLIONS OF SQUARE MILES | ||
| 2007 | 4.17 | 1.61 | September 18 |
| 2008 | 4.59 | 1.77 | September 20 |
| 2009 | 5.13 | 1.98 | September 13 |
| 2010 | 4.63 | 1.79 | September 21 |
| 2011 | 4.33 | 1.67 | September 11 |
| 2012 | 3.41 | 1.32 | September 16 |
| 2013 | 5.10 | 1.97 | September 13 |
| 1979 to 2000 average | 6.70 | 2.59 | September 13 |
| 1981 to 2010 average | 6.22 | 2.40 | September 15 |
* According to near-real-time data, this year’s minimum extent is slightly lower than 2009. However, the ranking between 2009 and 2013 is close, and may change once the final version of the data are processed. See our Frequently Asked Questions: Do your data undergo quality control? for more information about near-real-time data.
** Note that the dates and extents of the minimums have been re-calculated from what we posted in previous years; see our Frequently Asked Questions for more information.
====================================================================
The ARCUS sea ice forecasting contest
WUWT’s ARCUS Arctic sea ice forecast wasn’t far off the mark in June 2013, we actually did better than most with 4.8 million sqkm:
 for September 2013 sea ice extent (values are rounded to the tenths).")
Download High Resolution Version of Figure 1.
I had to laugh at the Met Office forecast. So much for supercomputer driven model skill.
WUWT didn’t participate in July due to scheduling conflicts with 4th of July holiday I had in making the deadline, but here are the entries:
 for September 2013 mean sea ice extent (values are rounded to the tenths).")
Download High Resolution Version of Figure 1.
The gloom and doom forecast of the Met Office didn’t change at 3.4, but it was bested by ultra-gloomer “Neven” at the Arctic Sea Ice Blog who said 3.2 would be the value.
WUWT did participate in August, essentially no change for the averaged top 5 vote.
Since ARCUS didn’t plot them, I’ve plotted all the participant forecasts below.

Figure 5: plot of September Arctic Sea Ice Extent Mean forecasts submitted to ARCUS in August 2013.
WUWT’s value is based on a weighted calculation of the top five vote getters in our poll here: http://wattsupwiththat.com/2013/08/11/sea-ice-news-volume-4-3-2013-sea-ice-forecast-contest/
The most popular value picked by WUWT readers was 5.0 msq/km 8.9% (94 votes), though it wasn’t a runaway vote, hence I opted for a weighted average of the top 5 vote getters.
The Met Office seems to have bowed out, and even at the late date, “Neven” was firmly in the gloom category again with 3.6.
The NCAR model ensemble guess didn’t do much better.
It should be noted that ARCUS has not made the final report yet, and that their forecast contest is based on the NSIDC September extent average, which has yet to be recorded. I’ll report that when it is available. Overall though, I’d say WUWT readers did better than gloomers, modelers, and of course, Wieslaw Maslowski.
Most certainly, even though the counter on the sidebar has not reached the Autumnal equinox indicating the end of summer, clearly Maslowski is falsified for 2013:
BBC – 12 December 2007
“Our projection of 2013 for the removal of ice in summer is not accounting for the last two minima, in 2005 and 2007,”…….”So given that fact, you can argue that may be our projection of 2013 is already too conservative.”
[Professor Wieslaw Maslowski]

Maslowski joins NASA’s Jay Zwally in the Hall of Lame:
National Geographic – 12 December 2007
“NASA climate scientist Jay Zwally said: “At this rate, the Arctic Ocean could be nearly ice-free at the end of summer by 2012, much faster than previous predictions.” ”
[Dr. Jay Zwally – NASA]
And of course, let’s not forget the Sierra Club:
Sierra Club – March 23, 2013
“For the record—I do not think that any sea ice will survive this summer. An event unprecedented in human history is today, this very moment, transpiring in the Arctic Ocean….”
[Paul Beckwith – PhD student paleoclimatology and climatology – part-time professor]

Source: http://www.sierraclub.ca/en/AdultDiscussionPlease
Read more on the ARCUS forecast here: http://www.arcus.org/search/seaiceoutlook
And of course, the WUWT sea ice reference page: http://wattsupwiththat.com/reference-pages/sea-ice-page/
This would be a good time to remember the GRL paper from Tietsch et al in 2011 showing how uncovered and uninsulated arctic creates a strong negative feedback that promotes ice recovery. I think this is in large part responsible for the wild swings in the Arctic sea ice anomaly since 2007, which was at the time a record low for the satellite era. The 2007 low was the initial shock that has been ringing a low-frequency bell ever since, as positive and negative feedbacks compete. (see: http://arctic.atmos.uiuc.edu/cryosphere/IMAGES/seaice.anomaly.arctic.png )
Tietsch et al write:
(emphasis added)
In a single picture
this is what is most likely going to happen in the arctic, based on the last 30 years
alternatively, take the first picture above and then average the red, orange and blue lines for the first 1/3 of the 2010’s average and compare it with the dotted grey lines above.
and please understand that the average ice thickness during this period has gone down by 50% since 1980
[No. Future readers are alerted to the first “link” which is to “download attachments” Most readers do NOT want to load other’s files into their PC’s. Mod]
Antarctic ice very close to 2012s extent….
One can only hope that Beckwith has spouted his prediction long and loud on campus, and that any students he happens to have academic contact with will see this as a reason to question everything they are being taught.
Why has the countdown stopped? One day to go, not two.
Or is this a dastardly plot to win by stopping the clock for as long as it takes (thousand years or so) to find an ice-free arctic sea?
and reinforces the long-term downward trend in Arctic ice extent
=========
if my bank account is going down, and then it goes up, how does this upward amount reinforce the downward trend? only in climate science, where belief conquers all.
Might be worth showing the IPCC prediction as well. 10-13b is the one most relevant:
http://ipcc.ch/publications_and_data/ar4/wg1/en/figure-10-13.html
RE: UnfrozenCavemanMD says:
September 21, 2013 at 10:44 am
I agree that the open water on the Eurasian side of the Pole will create a strong negative feedback. Among other things, a different dynamic kicks in when sub-zero wind blows over open water. Rather than the ice on the surface acting as starter-crystals, and a sort of top-down cooling occurring, instead the surface water simply sinks and is replaced by rising warmer water, the result being that the water is chilled down to the pycnocline 300-450 feet down. No longer do have a layer of ice with warmer currents moving under it. Also you no longer have summer storms sucking up warmer water from below, for the entire column of water is colder. I think that is why it was colder during the warmest part of the summer up at the pole this year, and also why the summer gales didn’t break up the ice as much.
I also thought the colder water meant the refreeze would start earlier, but I was wrong there. My vote was for a minimum extent of 6 million km2. While casting my vote in Anthony’s poll I must have clicked the wrong link. All of a sudden I was confronted by a lengthy form to fill out. I wondered why Anthony was asking all these questions, but just shrugged and filled out the form. You can imagine my chagrin when I saw my name on the graph. Yes, I’m the Bozo who submitted the prediction of 6 million. But you have to give me this: I beat the heck out of the UK Met Office.
By the way, the North Pole Camera is showing an ice breaker stopped in the distance. WUWT?
See bottom of post at: http://sunriseswansong.wordpress.com/2013/09/19/arctic-sea-ice-minimum-the-darkness-decends/
I missed it…..but was close…..I guessed 5 million
Beckwith apparently doesn’t know that the Arctic has often been virtually ice free in Holocene summers, as it was during much of the Eemian Interglacial. In both these interglacials, modern humans existed, so he’s as wrong on the anthropology as the climate.
We have heard it all before, no doubt there will be much grinding of teeth and the usual non-scientific excuses like “the heat has gone into the oceans”. An apology would be nice, but it will not happen, I think the general public are sick and tired of hearing this b******t, because I certainly am.
and reinforces the long-term downward trend in Arctic ice extent
=========
this bit of mathematical nonsense shows the NSIDS statement is political not scientific.
Why do government science agencies feel the need to take a position one way or the other? why do they not simply publish the facts without adding the spin?
Is it because government science agencies are first and foremost political organizations, and only secondarily science organizations?
Even with a range of 100% the UK Met of Betts and clowns still couldn’t get near it.
This is of no surprise, and just like they are wrong about arctic sea ice, they will be wrong on global warming.
“Serious stuff: Adult discussion time…”
One can find these and similar words all around the web. Original thinking is like a far away planet for those people and they all fancy themselves as astronauts.
Is Paul Beckwith related to Harold Camping? The underlying ‘the world is coming to an end’ – ‘change your ways’ – ‘all but a few of the human race will survive’ – ‘on it will come to pass’ etc etc/… And of course the other major point they have in common is being totally wrong. But that doesn’t seem to prevent mindless followers supporting them.
It should be noted that being mindless doesn’t mean lack of academic qualifications..or as Stephen Vizinczey put it: “Strange as it seems, no amount of learning can cure stupidity, and higher education positively fortifies it.
.
sounds like Mr. Mann has lots of ice to use his stick on .
[Check your user_id please. Mod]
You might as well re-set your countdown widget on the top right of the WUWT page to point to our next gloomer: Professor Peter Wadhams. Here is what he has said in the past.
Just 2 years to go!
Wadhams has also said:
Guardian – 17 September 2012
“This collapse, I predicted would occur in 2015-16 at which time the summer Arctic (August to September) would become ice-free. The final collapse towards that state is now happening and will probably be complete by those dates“.
[Professor Peter Wadhams – Cambridge University]
Wadhams has also said:
This is an update chart now that September 15th has past by. This same chart was included in one of Anthony’s SeaIce articles about the same date last year.
Don’t know what caused me to create this chart, just a question in my mind, but i thought other’s might find this statistical curiosity, well… curious, since it gives a different view to what the says from the Arctic, in reverse being a look at the water, not ice.
Remember, this is showing the daily mean of OPEN Arctic Ocean area, not ice extent, and this is an anomaly (differences) from the mean, daily, then averaged for the year.
http://i39.tinypic.com/2nuhfnp.png
One, I found it curious how this chart forms segments of rather straight lines. And I do remember why I started this, even though 2012 had a huge storm right at the end of the melt season last year most of the time into late spring showed a high amount of ice on a daily basis… I wondered what if you took every day into account.
If you see any mistakes, let me know. Don’t know if the logic of winters holds true and don’t put any weight on the polynomial fit, no predictive power there, just to show the general smooth curve.
Looks like the met office just looked at last years minimum extent and took a bit off, assuming/believing that it just had to be less.
” and reinforces the long-term downward trend in Arctic ice extent. ”
Jeez, what would have to have happened to _not_ reinforce it in their minds. Anything short of an instant return 1979 ice coverage, I guess.
Beckwith didn’t get the memo.
A one year data point cannot reinforce or disprove a “long-term downward trend “. The statement is meaningless , yet tries to give the impression it is saying something.
If it “confirmed” anything it confirmed the current rate of ice loss is about half what it was between 1997 and 2007.
http://judithcurry.com/2013/09/16/inter-decadal-variation-in-northern-hemisphere-sea-ice/