From Dr. Benny Peiser and the GWPF
We Really Don’t Understand Our Climate

Something is happening to our sun. If history is anything to go by, the sun’s change of mood could affect us all by cooling the earth and throwing our climate change calculations into disarray. It might even be the case that the earth’s response to low solar activity will overturn many of our assumptions about man’s influence on climate change. Cold not warmth might be our future. We do not know. We must keep watching the sun. –David Whitehouse, Public Service Europe, 24 July 2013
Global warming has been on “pause” for 15 years but will speed up again and is still a real threat, Met Office scientists have warned. In a set of three new reports, the Met Office claims that global warming has been disguised in recent years by the oceans, which have absorbed greater amounts of heat and prevented us from noticing the difference at surface level. Other factors including a number of volcanic eruptions since 2000 and changes in the Sun’s activity, could also have masked the effect of greenhouse gases by providing a slight cooling effect, they said. –Nick Collins, The Daily Telegraph, 22 July 2013
In its conclusions the Met Office states that the pause has not falsified the climate models. If the pause is, as they define it and limit it, from 2001 onwards, then this is true. But if the pause is 16-years, as the temperature data actually show, then the models, already looking unimpressive, are in jeopardy. We are at the waiting stage. Better and more reliable OHC data are desperately needed. Even if global temperatures were to rise again the climate models have shown themselves inadequate. If the pause continues, however, then the crisis of climate science will become more serious. –David Whitehouse, The Global Warming Policy Foundation, 24 July 2013
The scientists say, pauses in warming were always to be expected. This is new – at least to me. I’ve never heard leading researchers mention the possibility before. I asked why this had not come up in earlier presentations. No one really had an answer, except to say that this “message” about pauses had not been communicated widely. But what about another possibility – that the calculations are wrong? What if the climate models – which are the very basis for all discussions of what to do about global warming – exaggerate the sensitivity of the climate to rising carbon dioxide? –David Shukman, BBC News, 22 July 2013
Scientists are still struggling to explain the slower-than-predicted global warming over the past decade. There are innumerable variables in the climate system that could be responsible for the warming slowdown. These scientists have identified some of the likeliest culprits, but one professor admitted that they “don’t fully understand the relative importance of these different factors.” The recent warming plateau is exposing our limited understanding of climate, and it’s effectively killing the rationale for green policies that limit growth and, at the most basic level, try to force people to do things they would rather not do. — Walter Russell Mead, Via Meadia, 23 July 2013
The Science Media Centre has released a statement on the failure of global temperatures to rise in line with the models. It’s spin of course, although perhaps not quite as blatant as we are used to from them. Lots of “our understanding is getting better” and not a lot of “nobody has a clue what’s going on”. There’s a complete misrepresentation of science’s level of understanding of the reasons why this is happening. As I said in Parliament, the inability of climate scientists to admit their ignorance is one of the reasons nobody trusts them. The Science Media Centre are just helping that process along in the wrong direction. –Andrew Montford, Bishop Hill, 22 July 2013
First, I asked Stephen Belcher, the head of the Met Office Hadley Centre, whether the recent extended winter was related to global warming. Shaking his famous “ghost stick”, and fingering his trademark necklace of sharks’ teeth and mammoth bones, the loin-clothed Belcher blew smoke into a conch, and replied, “Here come de heap big warmy. Bigtime warmy warmy. Is big big hot. Plenty big warm burny hot. Hot! Hot hot! But now not hot. Not hot now. De hot come go, come go. Now Is Coldy Coldy. Is ice. Hot den cold. Frreeeezy ice til hot again. Den de rain. It faaaalllll. Make pasty.” –Sean Thomas, The Daily Telegraph, 19 June 2013
The Sunday Politics interview with Energy and Climate Change Secretary Ed Davey on July 14 provoked widespread reaction in the twittersphere and elsewhere, which was only to be expected given the interview was about the latest developments in global warming and the implications for government policy. Many of the criticisms of the Davey interview seem to misunderstand the purpose of a Sunday Politics interview. –Andrew Neil, BBC News, 22 July 2013
Tao Baby: the current solar maximum is low compared to previous maxima ( approx. 1990, 2000) in sunspots (about 2/3rd down on 1990), total irradiance (all wavelengths combined) by a small percentage – less than 1%, and farUV (not clear from data but maybe 10% or more down on 2000), and also the magnetic field – which has been low since 2006 and did not rise up the scale as usual for solar maximum…causing NASA to give up on their best models of prediction around 2009. But this behaviour was predicted by several solar scientists.
In my view, the low magnetic field and low UV flux are the key factors for climate, largely through the impact on the jetstream.
Those solar scientists who did predict the downturn, expect it to continue into the next cycle – in which case we will have a natural experiment on what the jetstream/climate does during a low cycle – as in the past (Dalton minimum, Maunder Minimum and others).
Stephen Wilde: take a look at my treatment of the ocean heat content in my book ‘Chill’ – you will see that it is not global but locally concentrated and right in the path of the jetstream – you are right on the button…..the shift from meridional to zonal alters the heat balance of the planet, indeed I think this is the proximal cause of ice-ages and all the Bond/Heinrich events/cycles. Clouds shift also – but you don’t necessarily need a total percentage change, a spatial change with do the job. Yes, clouds changed in 2001 – there was a major climate change event then comparable to the one in 1976: the 4% decline from 1983 was reversed suddenly, by 2% and it appears to have been stable since then. Quite enough to explain not just the ‘standstill’ since 1997, and the slight cooling since 2002, but ALSO all of the warming from 1980 yo 2000.The surface flux of insolation was nearly 4x the computed wattage from carbon dioxide!
I am intrigued that you say the jetstream shifted in 2000/2001….I did not notice a shift until 2007/2008. What data are you using? I still have no explanation for the reversal of the cloud trend.
henry asks
“more cloudiness as a result of what?””
Longer lines of air mass mixing from more meridional jets.
I think the increase in cosmic rays is merely coincidental and not causative.
Peter Taylor asked:
“I am intrigued that you say the jetstream shifted in 2000/2001….I did not notice a shift until 2007/2008. What data are you using? I still have no explanation for the reversal of the cloud trend.”
Simply my own observations in UK. I’ve always watched weather and climate closely. It was 2007 before I was confident enough to say it publicly.
The reversal of the cloud trend is due to longer lines of air mass mixing in a meridional jetstream scenario.
No, not at least according to Dr. Svalgaard.
On the other hand I think that Sun writes a scenario, but it is the Earth that plays it on the climate stage, and interprets it according to its magnetic personality disposition at the time.
http://www.vukcevic.talktalk.net/EarthNV.htm
Anyone looking for good Solar Sun Data page it is on on the right side on the main page.
http://wattsupwiththat.com/reference-pages/solar/
Peter Taylor says:
July 24, 2013 at 12:34 pm
Tao Baby: the current solar maximum is low compared to previous maxima ( approx. 1990, 2000) in sunspots (about 2/3rd down on 1990), total irradiance (all wavelengths combined) by a small percentage – less than 1%, and farUV (not clear from data but maybe 10% or more down on 2000), and also the magnetic field – which has been low since 2006 and did not rise up the scale as usual for solar maximum…causing NASA to give up on their best models of prediction around 2009. But this behaviour was predicted by several solar scientists…
______
Thank you so much for that enlightening response. I will definitely start monitoring the sun’s activities from now on in regards to the effect that it has on climate and global temperature changes. I didn’t know it affected the climate’s weather patterns that much.
Stephen Richards says:
July 24, 2013 at 11:26 am
taobabe says:
July 24, 2013 at 11:08 am
Go on line and read. It’s all there. Compare these max to previous maxs. Think and check the data and you will be enlightened like the rest of us.
______
Wow. What an attitude to a perfectly innocent question asked by someone who truly wants to understand. And you wonder why people think you’re a prick.
R de Haan says
http://wattsupwiththat.com/2013/07/24/newsbytes-sunspot-enigma-will-inactive-sun-cause-global-cooling/#comment-1370335
henry says
your link did not work?
either way, I think you got it wrong…
as long as there is global cooling
http://www.woodfortrees.org/plot/hadcrut4gl/from:1987/to:2014/plot/hadcrut4gl/from:2002/to:2014/trend/plot/hadcrut3gl/from:1987/to:2014/plot/hadcrut3gl/from:2002/to:2014/trend/plot/rss/from:1987/to:2013/plot/rss/from:2002/to:2013/trend/plot/hadsst2gl/from:1987/to:2014/plot/hadsst2gl/from:2002/to:2014/trend/plot/hadcrut4gl/from:1987/to:2002/trend/plot/hadcrut3gl/from:1987/to:2002/trend/plot/hadsst2gl/from:1987/to:2002/trend/plot/rss/from:1987/to:2002/trend
the differential between equator and polar is increasing, causing more condensation at lower latitudes, and less at higher latitudes, causing less insolation of earth, causing more cooling, etc.
luckily , for us , there will be a turning point…
Sorry to be a dolt but am a bit confused about the linkage between the sun spots/solar activity and climate. Isn’t the measured difference in insolation on the order of a fraction of one percent? Am not being facetious am just trying to understand.
“Cold not warmth MIGHT BE our future???”
The jet stream pattern l would not like to see happening to often during the winter is the Polar jet splitting in two. With the jet going in a waving pattern there will be cooling, but in itself l think its highly unlikely to cause a ice age. Because it would make the weather to unstable for a ice age to set in. For a ice age to form l think the Polar jet would need to split and go zonal over a large area of the NH.
Plug for Peter Taylor – his book “Chill” is an fine and instructive read, and accessible to a lay person such as myself.
Mainstream climatologist don’t know what they are talkng about. They are a bunch of useless fools.
salvatore del prete says:
July 13, 2013 at 12:35 PM
I think the start of the temperature decline will commence within six months of the end of solar cycle 24 maximum and should last for at least 30+ years.
My question is how does the decline take shape, is it slow and gradual or in jagged movements as thresholds are met. I think some jagged movements then a leveling off then another jerk etc etc. Will thresholds be met?
I KNOW THEY ARE OUT THERE.
I think the maximum of solar cycle 24 ends within 6 months, and once the sun winds down from this maximum it is going to be extremely quiet.
Solar flux sub 72, although sub 90 is probably low enough.
Solar Wind sub 350 km/sec.
AP INDEX 5.0 or lower 98+ % of the time.
Solar Irradiance off .2% or greater.
UV light off upwards of 50% in the extreme short wavelengths.
This condition was largely acheived in years 2008-2010 but the number of sub- solar years of activity proceeding these readings back then was only 3 or 4 years, this time it will be over 8+ years of sub- solar activity, and no weak solar maximum will be forthcoming.
Lag times come into play mostly due to the oceans.
It is clear that the greenhouse effect ,how effective it is ,is a result of energy coming into and leaving the earth climatic system. The warmer the oceans the more effective the greenhouse effect and vice versa.
With oceans cooling in response to a decrease in solar visible light the amounts of co2/water vapor will be on the decrease thus making the greenhouse effect less effective going forward. At the same time the albedo of earth will be on the increase due to more low clouds,ice and snow cover.
ROUTE CAUSE OF THE CLIMATE TO CHANGE
Very weak solar magnetic fields, and a declining weak unstable geomagnetic field, and all the secondary feedbacks associated with this condition.
SOME SECONDARY EFFECTS WITH WEAK MAGNETIC FIELDS
weaker solar irradiance
weaker solar wind
increase in cosmic rays
increase in volcanic activity
decrease in ocean heat content
a more meridional atmospheric circulation
more La Ninas ,less El Ninos
cold Pdo /Amo
I say the start of a significant cooling period is on our doorstep, it is months away. Once solar cycle 24 maximum ends it starts.
This has happened 18 times in the past 7500 years(little ice ages and or cooling periods ) ,number 19 is going to take place now.
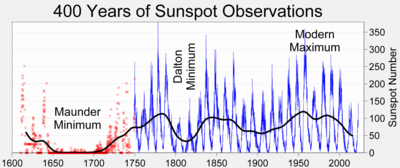
Two of the most recent ones are the Maunder Minimum(1645-1700) and the Dalton Minimum(1790-1830).
I say this one 2014- 2050??
Reply
The ‘climate crisis’ is morphing into the ‘climate science crisis’.
More clouds a result of a more meridional atm. pattern and an increase in cosmic rays in my opinion.
taobabe says: July 24, 2013 at 11:08 am
Quick question. Your article states that the sun is inactive at this time, but from what I’ve been able to gather from scientific news sources, the sun has been very active within the last couple of weeks. [snip] According to these sites, we just had some major Coronal Mass Ejections just in July alone, and it doesn’t show any signs of calming down. Can you please explain this discrepancy? Thanks.
—————————————————–
If you are at least somewhat nerdy, I recommend a readable and educational book called: “The Sun Kings” by Stuart Clark. It’s an early history of solar astronomy and how it affects this planet.
Tom Hobbes says: July 24, 2013 at 1:06 pm
Sorry to be a dolt but am a bit confused about the linkage between the sun spots/solar activity and climate. Isn’t the measured difference in insolation on the order of a fraction of one percent? Am not being facetious am just trying to understand
—————————————————————–
One theory that is hotly debated is that solar activity (I am greatly simplifying this) affects the size/strength of the Earth’s magnetic field. That field in turn affects the number of Cosmic rays that reach the atmosphere. That charged particle stream nucleates clouds and helps determine the planet’s total cloud cover. This effect can be far greater than the change in insolation.
[To all you *real* scientists, have I mangled that enough?]
for Dan in California: not mangled….but the science on magnetic fields/cosmic rays/clouds is far from settled – the first indication was a correlation over the 1990 peak to trough in the cycle, with a 3% shift in cloud cover…..thin cloud at the cycle max, thicker cloud at the minimum – but this clear correlation could not be repeated for the next cycle without adjustments to the methodology and this has been criticised – all in the science literature, however, the work done at the Danish Meteorological Institute/Danish Space Centre does not seem to have been written up in the broader science literature – especially responses to the critics. Instead, Svensmark and his team were given European Space Agency funding to do lab experiments on cloud seeding. I think they would have been better advised to study the cloud correlations more.
If they are right, other scientists have argued the effect is likely to be small.
Perhaps more important is the correlation between low magnetic field and low UV emissions, and low UV with a southerly and zonal shift in the jetstream – which will also have an effect on cloud cover. Spatial changes in cloud cover may be as important as overall percentage shifts in determining energy input (visible light) to the ocean. For example, higher latitude clouds insulate oceans that would otherwise lose heat rapidly, lower latitude clouds prevent light reaching the ocean surface and hence cool it overall.
Another factor, underresearched, is the effect of solar max voltage shocks from CMEs and clearing of aerosols….there was a rise in insolation in cloud free zones due to lower aerosols from 1983-2000, in line with the rising solar activity.
All of the global warming from 1980-2000 can be explained by cloud data, and likewise the standstill since then. The question is – does CO2 rise/surface temperature rise have an effect on clouds? Clouds decrease from 1980-2000 as CO2 and temperatures rise, then the trend reverses whilst CO2 continues to rise and temperatures flatten. So it is not a direct consequence of CO2. The crucial question is: why did temperatures flatten (clouds as cause, or effect?). We know little of the mechanisms for regular warming and cooling of the oceans in imprecise ‘cycles’ but I suspect clouds are central.
The sun is in a prolonged solar minimum which started around year 2005.
Current solar flux reading are around 106 closer to typical solar minimum readings, then typical solar maximum readings even though this is the maximum period of time for solar cycle 24.
This solar cycle 24 is as weak as solar cycle 5 associated with the Dalton Solar Minimum.
Very weak and will have climatic consequences as this decade proceeds.
Dan in California says:
July 24, 2013 at 1:51 pm
Not quite. It’s variation in the strength of the sun’s own magnetic field which modulated cosmic ray flux.
The magnetic field is related to insolation, ie solar irradiance, but is not the same thing.
taobabe says:
July 24, 2013 at 12:51 pm
Stephen Richards says:
July 24, 2013 at 11:26 am
taobabe says:
July 24, 2013 at 11:08 am
Go on line and read. It’s all there. Compare these max to previous maxs. Think and check the data and you will be enlightened like the rest of us.
______
Wow. What an attitude to a perfectly innocent question asked by someone who truly wants to understand. And you wonder why people think you’re a prick.
#####
Wow. What a nasty response to perfectly innocent answer who truly wants people to learn how to do their own research. And you wonder why people think you’re a troll.
It is solar magnetic field strength, and geo magnetic field strength and all the secondary effects which impact the climate.
Weak magnetic fields equate to colder climate.
Strong magnetic fields will equate to a warmer climate.
Sometimes thresholds may be reached(abrupt climate change) ,sometimes not.( gradual temp change.)
Duration of time and degree of magnitude having much to do if thresholds are reached or not, also the beginning state of the climate of the earth to begin with coming into play.
The same climate forcings can have a different end result for the climate if the state of the climate is different at the start of those forcings.
In this article linked below, Figures 13, 14, and 15 show the rapid cooling of the US west coast at present. This cooling is similar to the cooling in the late 1940s.
This time, however, the sun has a weak sunspot cycle and will very likely result in deep cooling for decades. The implications are grim.
http://sowellslawblog.blogspot.com/2012/05/warmists-are-wrong-cooling-is-coming.html
“Will inactive sun cause global cooling?” Yup. Svensmark is correct (although the cosmic rays cause high, not low, altitude clouds, increasing the Earth’s albedo).
DesertYote says:
July 24, 2013 at 1:57 pm
taobabe says:
July 24, 2013 at 12:51 pm
Stephen Richards says:
July 24, 2013 at 11:26 am
taobabe says:
July 24, 2013 at 11:08 am
Go on line and read. It’s all there. Compare these max to previous maxs. Think and check the data and you will be enlightened like the rest of us.
______
Wow. What an attitude to a perfectly innocent question asked by someone who truly wants to understand. And you wonder why people think you’re a prick.
#####
Wow. What a nasty response to perfectly innocent answer who truly wants people to learn how to do their own research. And you wonder why people think you’re a troll.
______
This is truly a vicious board. Do you even know what a troll sounds like? Nowhere in my question did I sound like a troll—-if you had even bothered to go back and read my original question, but of course, since you also don’t do any research of your own, you wouldn’t have picked up on the innocence of my original question, now would you.
Is it a crime to ask questions on this board? Do all questions get relegated to junk status or troll status? Do you truly want to reach and educate other people in the world, or does this board solely exists for the purpose of self-entertainment with its only goal to preach to the choir? If it weren’t for the two genuinely kind posters here (thank you very much kind sirs) , I would have completely given up and gone elsewhere for information.
Correlation is not causation. But it does give you good clues as to where to look.