Guest post by Bob Tisdale
This post is a continuation of my post Tamino Once Again Misleads His Followers, which was cross posted at WattsUpWithThat here. There Tamino’s disciples and his other followers, one a post author at SkepticalScience, have generally been repeating their same tired arguments.
The debate is about my short-term, ARGO-era graph of NODC Ocean Heat Content (OHC) data versus the GISS climate model projection. This discussion is nothing new. It began in with Tamino’s unjustified May 9, 2011 post here about my simple graph. My May 13, 2011 reply to Tamino is here, and it was cross posted at WUWT on the same day here. Lucia Liljegren of The Blackboard added to the discussion here.
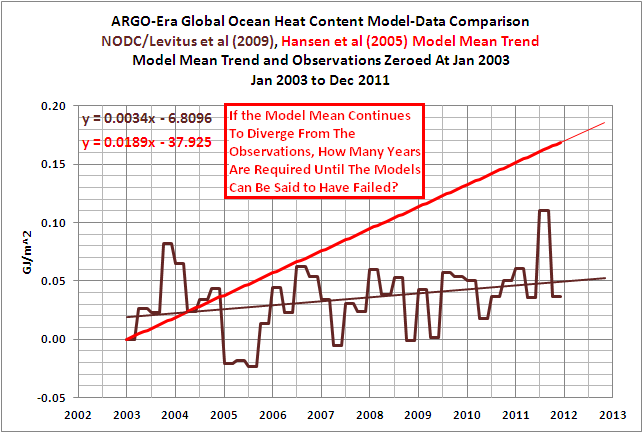
A graph that’s similar to the one Tamino and his disciples think is fake is shown in Figure 1. It’s similar but different, sort of a short-term OHC model-data comparison Modoki. We’ll get back to it.

Figure 1
First, let’s discuss…
…THE BLATANTLY OBVIOUS ERROR IN TAMINO’S RECENT FAILED CRITIQUE
Tamino’s recent failed critique is titled Fake Predictions for Fake Skeptics. Some people have noted that a fake climate skeptic would be an anthropogenic global warming proponent, but we’ll move on from the implications of that.
Tamino linked to the NODC Ocean Heat Content webpage as the source of his data. There, the NODC provides a spreadsheet of their global OHC data (here). Tamino presents a few preliminary graphs and observes:
Note that there’s a decided hot fluctuation in 2003. So we’ll “predict” the time span 2003 to the present, based on data from 1993 to 2003.
His next graph (my Figure 2) is identified only with the heading of “Ocean heat content 0-700m”. It includes a linear trend that Tamino claims is “based on data from 1993 to 2003”. The length of the trend line is assumedly based on the same period as data. But the period of his trend line does not include the “decided hot fluctuation in 2003.”

Figure 2 (Tamino’s 3rdgraph)
Tamino’s next graph, my Figure 3, includes an extension of his linear trend. In addition to the heading, the graph identifies the red trend line as “fit 1993-2003”, but his “fit 1993-2003” still does not include the “decided hot fluctuation in 2003.”

Figure 3 (Tamino’s 4rdgraph)
In the paragraph after that graph, Tamino states:
We can see that observations don’t follow the prediction exactly — of course! The main difference is that during 2003, the observations were hotter than the prediction. For that time span at least, the oceans had more heat than predicted.
He reinforces that the 2003 data is warmer, yet he and his disciples fail to observe that the 2003 data is not included in his “fit 1993-2003”.
The NODC clearly marks their quarterly data in the spreadsheet they provide here. The Global OHC value at 2002-12 is 6.368768 [*10^22 Joules], and the value at 2003-12 is clearly marked 11.6546 [*10^22 Joules]. But the data included in Tamino’s trend does not include the 4thquarter 2003 data at 11.6546 [*10^22 Joules].
If you’re having trouble seeing that, Figure 4 is similar to Tamino’s graph with the hash marks included. It shows the trend based on the period of 1993 to 2002.

Figure 4
And Figure 5 gives you an idea what Tamino’s graph would look like if he had actually included 2003 data in his trend.

Figure 5
Animation 1 compares the two. (You may need to click on it to get the animation to work.)

Animation 1
How could Tamino and his disciples have missed such an obvious mistake? Some of you might even think it wasn’t a mistake on Tamino’s part, and that his disciples purposely overlooked that blatant error. I’m sure you’ll have a few comments about that.
HANSEN ET AL (2005) OFFSETS THE OHC DATA
A recent comment noted that the observations-based dataset in Hansen et al (2005) was not NODC OHC data, that it was the OHC data based on Willis et al (2004). I never stated that I was providing Willis et al (2004) data. My OHC update posts have always been about the NODC dataset.
My Figure 6 is Figure 2 from Hansen et al (2005). Note that the data starts at about zero watt-years/m^2 in 1993. And my Figure 7 is Figure 3 from Willis et al (2004). Note that the Willis et al data starts at -1 * 10^8 Joules/m^2 at 1993. Hansen et al converted the data, which is not in question since I’ve done the same thing, and Hansen et al have offset the data, which I have done also.

Figure 6
HHHHHHHHHHHHHHHHHHHHHH

Figure 7
Mysteriously, Hansen et al can shift the data without comment from Tamino, but when I do it, it’s interpreted by Tamino and his disciples, and by those from SkepticalScience, as a fake graph.
THE BEST WAY TO COMPARE THE MODELS TO THE OBSERVATIONS-BASED OHC DATA
Obviously, the best way to present the GISS Model-ER projection for Ocean Heat Content would be to use the actual GISS Model-ER data. The RealClimate annual model-data updates here and herepresent the Model-ER data. But the Model-ER OHC simulations are not available in an easy-to-use format like at the KNMI Climate Explorer. If it was available, all of this nonsense about my shifting data, my misrepresenting data, etc., would disappear. Why?
I have stated in comments at WUWT that I would use the ensemble mean of the Model-ER data and the NODC OHC observations for my future model-data comparisons. I’ve also stated I would use the base years of 1955-2010 to avoid the possibility of being accused of cherry-picking the base years.
Why? I presented this in a June 14, 2011post. And that post has been linked to all OHC updates since then.
Figure 8 is a graph from a 2008 presentation by Gavin Schmidt of GISS. It includes the OHC simulations of the Model-ER for the period of 1955 to 2010, which is the model data shown in the RealClimate model-data posts. It also includes the older version of the global NODC OHC data.

Figure 8
If we:
1. replicate the ensemble mean data of the GISS Model-ER,
2. replace the older NODC OHC data with the current version, and
3. use the base years of 1955-2010 so that no one can complain about cherry-picked base years,
Figure 9 would be a reasonable facsimile of the long-term comparison from 1955 to 2010. Notice where the ensemble mean of the GISS Model-ER intersects with the data near the ARGO era. Sure looks like 2003 to me. Figure 1 at the top of this post confirms how closely the GISS Model-ER would intersect with the NODC OHC data at 2003.

Figure 9
That graph in Figure 1 looks familiar, doesn’t it? It sure does look like the ARGO-era graphthat Tamino and his disciples dislike so much.
MY OFFER
In my January 28, 2012 at 6:18 pmcomment at the WUWT cross post I wrote the following:
I offered in a comment above to use the base years of 1955-2011 for my short-term ARGO-era model-data comparison. That way there can be no claims that I’ve cherry picked the base years or shifted the data inappropriately. I do not have the capability to process the GISS Model-ER OHC hindcast and projection data from the CMIP3 archive. So I cannot create the ensemble member mean of the global data, on a monthly basis, for the period of 1955 to present. But some of you do have that capability. You could end the debate.
If you choose to do so, please make available online for all who wish to use it the Global GISS Model-ER hindcast/projection ensemble member data on a monthly basis from 1955 to present, or as far into the future as you decide.
I will revise my recent OHC update and reuse that model data for future OHC updates. That way we don’t have to go through this every time I use that ARGO-era comparison graph as the initial graph in my OHC updates.
Fair enough?
Any takers?
CLOSING
I know the trend of the OHC data is not the model mean, but for those who are wondering what Tamino’s NODC OHC graph might have looked like if he had actually included the 1993 through 2003 data in his trend AND then compared it to the period of 2003 to 2011, refer to Figure 10.

Figure 10
And if he had lopped off the data before 2003, because it isn’t presented in the graph that he complains about so much, the result would look like Figure 11.

Figure 11
JJ: Thanks for your January 31, 2012 at 3:38 pm comment. Would you mind if I posted it at my blog as a “quote of the month”?
Lazy Teenager sez:
>> Tamino is following a standard practice of using an inclusive-exclusive
>> time range. In other words 1993-2003 should be interpreted as a time
>> range beginning at the start of 1993 and ending at the start of 2003. In
>> other words the range excludes the year 2003.
What “standard practice” ??? Never heard of it.
NatJ says: “So a linear regression for the period of 1993-2003 leads to a very different interpretation than a linear regression for 1993-2002. Apparently one additional year makes a big difference. What does that say about the uncertainty of trends in short, noisy time series?”
As far as I can tell, Tamino’s concern is not the slope of the line. His concern is and has been where my model trend intersects with the observations. The difference in the trends between the periods of 1993-2002 and 1993-2003 is not that large. But it impacts his presentation and his complaint about where the model intersects with the data.
H.R. says:
January 31, 2012 at 2:43 pm
Ask yourself, “What’s a reasonable conclusion when a model doesn’t match observations?”
OK, I’ll bite. Useless?
🙂
Bob,
Quote of the month? I’m honored.
Wow. I’ve never won anything before. I feel I should thank the Academy or something.
Bob:
Tamino can also project forward the models without comment from Nick Stokes and crowd too. When you do it, however, it’s an error.
Lazy: “Tamino is following a standard practice of using an inclusive-exclusive time range”.
I think you just made that up. I found exactly one hit for it on google, to your comment.
/rolls eyes
David A. Evans says: “Get back to explaining ENSO, the PDO & suchlike!”
I’ve been writing about ENSO for most of the day. This is just a distraction.
@Babsy says:
January 31, 2012 at 5:32 pm
H.R. says:
January 31, 2012 at 2:43 pm
Ask yourself, “What’s a reasonable conclusion when a model doesn’t match observations?”
OK, I’ll bite. Useless?
🙂
========================================================================
LOL! I hadn’t thought of that answer as a particular. I was thinking “Wrong!” and” Do- over!”
I have been following Bob’s posts here and at his blog and he can only be described as courteous and thorough. He can be a little “cloudy” at times but all you have to do is ask! Bob will do his best to clarify. I just got a little PO’d (and mischievious) by the nitpicking that took advantage of his very professional and good nature and had to jump in. Like any good punchline, your response was a hoot; deadpan, unexpected, and pttttt…. right on point.
Made my day!
(P.S. Bob’s posts are always a good addition to any day. Do I sound like a Tisdale groupie? Naahhh… I’m not, but I really like, and learn, from his posts.)
When SkepticalScience criticize you you know you’re on the right path – they’re an evil little nest of vipers.
I wouldn’t worry too much about what Tamino publishes, nobody else does. Seriously. He is so completely discredited as nothing more than an alarmist shill that he is completely predictable in his position on any question that might come up. He simply tunes for maximum warming and lets it rip. It’s so simple even a caveman could do it.
Bob: “When someone lists start and end years of a dataset or subset, they’re stating that it includes all of the data during that period.”
I backed you last time and I’ll back LazyTeenager this one. Ranges in this manner are commonly either [1993,2003] or [1993,2003). Which to use is largely not relevant and a matter of taste. And while I do think the inclusive range [1993,2003] is certainly more common overall I would not go so far to claim that it isn’t used *at* all. Charitably, LT has a point that is valid under one interpretation.
That said, if we grant the point that Tamino meant [1993,2003) then he cherry-picked *out* the date that he’s scolding you as having cherry-picked *in*. In which case we can be certain that LT acknowledges that Tamino is as out of line as yourself.
We should make a point that 1.0 W/m2/year across the entire oceans on the Earth is 1.13 X10^22 joules. There is too much obfuscation by working back and forth between the W/m2 and joules/m2/year. 1.13 joules should be committed to memory if you want to work on OHC.
Hansen 2005 jerks around back and forth between saying the imbalance is 0.6 W/m2/year and 0.85 W/m2/year. It seems that he meant the imbalance should be 0.85 W/m2/year, that the oceans are absorbing something close to this.
So that should then translate into 0.96 X10^22 joules/m2/year of OHC rise.
From 1993 to 2011, the OHC should have increased by 18 years times 0.96 X10^22 joules/m2 or around 17 X10^22 joules/m2.
How much did it increase? About 10 (even including the unexplainable 2.5 step increase during 2002).
So yeah, Hansen is way off and Tamino should be reprimanded with a thick metre-stick like the Nuns used to do.
H.R. says:
January 31, 2012 at 6:24 pm
I am amazed at the warmists’ attachment to their models. Absolutely amazed.
The “standard practice” is to be clear. As in “1990 – 2012 inclusive”, or “1990 – 2012 exclusive”. Let’s not be too lazy to be clear. K?
Bob Tisdale said:
“LazyTeenager says: ‘Tamino is following a standard practice of using an inclusive-exclusive time range. In other words 1993-2003 should be interpreted as a time range beginning at the start of 1993 and ending at the start of 2003. In other words the range excludes the year 2003.’
I have to admit, LazyTeenager, that was pretty creative. That was your best attempt to misdirect yet.”
Bob, I’m on the fence one this one.
Lazy Teenagere, I take it, would, using “the standard” when describing the date of data from 1955, say the data is from the period 1955-1956 – whereas others might say it’s from 1955.
Is there a difference in kind when describing some data vs describing a time span the data was taken from ? Is a difference created if the data comes in quarterly vs all at once per year…therefore “spanning” the period” ?
So after all these pages with pictures and graphs with a description on the back of each one we reaffirm a decade old guess by a crazy guy is still wrong, and Tamino lacks integrity. Can we bury this now? It is not science.
Join in the singing when it comes around again. Here it comes…
Bob,
I think your Fig 8 is the place to look for a model/OHC comparison. The runs were designed for that purpose, and you can easily add the recent years obs. Gavin’s presentation is here.
Their runs were to investigate the effect of ocean model on the calcs, and show they used Russell, which runs hot here, and Hycom, which runs cold. You’ve chosen to emphasise the Russell model, but their purpose was to investigate the range of uncertainty. The Hycom model (EH) was running cooler since 1990, but is about right now.
There is obvious short term variability which the models run in projection mode (with forcing scenarios) are not capturing. That is not surprising. They are trying to resolve the longer term trend disparity between the two models.
Maus said:
“[1993,2003)” is called a half-open range, and they are very common in some environments, significantly programming and some mathematics. But the names of the endpoints (here “1993” and “2003”) in that circumstance are always names of a single value point, not the name of a range of values. The number of a year names the entire 12 months of the year. A half-open range might be passable if it were presented as “1/1/1993 to 1/1/2003”, but just with the year numbers it must certainly be written out more clearly, for example “1993 to but excluding 2003”, or “1993 through 2002”.
If you can’t justify why we should ignore the data from prior to 2003, then you are cherry picking data. That is exactly the point. In science you try to look at all the data you can – at least that’s what I was taught. This analysis is based on a subset of data cherry picked out of a larger data set.
JJ, with respect to your point, you are correct – the slope is much less if you use 2003 as a start year. And it might be more if I use 2001 as a start year. Or less if I use 2010 as the start year. It would be a huge slope if I just looked at 2Q11 to 3Q11!!! I can pick any start period and any end period I want and come up with a different slope. What makes that different than this analysis from Mr. Tisdale? The point is, we have lots of data on OHC, so why would one choose to ignore a large part of your data set? Perhaps it is because you doubt the veracity of data that doesn’t fit your preconceived notion of what the data should say.
Ron House: ““[1993,2003)” is called a half-open range, and they are very common in some environments, significantly programming and some mathematics.”
Just so, and I appreciate the assist. But surely you’re not claiming that mathematics and programming have anything to do with the CC debate?
LazyTeenager says: “Tamino is following a standard practice of using an inclusive-exclusive time range. In other words 1993-2003 should be interpreted as a time range beginning at the start of 1993 and ending at the start of 2003. In other words the range excludes the year 2003.”
LazyTeenager is right – it IS standard practice for climate scientists to include/exclude certain dates. They’ll add or delete data that will “hide the decline”, graft on the temp data to almost any chart they can, and simply refuse to discuss any divergence that results from use of the full data.
Peter – what happens if you pick slopes of 1, 2, 3, 5, 7, 11, 13, 17 years – all randomly picked out of the blue sky prime numbers, of course. Overlay them on the graph using observed data and you get a curve. Do that long enough and you will have a history. The advantage is you get to see lots of start years. Try to project that or any one of them into the future and you have fiction. The lesson we learn from all this is projecting into the future is futile and in the worst case will cause you to claim turnpikes on the Atlantic seaboard will disappear under the waves in our lifetimes. FAIL!
Models are wrong, observations are right. Subject to the Mann Normalization method, of course, but today and all yesterdays are worth bumpkis regarding what the next 10,000 tomorrows will be like.
My point is Bob can pick from dozens of models and they’re all going to diverge. Climate models applied long term are the man behind the curtain – pay him no mind.
I’m beginning to wonder if “Grant Foster” is just another case of nominative determinism.
To continue JJ’s and others’ analogies: Once they realize that the heating time is delayed, they will predict another era during which it will come; or some will say that the heating isn’t taking place on this earth, but somewhere else in the heavens, (which is more believable).
RE: Lazy Teenager: “Tamino is following a standard practice of using an inclusive-exclusive time range.”
Is that all he was doing? Gosh! I thought he was attempting to show that malfunctioning models were not actually malfunctioning.
I love the way these fellows tinker with models after-the-fact to “fix” them.
If they were selling me a new car, and I pointed out the odometer read 9,000 miles, they would tinker with the odometer until it read zero. Then they would smile and brightly state, “There! All fixed! It is new again!”