UPDATE: Tamino weighs in, see the update at the end of this post. –
One of the great things about WUWT is that it attracts commenters with a wide range of skill sets, who can often contribute far and beyond what we even see from our government sources. I’ve lamented the lack of updates from the University of Colorado sea level website, and when I got no response to emails, I decided to make a rare phone call and ask why. The answer I got from Dr. R. Steven Nerem was:
“This new website design won’t work with our current format, so if you can just be patient and wait a couple of weeks we’ll have it online.”
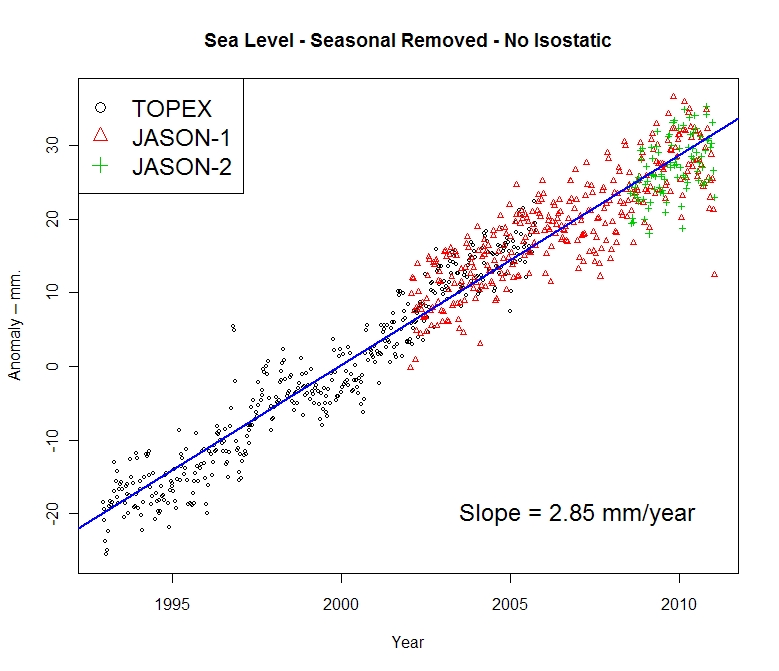
Not content to wait, and prodded by another commenter in an online tussle, CA and WUWT regular Roman M decided to find out himself. The results speak for themselves, quite a drop in the latest JASON-1 datapoint, with a general slight downturn in the JASON1-2 data since late 2009:

Here’s the dialog on how this came about, from RomanM’s comment here:
===============================================================
“… and am very curious to see what the most recent data looks like.”
So why not go and look at it?
Excellent suggestion. I did exactly that.
First, I went to the Aviso web site and found the place where one can generate sea level graphs. I generated the “Reference” version (“Reference” products are computed with the T/P-Jason-1-Jason-2 serie for the time series and with merged datasets for the maps) with the options: inverted barometer, seasonal removed and without isostatic adjustment. I got a graph with some points and a line drawn through it (which I have also saved at this location.

Quick-look of selected data. Click on “download the image”
to retrieve the image in high resolution
or on “download the data” to get the data.
Since it appeared that the “data” was rather sparse and since I enjoy playing with numbers, I chose to download the data. I assume that you didn’t try this, because to my surprise, I got the message:
550 /pub/oceano/AVISO/indicators/msl/MSL_Serie_MERGED_Global_IB_RWT_GIA_Adjust.txt: No such file or directory
Must be a glitch, I thought! After a period of time with the same type of message appearing EVERY time that I tried to download data for a variety of variables, I got the idea that perhaps (as you suggested in an earlier comment) “somebody forgot to update it, or has been busy with other things, or the person who originally did it has left and nobody else was interested” at Aviso as well. must be a lot of that going around in the climate science community, right? 😉
Anyway, not to be defeated so easily, I managed to actually locate some updated results (into January 2011) at NOAA in NetCDF format. I drew what was purportedly the same graph from that data and got something that was quite different.

I have other graphs, but I will just show one more using all of the satellites. This one used real data, not the processed results chosen by Aviso and not even shared by them.

=============================================================
Another curiosity:
The other reason things have gone quiet may be an unprecedented swing in the Jason 2 calibration curve.
http://sealevel.colorado.edu/calibration.php
I don’t know if they have published any findings on why it jumped by 10 mm at the end of 2009 but if it has skipped again maybe they are frantically trying to tidy things up before publishing data.
==============================================================
He has a point, have a look at this calibration curve published on the (CU sealevel website) for JASON1 and 2:

Compare that to the curve from the previous TOPEX A and B satellites:

Curiouser and curiouser.
To be fair, and to compare to what RomanM plotted I’ll also show the similar ensemble graph provided by NOAA, which uses smoothed data points:
 ================================================================
UPDATE:
Oh this is funny. Having been hilariously self pwned before for not reading what’s actually in a blog post, Grant Foster, aka “Tamino”, aka “Open Mind” writes a critique of this blog post complaining that because the post discussed the most recent data that still hasn’t been updated at the CU Sealevel website, and points out the dip at the end, that we are “pretending sea level rise doesn’t exist”. Here’s his graph to drive his point home.
 Here’s the funny part, above in my original post, you’ll count three graphs. One from Roman M., here and one from NOAA, here, both with trend lines for the full length of the data set, both clearly labeled with sea level rise rates of 2.85mm and 2.8mm per year respectively. Then there’s the one from AVISO/CNES/LEGOS, with the red smoothed average line and nice big blue linear trend line and 2.96mm per year rise rate labeled on it.
Gosh, how can anyone miss three graphs with positive trend lines and rates?
Mr. Foster doesn’t even have a sea level rise rate on his graph, ignores the graphs with trend lines and trend rates, and discussion on calibration of JASON 1-2, and yet we are the ones here “pretending (sea level rise) doesn’t exist”? Mr. Foster must be stuck in one of those “Smug Loops” that Steve McIntyre writes about today.
Too funny.
This reminds me of a previous incident where another “smug loop” type situation occurred, where I pointed out some outliers in sea ice satellite data and was told by NSIDC that it was “not worth blogging about“. Days later, they had to fess up to admitting they missed an equipment problem and took their whole dataset output offline to fix it.
Discover more from Watts Up With That?
Subscribe to get the latest posts sent to your email.
>>>>
izen
For those who see this sea level fall as clear evidence of the start of a cooling phase in the climate, perhaps you could explain what IS the cause of the fall and how it indicates a cooling ?<<<<
I am not good at this sort of physics/maths, so correct me if I am wrong. According to this graph, at around 10oc the volume of water changes by 0.025% per degree.
http://www.btinternet.com/~martin.chaplin/images/dd.gif
So a column of water 30m deep, cooling 1 degree, would shrink by about 8mm – or about the amount indicated on this graph. And so cooling of the surface levels of the sea could change sea levels by this amount.
I hope I have not displaced my calculation by a factor of 10 somewhere…
.
Well, I predicted you’d do just this in your post about the missing sea level data.
You are telegraphing your cherry picking expeditions, Anthony.
The oscillations in the sea level signal are there over and over. Why is it you’re hanging off this one? Guess you have to get all the cherries you can before the next El Nino and, worse for “sceptics”, the climb to the next solar maximum..
Tough years ahead for you guys.
Ferd Berple says “If you have proof that the satellite measuring of sea height is inaccurate, bring it on.”
And then links to a paper that shows how inaccurate satellite measuring of sea height is.
WUWT Ferd? Too much time at Milliways?
The TOPEX calibration graph which can be linked to from the paper you link to shows a +/- 10 mm peak to peak average noise level and scientists quote sea level in mm to 2 decimal places.
The satellites are 100 miles above the water, approximately 161 million mm or almost 28 bits of accuracy with sign. Their accuracy is stated to be a few centimeters.
The single data point noted here is -20 mm. Check just after 2000 and you will see a +20 mm spike. You wouldn’t quote the height of a person in microns, so why sea level in hundredths of millimeters? If you accept an average noise level of +/- 10 mm then a -20 mm single point means nothing.
pat says: “. . . So where is the water?” Antarctica
In my pea brain this is an example of exactly what the “hucks” do . . . where is the water? Antarctica . . . . Yes, and probably in the ground. . . . in the aquifers, rivers, lakes, . . . in the clouds . . . . many places . . . . every place!
Given the sheer volume of water on earth . . . the obsession to count every single solitary dag nab bit mm seems like a non existent “problem”.
The real issue has always been, do humans control what happens to the weather or climate? . . . we do not . . . did not and never will . . . it’s like asserting that man can control our gravity if we would just change our behavior . . . when . . . about the only way to minimize the effects of gravity, is to become “really” small.
I come from the age when “they” said it was mathematically impossible for a bumble bee to fly . . . so you can understand my cynicism some self proclaimed experts. . .
I think the Satellite is coming closer to the earth.
Ralph:
Don’t you think that someone might have noticed a full 1 C drop in mean global SSTs?
The error bars have GOTTA be wrong, and averaging between two conflicting data sets is NOT appropriate.
When you look at the overlapping data from various satellites, the error bars from each one MUST include the results of the other instruments functioning at the same time. That is just basic logic. At least one of them MUST be wrong, if not all of them. Can somebody with more statistics education than I explain how the error bars can be smaller than the difference of opinion between different measurements?
Secondly, the averaging of measurements that do not agree can’t be right either. If I have two accountants and they each tell me that I have a different account balance, then either one of them is wrong, or they both are. I can’t just average the two balances and “call it good”.
Notice the difference in trend between the various satellites. They can’t all be right, so maybe none of them are. Unless you can convince me that one of them is the “true” measurement, then I have very little confidence that any one of them is correct. Maybe they are all set up in a fundamentally incorrect way, but unless you can get a long enough sample of independent measurement that agree within their mutual error bounds, then you can’t possibly say that either of them is operating correctly.
Steve from Rockwood says:
April 18, 2011 at 5:39 am
“[…]
…You wouldn’t quote the height of a person in microns, so why sea level in hundredths of millimeters? […]”
Good point, Steve, and for those folks out there not used to working in both metric and English units on a daily basis, 0.01mm is 0.0003937 inches. If the sea level changed by 0.03mm, how could anyone tell?
So what’s with the “~12mm” horizontal line in the first graph? Had you contructed the graph just a few months earlier it would be “~39mm”.
Exactly what scientific point are you making here?
As noted below, the past rise in ocean level cannot be explained by either mass increase (ice sheets or glaciers melting) or due to thermal expansion. It appears something else is causing the volume of the oceans to increase. It appears the cause is the sun. Solar cycle 24 is an abrupt change in the solar cycle.
There is observational evidence that the sun produces a scalar field. (For example, there are changes in nuclear decay times on the earth that correlate with aphelion and perihelion, with a time lag. The time lag is indication that the mechanism is a scalar field as there is a time delay for the earth’s surface components to adjust to the change in the field.) The same mechanism explains why there is a significant increase in worldwide volcanic activity and earthquakes during deep solar minimums, as the potential of the deep earth adjusts to the new equilibrium.
If this hypothesis is correct there will continue to be a significant unexplainable drop in sea level. It appears the mechanism that creates sun spots and that equalizes the sun has been interrupted. There is evidence of cyclic abrupt changes (10 events spaced roughly 400 years apart) in the inclination of the geomagnetic field which is observational evidence that there is a sharp increase the scalar field on solar magnetic cycle restart. The effect of the solar magnetic cycle restart is dependent on the eccentricity of the earth’s orbit, the seasonal timing of perihelion, and the tilt of the earth’s axis. The strongest events produce geomagnetic excursions, such as the geomagnetic excursion that occurred during the Younger Dryas event or during past terminations of interglacial periods.
http://lanl.arxiv.org/abs/0808.3283v1
Evidence for Correlations Between Nuclear Decay Rates and Earth-Sun Distance
“The preceding considerations, along with the correlations evident in Fig. 4, suggest that the time-dependence of the 32Si/36Cl ratio and the 226Ra decay rate are being modulated by an annually varying flux or field originating from the Sun, although they do not specify what this flux or field might be. The fact that the two decay processes are very different (alpha decay for 226Ra and beta decay for 32Si) would seem to preclude a common mechanism for both. However, recent work by Barrow and Shaw [12, 13] provides an example of a type of theory in which the Sun could affect both the alpha- and beta-decay rates of terrestrial nuclei. In their theory, the Sun produces a scalar field which would modulate the terrestrial value of the electromagnetic fine structure constant EM. This could, among other effects, lead to a seasonal variation in alpha and beta decay rates, both of which are sensitive to EM [14]. We note from Fig. 3 that the fractional difference between the 226Ra counting rates at perihelion and aphelion is approx. 3 × 10⁻³, and this would require that the coupling constant k of to EM should be k (alpha) approx. 3 × 10^6.”
ftp://falcon.grdl.noaa.gov/pub/bob/2004nature.pdf
Mass and volume contributions to twentieth-century global sea level rise
“The rate of twentieth-century global sea level rise and its causes are the subjects of intense controversy1–7. Most direct estimates from tide gauges give 1.5–2.0 mm/yr, whereas indirect estimates based on the two processes responsible for global sea level rise, namely mass and volume change, fall far below this range. Estimates of the volume increase due to ocean warming give a rate of about 0.5mmyr21 (ref. 8) and the rate due to mass increase, primarily from the melting of continental ice, is thought to be even smaller. Therefore, either the tide gauge estimates are too high, as has been suggested recently6, or one (or both) of the mass and volume estimates is too low.”
These past cyclic sea level changes are too rapid and too large to be explained by changes to continental ice sheets. (Note the sea level drops and then increases by 10 to 15 m.)
Sea Level Change Through the Last Glacial Cycle
“Furthermore, the pre-LGM period is characterized by substantial fluctuations in sea level of 10 to 15 m about every 6000 years. The timing of these rapid change events during oxygen isotope stage 3 (OIS–3) apparently coincides with Heinrich ice-rafting events recorded in North Atlantic sediments (61), which suggests that they reflect major ice discharges from continent-based or shelf grounded ice sheets (62).”
Lightning Alaska’s Redoubt Volcano
http://news.nationalgeographic.com/news/2009/04/photogalleries/volcano-lightning-pictures/
April 14, 2009–Lightning, which often accompanies large eruptions, illuminates a giant ash cloud from Alaska’s Redoubt Volcano, southwest of Anchorage, in a March 28 picture by an amateur astronomer. (See daytime pictures of the Redoubt Volcano eruption.)
“We don’t always get lightning [when a volcano erupts],” said Steve McNutt, research professor of volcano seismology at the University of Alaska, Fairbanks, who was involved in the project. “And that’s one of the things we’re trying to figure out.”
http://www.sciencedaily.com/releases/2008/12/081215121601.htm
“Boundary Between Earth’s Upper Atmosphere And Space Has Moved To Extraordinarily Low Altitudes, NASA Instruments Document
During the first months of CINDI operations the transition between the ionosphere and space was found to be at about 260 miles (420 km) altitude during the nighttime, barely rising above 500 miles (800 km) during the day. These altitudes were extraordinarily low compared with the more typical values of 400 miles (640 km) during the nighttime and 600 miles (960 km) during the day.”
http://geosci.uchicago.edu/~rtp1/BardPapers/responseCourtillotEPSL07.pdf
“Also, we wish to recall that evidence of a correlation between archeomagnetic jerks and cooling events (in a region extending from the eastern North Atlantic to the Middle East) now covers a period of 5 millenia and involves 10 events (see f.i. Figure 1 of Gallet and Genevey, 2007). The climatic record uses a combination of results from Bond et al (2001), history of Swiss glaciers (Holzhauser et al, 2005) and historical accounts reviewed by Le Roy Ladurie (2004). Recent high-resolution paleomagnetic records (e.g. Snowball and Sandgren, 2004; St-Onge et al., 2003) and global geomagnetic field modeling (Korte and Constable, 2006) support the idea that part of the centennial-scale fluctuations in 14C production may have been influenced by previously unmodeled rapid dipole field variations. In any case, the relationship between climate, the Sun and the geomagnetic field could be more complex than previously imagined.”
http://www.agu.org/pubs/crossref/2006/2006GL027284.shtml
Geomagnetic excursion captured by multiple volcanoes in a monogenetic field
“Five monogenetic volcanoes within the Quaternary Auckland volcanic field are shown to have recorded a virtually identical but anomalous paleomagnetic direction (mean inclination and declination of 61.7° and 351.0°, respectively), consistent with the capture of a geomagnetic excursion. Based on documented rates of change of paleomagnetic field direction during excursions this implies that the volcanoes may have all formed within a period of only 50–100 years or less. These temporally linked volcanoes are widespread throughout the field and appear not to be structurally related. However, the general paradigm for the reawakening of monogenetic fields is that only a single new volcano or group of closely spaced vents is created, typically at intervals of several hundred years or more. Therefore, the results presented show that for any monogenetic field the impact of renewed eruptive activity may be significantly under-estimated, especially for potentially affected population centres and the siting of sensitive facilities…”
Having checked over at “Closed Minds”, I see my comment pointing out that the three graphs are posted & captioned showing the c 3mm/yr rise and asking if the rate of glacier & icecap melt is increasing, why isn’t rate of sea level rise?, hasn’t made the cut.
The usual Fanboi comments are there, however.
Or have I misunderstood the precautionary approach ?
Maybe … 🙂
the most common use of the precautionary principle is the assumption that a trend will continue to a catastrophic consequence unless something is done now to save us …
in the case of a “scientist” who hides data all we have is a single event with which to judge a persons actions by … to assume he will continue to hide data without a trend would not be using the precautionary principle … now if it happens twice in a row then you can make that leap … be careful though, with your tongue in cheek you can bite it when you land …
@-Ralph says:
April 18, 2011 at 5:28 am
“So a column of water 30m deep, cooling 1 degree, would shrink by about 8mm – or about the amount indicated on this graph. And so cooling of the surface levels of the sea could change sea levels by this amount.
I hope I have not displaced my calculation by a factor of 10 somewhere…”
No, sounds about right, but as another poster has pointed out the significant drop in temperature required to cause that amount of thermal contraction over the WHOLE ocean would have been noticed.
More to the point, that amount of thermal energy could not be lost in a few months or weeks without an active mechansim for removal of that energy. The oceans are not at a temperature which could emit that much energy (SB law). It would require the addition of enormous amounts of ice or some sort of refridgidation machinery to remove that much energy from the system to cause the thermal contraction of thast much water over the timescales involved. I cannot think of any natural process that would do it.
In answer to a couple of questions upthread, the surface of the seas are not a uniform height because of gravitational forces, the rotational force of the planet (coriolis effect), tides, wind and waves, salinity, different temperatures in different parts of the oceans (eg, near-land tropical vs. deepwater polar), and other sub and super-surface effects (like underwater currents), as well as diurnal and seasonal effects, and interannual to decadal oscillating patterns in different parts of the world’s oceans (ENSO, NAO, AO etc). Only in a featureless world with no atmosphere and no orbital or gravitational forces would the sea surface be flat. However, such a world would have no surface water – if indeed such a planet could exist at all in this universe.
I submitted a couple of comments at Tamino’s. And of course the coward wouldn’t post them. Here they are:
1.
“This conscious decision by those in denial about AGW to ignore the statistically significant long-term trend and to knowingly distort the data grew tiresome a very, very long time ago already.”
No one is ignoring anything, except Tamino. The trend that Tamino shows is shown several times in the WUWT post. He adds nothing new here. That trend turns out to be about 12 inches in 100 years. Why should anyone “deny” that? The real data is a big yawn. Furthermore, there is no acceleration in the trend. I took all of the CU data, split it in two chunks, plotted it and ran trend lines through the two halves. The trend for the second half is less than the trend for the first half. So if anything, the rate of sea level rise is slowing down.
This brings up another question. If the melt of the Greenland and Antarctic ice sheets is accelerating; and if Trenberth’s missing heat is going to the deep oceans, then where is the extra water? Another problem for the alarmists to look into – “let’s find the missing water”.
2.
Heraclitus: “I mean, you only need to look at the comments to see how no-one could possibly get the impression that the headline…”
So what you know about the oppositions arguments is what you get by reading the headlines? It’s nice that Tamino has such informative titles, like “Jerk”.
Anthony’s title is linked to another sea level piece that he had up a few days ago. In that piece he was asking why there had been no sea level update at the CU sea level site for more than 6 months. So the new title relates to the recent data that he was not able to previously get and what that recent data was doing. Anyone who actually reads these posts, instead of having knee jerk reactions to the title, knows that the rate of sea level rise is about 12 inches in a hundred years. No one who reads Anthony’s site, with the possible exception of Tamino and his readers, is confused, or unaware of what the long term trend shows.
>>RomanM (is that 1000?)
>>Don’t you think that someone might have noticed a
>>full 1 C drop in mean global SSTs?
Well world sea temperatures have lowered by 0.3 degrees in the last year. And to what depth is that measured? If it is to 100 meters, then you will have all the contraction and lowering of sea levels you need, to fit this 8mm drop.
.
Sorry, here is the WUWT link, for a graph of sea temperature drop.
http://wattsupwiththat.com/2011/01/03/global-sea-surface-temperature-continues-to-drop/
.
Jonathan: “At first glance, it looks to be pretty much following the predicted course:”
Nice work Jonathan. I’m thinking that we have had over 300 feet of sea level rise since the last ice age. And with or without mankind, we might still be having sea level rise. Maybe the right shape for the curve is the sine wave that you are looking at, but with some level of longer term upward trend. LOL. I think we all need to live about a thousand years just to see the outcome of our theories.
Kudos to Roman M for developing a preview of the tardy UC sea-level presentation. Before we get too wound up about what might be happening behind the curtain at UC and elsewhere, note that ocean temperature to 700-m depth (shown on WUWT reference pages) provides an excellent indication of sea level, and it is updated quarterly.
>>
DeanL says:
April 18, 2011 at 5:37 am
Well, I predicted you’d do just this in your post about the missing sea level data.
<<
Fortune tellers who predict past events are historians.
Jim
All these SST curves show an obvious long term linear trend. In Science , April 11th 2008, Chao, Yu, and Li corrected the published sea level curve for water held in storage and determined that sea level rise had been linear for at least the past 80 years and that the slope of sea level rise curve for this period was 2.46 millimeters per year. I estimate the linear trend in your first graph to be about 2.5 millimeters per year, in agreement with Chao, Yu, and Li. That is just under ten inches per century, not 20 feet like Al Gore dreams about. I think they got it right and the slight variations we get from that are probably instrumental effects.
O.K. For us dim bulbs, is the sea level going down, or is it just not rising as fast as the Warmists want it to?
Attention all dim bulbs. Sea level is rising and will continue for at least 15 years, by which time it may level off, start to decline or continue to rise, but definitely one of those three. And the scientists are absolutely certain that this is true.
Steve from rockwood,
You say “the scientists are absolutely certain” sea level will rise “for at least 15 years.” But you forgot the “/sarc off” at the end.
Nils-Axel Mörner, “Renowned oceanographic expert Nils-Axel Mörner
has studied sea level and its effects on coastal areas
for some 45 years. Recently retired as director of the
Paleogeophysics and Geodynamics Department at
Stockholm University, Mörner is past president (1999-
2003) of the INQUA Commission on Sea Level Changes
and Coastal Evolution, and leader of the Maldives
Sea Level Project. Now he has his own company on
Paleogeophysics & Geodynamics in Sweden, and can
be reached at morner@pog.nu.”
“”While the IPCC and its boy scouts present wilder and wilder sea level predictions for the near future, the freal observational facts demonstrate that sea level has remained virtually stable for the last 40-50 years,” New paper published in 21st Century Science & Technology by Professor Nils-Axel Morner, past president (1999-2003) of the INQUA Commission on Sea Level Changes and Coastal Evolution, and leader of the Maldives Sea Level Project.”
http://nzclimatescience.net/index.php?option=com_content&task=view&id=723&Itemid=1
http://nzclimatescience.net/images/PDFs/paper_540.pdf
http://nzclimatescience.net/images/PDFs/goa.2011.pdf
Some pretty serious claims here?
In the light that that oceanographs will join UNEP like WMO did, I am starting to be worried?