Note: I want to thank everyone who commented here and elsewhere regarding my last post about GISS that sent everyone into a tizzy. All that is very helpful. Here’s more on GISS and the AO. -Anthony

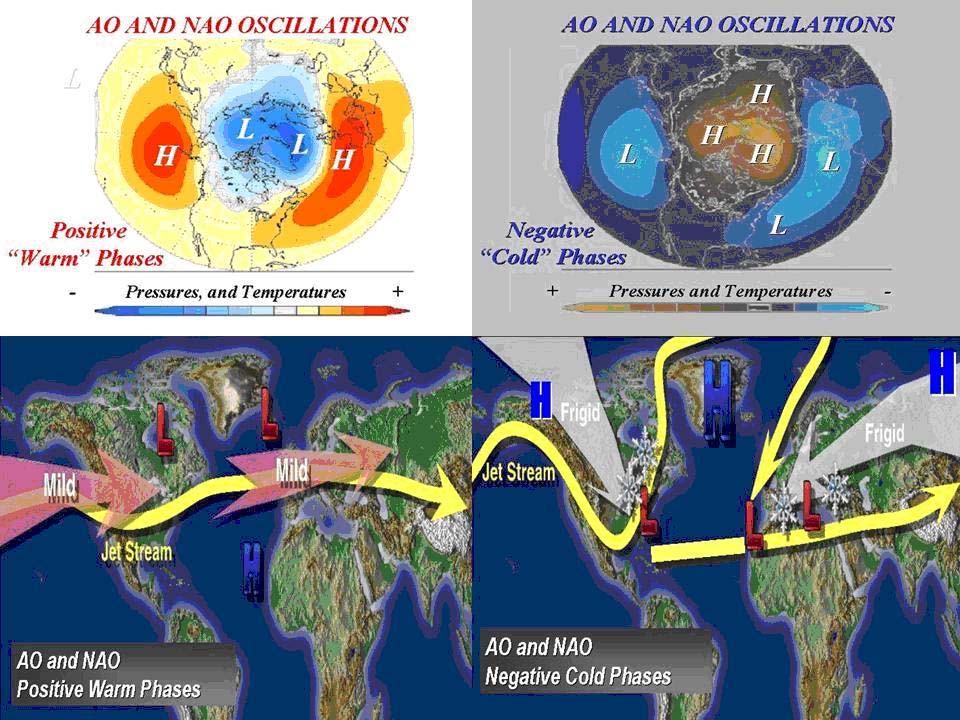
Effects of the Positive Phase | Effects of the Negative Phase
of the Arctic Oscillation of the Arctic Oscillation
(Figures courtesy of J. Wallace, University of Washington)
By Joseph D’Aleo, CCM
In a recent post to counter the snow and cold in the news that was spoiling the announcement by Dr. Hansen that it was the warmest year on record, NASA GISS authors note for November:
“Northern Europe had negative anomalies of more than 4C, while the Hudson Bay region of Canada had monthly mean anomalies greater than +10C. The extreme warmth in Northeast Canada is undoubtedly related to the fact that Hudson Bay was practically ice free. It is for this reason that some of the largest positive temperature anomalies on the planet occur in the Arctic Ocean as sea ice area has decreased in recent years.
The cold anomaly in Northern Europe in November has continued and strengthened in the first half of December. Combined with the unusual cold winter of 2009-2010 in Northern Hemisphere mid-latitudes, this regional cold spell has caused widespread commentary that global warming has ended. That is hardly the case.”
Bob Tisdale has relevant posts on Watts Up With That that here shows how NASA GISS removed Arctic and Southern Ocean sea surface temperature data and then used 1200km smoothing that uses land stations to refill in the data (resulting in a warming) and here how leftover warm water from a strong El Nino gets spun up into the Kuroshio-Oyashio Extension (KOE) where it continues to release heat to help explain why the ‘global warmth’ has persisted into the early stages of the current La Nina.
See in this Steve Goddard post here how Hansen blamed the cooling in recent years on La Nina but now has decided this El Nino warming is global greenhouse warming.
Even Kevin Trenberth, head of climate analysis at the National Center for Atmospheric Research in Colorado, admitted here: “We have seen rapid warming recently, but it is an example of natural variation that is associated with changes in the Pacific rather than climate change.”
We have shown how NASA and the other data centers have mined the data for warmth and manipulated the data – new and old – to enhance the apparent warming. This includes a cooling (up to a quarter degree or more celsius) of the pesky warm period from the 1920s to 1950s right up to 1980. This includes the NASA GISS base period for anomalies of 1951 to 1980. Numerous data issues post 1980 have exaggerated the warmth.

The warming NASA remarked about this fall in northeast Canada and Hudson Bay is part of the very strong negative arctic oscillation pattern we have seen the last few years, in part related to the long solar minimum and high latitude volcanoes.

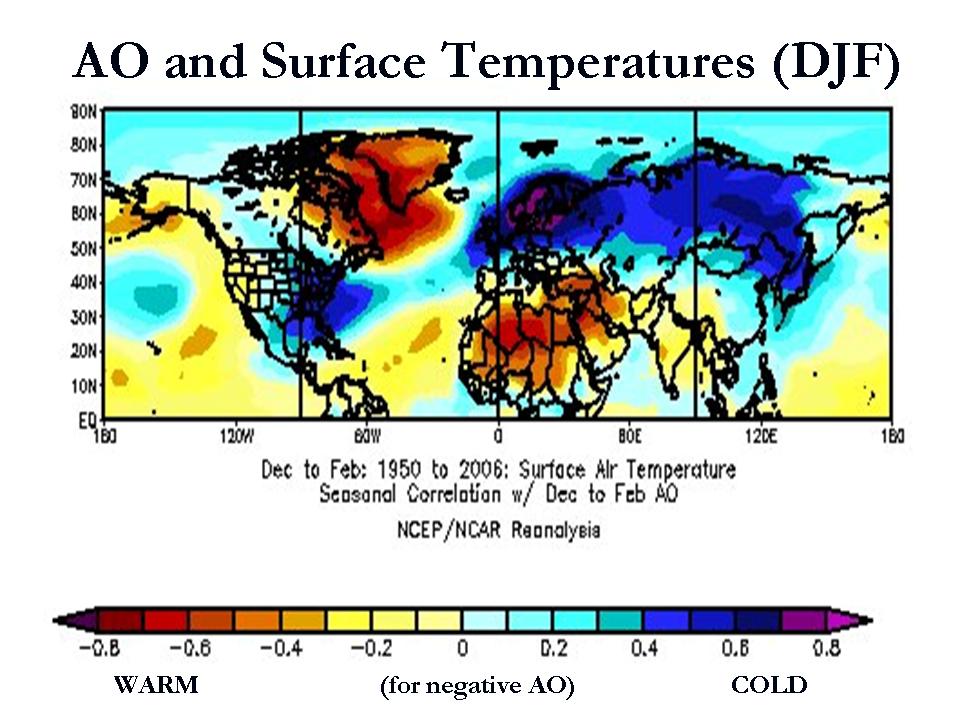
The positive AO state is characterized by an anomalously strong polar vortex that traps cold air in high latitude and more zonal mid-latitude jet stream that allows maritime Pacific air to invade North America and Atlantic air to flood Europe often as far east as the Urals. In the negative mode, high pressure dominates the polar region and North Atlantic, shunting arctic air south in North America and Siberian air west to Western Europe.
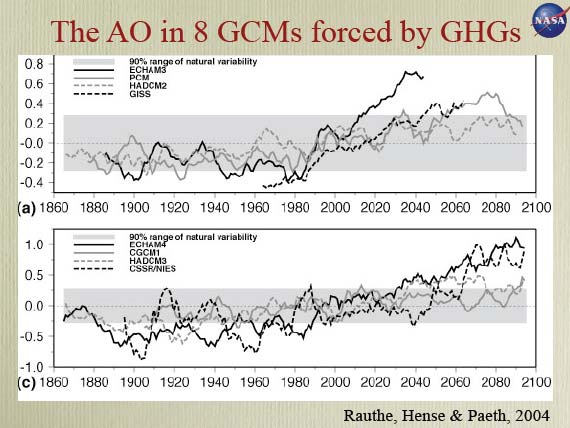
The greenhouse models all predict an increase in the frequency and strength of the positive arctic oscillation in time, most (2/3rds) exceeding the 90% range of natural variability.

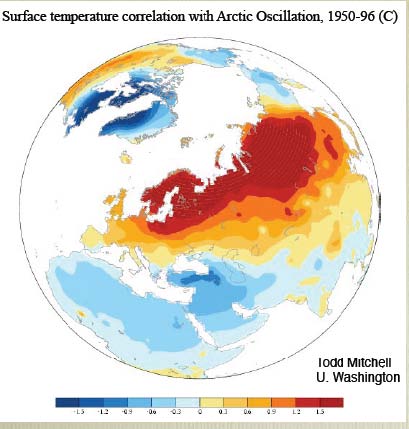
A positive AO would lead to increasing temperatures in the Northern Hemisphere continents with colder than normal air trapped in the arctic down to the northern parts of Canada and Hudson Bay. The following from Mitchell shows the warmth over Eurasia.

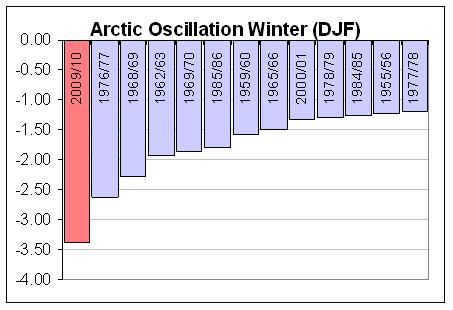
Last winter saw the most negative AO of the record back to 1950.

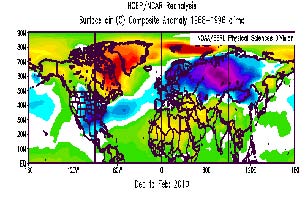
The global anomalies with a negative winter AO are as follows:

See how well that verified this past winter. No GHG need apply.

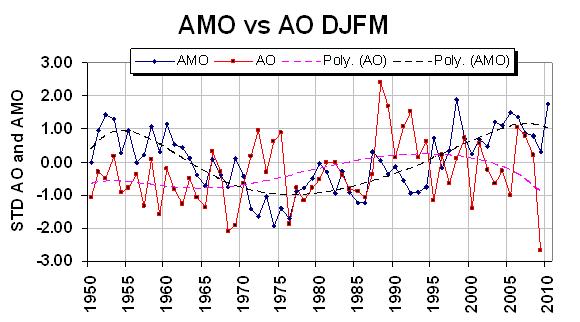
As noted, the North Atlantic Oscillation, an important component of the overall arctic oscillation varies with the ocean temperature tripole in the Atlantic, known as the AMO or Atlantic Multidecadal Oscillation. When the Atlantic is in the warm positive AMO mode as is currently the case, the NAO and AO tend to be more negative.

When the AMO is positive with warm water in the North Atlantic and in the Tropical Atlantic, the NAO was mainly negative (1960s). When the North and Tropical Atlantic turned cold in the 1980s, the NAO was mainly positive (data in chart above through 1999). Note the AMO flipped positive (warm) in 1995 with a big dip in the NAO. See the inverse relationship with the AO in the graph below. Data for both is averaged for the December through March periods and standardized.

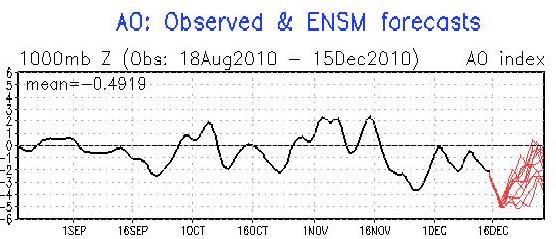
So far this late fall, the AO has been mainly negative and forecast by the model ensembles overnight to reach 5 standard deviations negative the next few days.

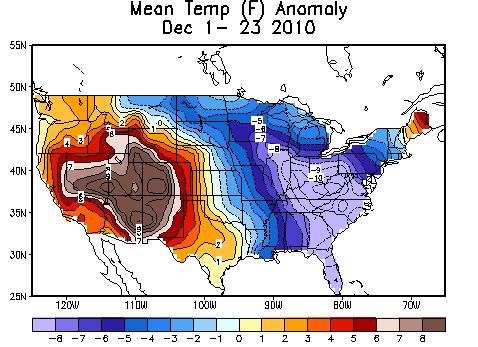
This explains not only the brutal cold in Europe and Asia but also the amazing 11F negative anomalies in the southeastern United States.

PDF of this report here.
Discover more from Watts Up With That?
Subscribe to get the latest posts sent to your email.
“It’s beginning to look a lot like Christmas, Everywhere I go.”
As so many people have said before “nature will do as it please” and now Trentbreth finally admits it, Joe Romm will blow a gasket for sure!
Yeah it is.
Check out the latest scientific discussion from the Raleigh NWS:
“The very cold Arctic air mass in place over our region is a rare
occurrence this early in the winter season. The winter weather event
expected later tonight and Thursday will also be a rare event. It is
rare to have average temperatures running 10.1 degrees below normal
for an extended period of time – even for the first two weeks of
December at Raleigh-Durham and Greensboro. This makes these first
two weeks of December the coldest ever at both sites.”
Wow. Coldest ever. Of course….that is only 120 or so years. So no big deal, right R Gates?
If it is no big deal on being the coldest “ever” then it is no big deal your stupid alarmist crap about the quote unquote long-term trends in the Arctic.
Chris
Norfolk, VA, USA
Shock: scientific colossus and visionary plays the Polar Bear card: …I ventured up to Hudson Bay in mid-November and saw the undernourished polar bears with their cubs…I actually saw climate change unfolding before my eyes. I wonder if the learned one (aka Michael E. Mann) managed to get to Hudson Bay without emitting the dreaded CO2 that is destroying the habitat of the beleaguered bears?
Doesn’t the AGW theory say the Arctic will warm and sea ice may disappear in time? But they also predict mainly positive AO for that period.
As Joe shows, a positive AO traps COLDER than normal air in the Arctic, hardly the stuff to melt ice.
This tells me the alarmist wags have no idea what makes the globes weather systems go around. Everything is based on one thing and one thing only, i.e. “CO2 is a GHG, we know since Arhenius that GHGs trap heat, therefore more CO2 must make the globe warmer.”
But as Joe humourously puts it, “Co2 need not apply.”
Hey Joe, the warm anomaly trapped around Nth West canada and Greenland due to the negative AO can’t stay too warm for too long even if the AO stays negative can it?
It looks very much like a big back door being left open in a house. All that warmth has to go somewhere, that somewhere has to be up. Especially since winter nights are so much longer than days, it looks to me like the planet has a back door left open and all that warmth that has accumulated during the latter half of 20thC is being funnelled straight out to space.
“SOMEBODY SHUT THAT *#&*$& BACK-DOOR!!!!!”
The last map shows Washington State a degree or two warmer for the first two weeks of December. True.
We had a cold blast in November but now the air is drifting in off of the Pacific (or not, depends on blocking and so on). We recently had a Pineapple Express dump loads of snow, then turn to rain, west side and mountains. East side of the Cascades missed the rain but it warmed up and the snow has settled from about 18 inches to 8 inches. Now colder and that remaining snow has frozen as a crunchy mass.
For the next week (to the 22nd) we seem to be more “climo” and getting slightly colder. With snow on the ground and a chance of flurries, we will have a white Christmas.
I like the location of the cold air into the upper mid-west and along the eastern states. I’ve lots of friends and relatives back that way but, hey, that’s their problem.
Lots of good information in this post. Thanks.
“When the Atlantic is in the warm positive AMO mode as is currently the case, the NAO and AO tend to be more negative.”
I do not see much correlation there. NAO runs in 40-year long sin wave cycle and AMO in 30 year cycle. NAO was mostly warm in 1920s and 1990s, AMO in 1940s and 2000s. Both were in cold phase during 1960-80.
http://notrickszone.com/2010/11/28/lesson-learned-predicting-the-european-climate-from-the-cet-record/
I looked up Hudson Bay on Cryosphere Today and it seems
to be on course to to be fully iced over by New Years day.
5 StDevs? Wow, did someone discover a new particle?
I do find these posts quite difficult to follow, I hope this is not foolish question. Do we know whether these types of weather patterns prevailed during the Dalton and Maunder minimums? Is it a possibilty that we are seeing the beginnings so of another long period of cold in Europe, another mini ice age?
I remember reading that the famines and mini ice age in the 1300s started with very wet summers in the UK, so wet the farmers could not harvest their crops. We had very wet summers here in the UK in 2008 and 2009, so wet that many farmers did not get their hay inside until September. If they had not had modern machinery it would have rotted in the fields.
“Northern Europe had negative anomalies of more than 4C, while the Hudson Bay region of Canada had monthly mean anomalies greater than +10C.
so negative anomalies get thrown out, and positive anomalies get double weight?
A second question. It seems that the team at WUWT are getting quite a good handle on the various ways the temperature data has been manipulated to show extra heat. Has anyone made a list of these methods, and which are the most notable?
“The last map shows Washington State a degree or two warmer for the first two weeks of December. True.”
We had a “Pineapple Express” last week and it looks like we have another one coming this weekend. The Sierras are going to get dumped on but it might be rain below 8000 ft.
Baa Humbug says: “…it looks to me like the planet has a back door left open and all that warmth that has accumulated during the latter half of 20thC is being funnelled straight out to space….”
Hmm. Uneven distribution of the blackbody temperature of the sky? Variations is same with lower solar activity?
how did the polar bears have cubs if they are undernourished?
last time i looked, Mother Nature has a tendency to suppress fertility when there is a shortage of food.
Well, that explains why we here in Buffalo are getting our butts buried in all this snow. The storms hit the east coast and do a u-turn and head on up into Canada, sending all that cold air on down to us and, more importantly, setting up all these persistent lake effect snow bands, all thanks to those slow spinning low pressure storms. And all we get from the on-air weather weenies is that there’s an unusual low pressure area stuck in Canada, spinning around and sending us all this bad weather. Or that it’s unusual for such a system to be headed westward. This is the sort of stuff they should know and be able to explain that we may see this mess continue for x number of days/weeks. Instead they keep acting surprised.
Time for a reminder:
http://climaterealists.com/index.php?id=6645
“How The Sun Could Control Global Temperatures”
Since initial publication and as a result of a lengthy exchange with solar specialist Dr. Leif Svalgaard I am inclined to the view that pinning the entire phenomenon on solar protons may be overly simplistic.
Nonetheless the creation of ozone depleting reaction products from a number of solar linked causes does, to me, seem likely to be the cause of cooling of the mesosphere and stratosphere when the sun is active (positive AO) and warming when the sun is quiet (negative AO) which would give the required reversed sign solar effect to support the propositions in my article.
To resolve the issue we need to await updated data concerning the temperature trends in mesosphere and stratosphere since 2007.
Stephen Wilde says:
December 15, 2010 at 10:57 pm
To resolve the issue we need to await updated data concerning the temperature trends in mesosphere and stratosphere since 2007.
If they’ve been warming, publication of that information will be delayed as long as possible. A cooling stratosphere is a central plank in the greenhouse theory.
tallbloke;
If they’ve been warming, publication of that information will be delayed as long as possible. A cooling stratosphere is a central plank in the greenhouse theory.>>
Wouldn’t they just adjust the theory to predict a warming stratosphere as a result of greenhouse gas instead? Seems so much simpler than adjusting the data to match the theory…
It occurs to me that strong, cold negative AO and NAO seem to push cold arctic air exactly where the centers of the glacial ice-shields on the european and northern american continents were during the past ice ages.
Pray it ain’t so yet again, folks – or the polar bears will be playing with their cups on the ice of a frozen Hudson River instead of Hudson Bay sooner than you think…
What a week to pick to work outside; -20C late yesterday according to the car temperature readout (SE Finland).
Typo under D’Aleo’s first graphic:
“it part related”
(Change to “in …”)
[An edit made it in. Thanks… bl57~mod]
http://wattsupwiththat.files.wordpress.com/2010/12/ao21.jpg
The graph is interesting and the first I’ve seen comparing the GISS global pre-satellite, pre-adjustment and post-adjustment values.
However (as a layman) I think the star indicating the 2009 satellite value is a bit misleading, although there has been a distinct divergence between GISS and both satellite series.
http://woodfortrees.org/plot/uah/mean:13/plot/gistemp/from:1979/mean:13/offset:-0.15/plot/uah/trend/plot/gistemp/from:1979/trend/offset:-0.21
I suspect that Hansen’s intention is to present a relatively smooth temperature increase, which is more consistent with a monotonic increasing CO2 forcing.
Let’s see where his craft takes him.
After all that, what’s the weather like?
All this “global warming” is freezing US to death…
Ohio lighthouse turned into an ice-house by cold weather.
Snow and ice have created an alien landscape around Lake Erie.
See the spectacular video –
http://www.telegraph.co.uk/topics/weather/8205402/Ohio-lighthouse-turned-into-icehouse-by-cold-weather.html