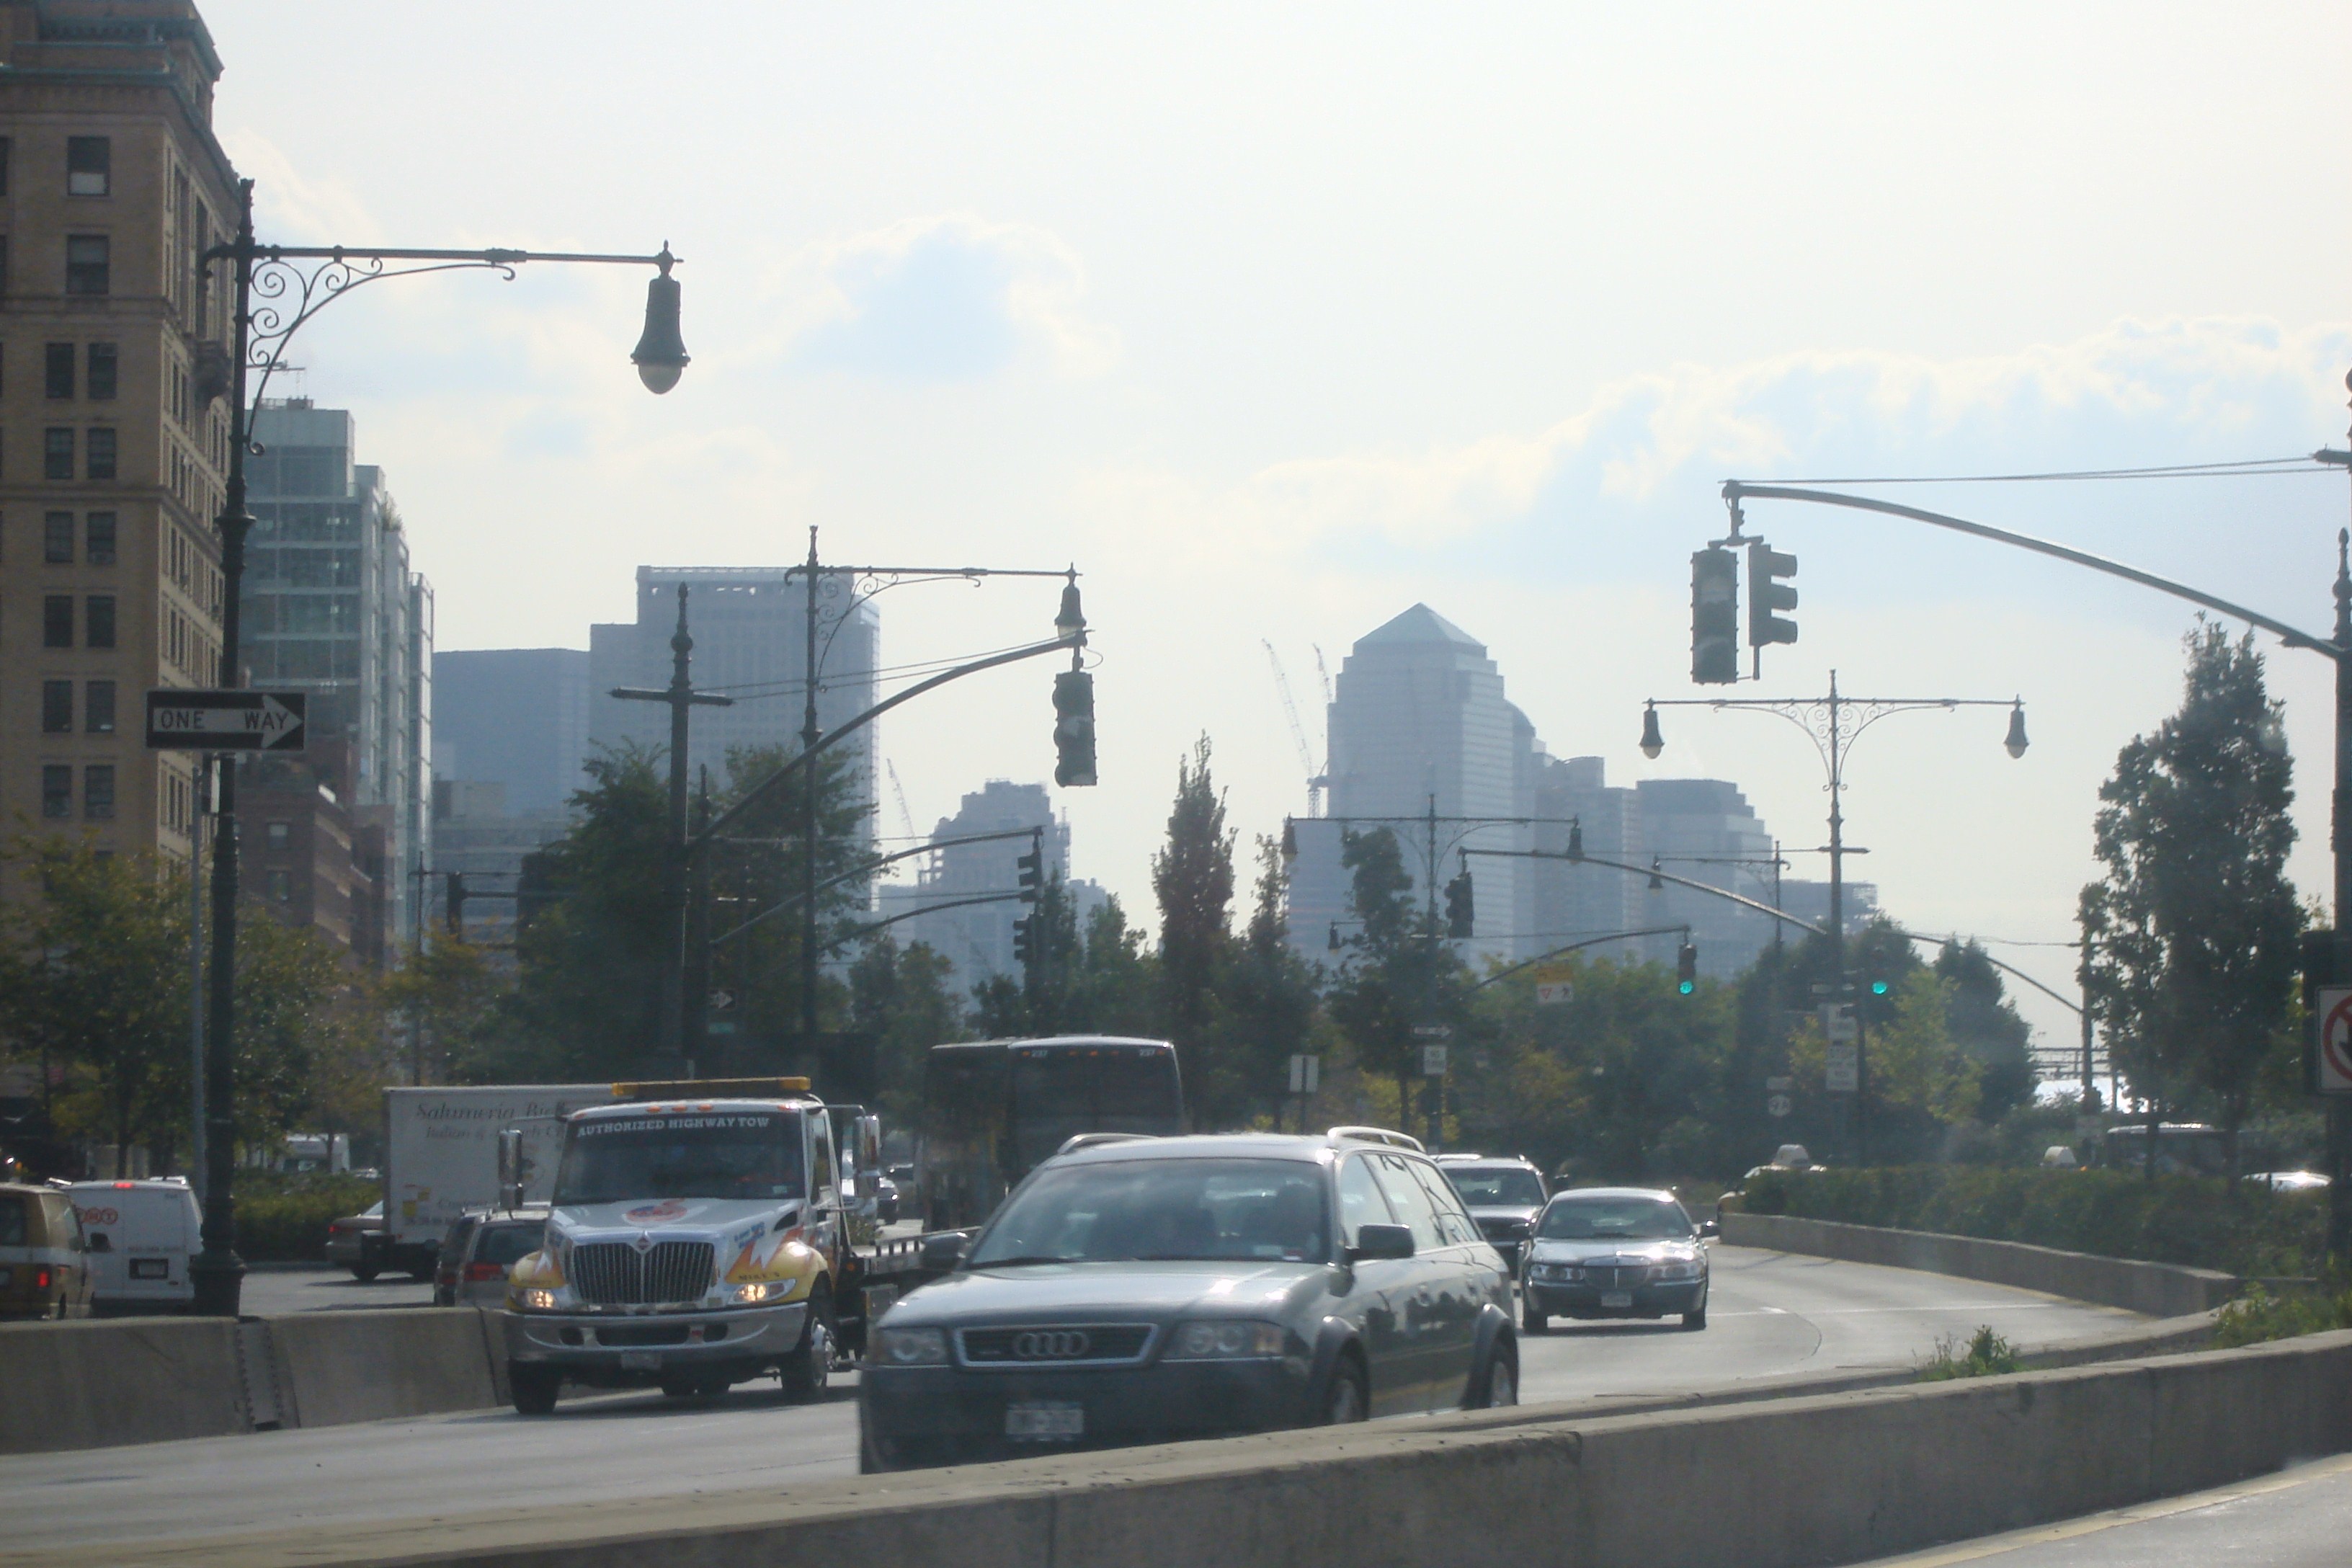
One of the more common visual tactics used by AGW proponents to scare people into thinking that AGW induced sea level rise is a big threat is to show altered photographs and GIS models of a city near the ocean (take your pick, New York, London, San Francisco etc.). These futuristic images demonstrate what the city might look like once global warming kicks in and kicks our butt, apparently without anyone noticing the advance of the sea. Take for example, lower Manhattan, one of the more common targets. The top image is a future shock rendition from the History Channel “Armageddon Week” and the bottom image is a photo of present day reality from Wikimedia.


Scary huh? And it’s not just photos, now that most anyone with a PC can run Google Earth, there’s a veritable cottage industry of people who make sea level inundation KML files using the 3D buildings feature for major cities. It works very well to get people’s attention. But how much of a looming threat is it when compared to the reality of measured sea level rise? Let’s find out.

Will Manhattan really look like that in the future? You can even interactively freak yourself out here, at Climate Atlas, and see what it looks like in NYC when the entire Greenland Ice Sheet melts:

Gosh.
Well, I can see how people must be terrified. Just look at this plot of sea level rise at the Battery Park tide gauge from NOAA:

Yeah, it’s headed up, wayyyy up. 2.77 millimeters per year. So, to get the levels in the photo and 3D GE model shown above, we’d need to do some simple calcs.
The Google Earth 3D model is easy. It specifies a 3-5 meter sea level rise, so we’ll call it 4 meters.
For calculation purposes, we’ll assume sea level rise to be linear, and round up the Battery Park tide gauge rate to 3.0 mm per year, which puts it closer to the 3.1 mm per year measured by satellite and published at Colorado State University’s Global Sea Level Page.
4 meters = 4000 millimeters
4000 millimeters /3.0 millimeters per year = 1333 years

Now, how about the doctored image from the History Channel? There’s no reference given on the height of sea level rise on the web page, but fortunately, we have built-in yardsticks in the image. The story height of buildings in the photo can easily be estimated from the before and after photos shown at the top of this post.
I’ve selected the white building on the northeast side of Battery Park, along South St. I counted 18 stories of that building as being underwater using the hi-res image here , and I’ll estimate from other objects in the photo (like the water to pier to street height) that it is an additional 2 stories from street level there to the present day sea level (PDSL).
So what is the height of a story? The Council on Tall Buildings and Urban Habitat gives a handy guide on story height for office buildings like that one. They say that an office building like that one has a story height of 3.9 meters , so we’ll use that.
History Channel photo submersion = 20 stories
Story height = 3.9 meters
Sea Level Rise in the photo 20 x 3.9 meters = 78 meters
78 meters = 78,000 millimeters
78,000 millimeters / 3 millimeters per year = 26,000 years

26,000 years to get that? Would those buildings still be standing then? And even more important, wouldn’t we be in a new ice age by then? If we did enter another ice age, sea level would be lower, as demonstrated in this graph below. Note the level 24,000 years ago.

This demonstrates the folly of assuming that climate change, and hence sea level rise, is linear. As we all know, it isn’t, yet that doesn’t stop many AGW proponents from using present day measurements to project linearly into the future and then generate scary scenarios and visuals from it.
Even on the short-term, such predictions fail miserably. Take for example Dr. James Hansen of NASA GISS. Read his prediction 20 years ago about sea level rise in New York City, which I previously covered on WUWT in A little known 20 year old climate change prediction by Dr. James Hansen – that failed badly.
He said that [in 20 years]:
“The West Side Highway [which runs along the Hudson River] will be under water.
Problem is, here it is 20 years later, and people still drive that highway today without the use of Jet-Skis.
What got me started on this post was a comment left on WUWT by “Rascal”
Submitted on 2010/11/26 at 7:46 pmCopy the following address in to your browser, and observe the expansion of lower Manhattan since 1660.
http://www.racontours.com/archive/coastline_anim.php
Note that the West Side Highway (West Street) over half of the World Trade Center site, and the South Street Seaport were “under water” in 1660!
He’s right. And one thing many AGW proponents don’t consider (in addition to the non-linearity of climate) is the adaptability of humans. For readers here, I’ve taken that Flash animation at Racontours.com and made it into an animated GIF below:

They write about this historical account of lower Manhattan:
Based on our study of historical maps of Manhattan, Racontours has been able to create this simulation of the expansion of the island’s coastline. This topic is covered in both our South St. Seaport and Lower Manhattan tours, and most people are amazed at the transformation that’s taken place. Pearl St, named for the seashells that washed up there, once ran along the river. (Click here for a view of Captain Kidd’s house at the corner of Pearl & Wall Streets)
The first land reclamation was undertaken by Peter Stuyvesant upon taking over as the colony’s governor in 1646. Hoping to facilitate waste disposal and transportation, he organized the excavation of the canal along what is now Broad St. Back then, this was still called New Amsterdam, and the Dutch were great believers in canals.
By the American Revolution, the city’s population had grown to 30,000, and land had become scarce and cramped in the city center. That’s when the city began to sell ‘water lots’, wherein entrepreneurs would seek to use landfill to create additional lots for use.
The most recent landfilled area led to the creation of Battery Park City, built in the 70’s on the earth excavated from the World Trade Center’s foundation.
Based on the 2.77 millimeters per year (call it 3 mm) of current sea level rise as shown by that Battery Tide gauge, in the 344 years (1660-2004) the sea level would have risen by:
344 years x 3 millimeters/year = 1032 millimeters or 1.032 meters.
Clearly, New Yorkers have been able to stay well ahead of that 1 meter rise since the city was founded.
The next time your friends get freaked out about sea level rise, or “high water”, show them this.
Click here for more on you La Palma Rock rock:
<a href="http://www.lapalma-tsunami.com/
Holy cow, that piture must show a 100 foot rise in a sort time span (modern buildings dont seem to last that long, I have driven across a road bridge build in the twelth century and the river is about what it was then., I dont suppose many modern structures will be standing in 800 years.
I thought everyone knows that alarmists have shifted from dramatic sea level rise to “extreme” weather events? Those are much easier targets, since they happen all the time. It’s like watching tribal elders blame heatwaves, coldsnaps, floods, drought and storms on angry gods. Pathetic.
Anthony, you have created a great post – again!
Much the same story line can be made for the Puget Sound Lowland (Seattle and Tacoma are the large cities that have built partially on fill).
However, the very serious threat is not the slow rise or fall of sea level. There exists the real possibility of a massive shift of the coastal area and a seismic event not experienced here for hundreds of years. The evidence for earthquakes along this plate margin of Magnitude 9+ is known.
See here about PANGA (Pacific Northwest Geodetic Array):
http://www.geodesy.cwu.edu/
The link on the upper left “Cascadia Earthquake Rupture Model” is part of the story. [Sunday evening 11/28/2010: the server seems a bit flaky – I’ll check with CWU on Monday]
Here is a Seattle Times story (one year ago):
http://seattletimes.nwsource.com/html/localnews/2010284740_megaquake17m.html
Moral: Many serious problems worldwide are not getting the attention they deserve, while CAGW sucks money, political leadership, and action into a void.
Ken Roberts says:
November 28, 2010 at 5:15 pm
“NOthing is as it seems, it seems…”
_____________________________________________________________
Word.
Dave N says on November 28, 2010 at 6:05 pm
More cargo-cult science.
Anthony, and who owns the History channel?
No wonder sea level is rising, we keep throwing our garbage into it and then building on it!
78 metres in that photoshopped image, you say?
A quick calculation, which I did a year back, taking the area of Antarctica, the maximum thickness of the ice, assuming it all melted and distributing it all over the oceans of the world gives 70 metres. And that’s a big overestimate because on every point it overestimates the resulting sea level rise. (I have seen reports of more careful estimates giving 60 metres.)
In other words, there isn’t enough water on Earth to produce the photoshopped result, let alone take 26,000 years. Antarctica will be a baked desert before that happens. The History Channel is pretending to report truth but is making up fantasies.
timheyes says:
November 28, 2010 at 12:29 pm
Oh my. It really is worse than we thought. If Manhattan has got wider, that means the Hudson has got narrower and the water is running into the sea faster!! /sarc.
According to a program on the History or Discovery channel (I don’t remember which) that is exactly the problem that some engineers are worried about, since the increased flow rate will cause the bed of the river to wash out to sea, uncovering the trans-Hudson tunnels.
“For calculation purposes, we’ll assume sea level rise to be linear, …”
It is not. You even admit this later, accusing nameless others of assuming this, but than repeatedly use it yourself. The post is utter nonsense. The issue is how fast glaciers will melt with rising temperatures. Ice flow dynamics are poorly understood, so there is a great deal uncertainly. Playing craps with our future is an option, just not a very smart one.
Your alleged quote from Hansen is apocryphal. But, you know that.
The fact that the we have built out, extending our shorelines, makes possible sea level rise potentially more destructive. And while adaptation will be necessary it is not likely to be possible everywhere. Places such as Bangladesh and the Mekong Delta are very venerable. And how do we convince the plankton to adapt?
If you are so sure we can adapt to anything, why are you so sure we cannot reduce GHG emissions? Mitigation and adaptation are both valid. Why fight with one hand tied behind our backs?
REPLY: Oh puhleeze. Alleged quote? It’s in salon.com and a book:
http://dir.salon.com/books/int/2001/10/23/weather/index.html
Your comment is utter nonsense. You simply can’t handle another point of view. – Anthony
Ken Roberts,
Your first link is not working, but the second one is. Thanks – glad to have learned the truth about La Palma Rock and the insurance industry’s perfidy.
I used to watch the History Channel’s (or Discovery Channel’s) armageddon or mega-disaster programs, more for comedy than anything else. It’s kind of like a tease – they talk about potential natural disasters (e.g. the Yellowstone caldera), but interwoven very carefully amidst the apocalyptic talk, and always downplayed with some subtlety, is some smidgen of truth about the possibilities of it on the geologic time scale, which are in fact very slim. They sure don’t let facts get in the way of a good story.
Living in an area now that used to be under a great inland sea some millions of years ago, I remain amused.
[snip – we don’t need vulgarity in your comments to push your point of view repeatedly. – take a time out ~mod]
@Anything is possible
“…There is a volcano called Cumbre Vieja…”
And there is also the Tuscaloosa seamount. It is a piece of one of the Hawaiian islands that fell off quite a while back. Those islands are quite prone to having parts of them fall off. Thankfully the power dissipation of something like that spreads out the energy quite fast as you get further from the source. Sure, it will really really [censored] for anybody on the island, but a few thousand miles out you will be lucky if you notice it.
The Sumatran quake caused a lot more damage due to the nature of the event. Effectively, several hundred square miles of ocean were lifted a few feet. All at once. It was… several orders of magnitude larger than a chunk of island falling off. Of course, the bigger the chunk, the bigger the splash.
That seamount… the Tuscaloosa, is 17 wide, 30 km long and 1.8 km high from the seafloor to the top. Dunno how much is buried in the muck. I imagine that it made a sizable splash. BTW, it made it about 50 km out from the island… relatively intact.
More here:
http://walrus.wr.usgs.gov/reports/reprints/Moore_JGR94.pdf
Why do I mention that? Well, I’ve seen that documentary where the guy is putzing around in the fissure of where the headland scarp is going to form. Impressive… until you look at The Great Crack. It’s a feature on the big island of Hawaii. At 60 feet wide… it’s a bit larger that the one on Cumbre Vieja. This one is about 8-miles long. It’s also close to and probably associated with the Hilina Slump.
Eventually… dunno when, it’s gonna let go. In 1975 it suddenly dropped about 11 feet and cause a magnitude 7.2 quake. Per Wikipedia (cuz I’m lazy) it has a 10 cm/yr movement from 1090 to 1993.
No… the Cumbre Vieja doesn’t keep me up at night. But your point is valid. There is much more to worry about than a 2.77 mm/yr sea level rise.
Errata: “10 cm/yr movement from 1990 to 1993.”
Mike says:
November 28, 2010 at 8:30 pm
Well that clearly didn’t work as expected.
Mike says:
November 28, 2010 at 8:30 pm
” Places such as Bangladesh and the Mekong Delta are very venerable. ”
So, apparently, is the Pope.
[???]
November 28, 2010 at 11:42 pm
[snip – we don’t need vulgarity in your comments to push your point of view repeatedly. – take a time out ~mod]
DO TELL: How is evidence of what happened both 1000 and 2000 years ago, considered ‘vulgarity?’
You’ll be talking about that, won’t you?
In the meantime, there’s this to REMIND you:
HOW IS THIS VULGARITY?!?!?!?!
http://www.archaeoleg.org.uk/pdf/roman/KEY%20SITES%20SE%20WALES%20ROMAN.pdf
HOW IS THIS VULGARITY?!?!?!?!
http://www.yorkshirepost.co.uk/news/Discovery-of-log-boat-shows.5537797.jp
HOW IS THIS VULGARITY?!?!?!?!
http://www.maldonsx.freeserve.co.uk/Maeldune/first_maldonians.htm
HOW IS THIS VULGARITY?!?!?!?!
http://www.severnestuary.net/sep/pdfs/severnarchaeodesignguidefinal06.pdf
HOW IS THIS VULGARITY?!?!?!?!
http://www.rcahmw.gov.uk/HI/ENG/Heritage+of+Wales/Places/Sea+and+Coast/
TALK ABOUT THAT, WON’T YOU?
REPLY: OK, you had your warning about language (in your post that was snipped, it was the language you used and not the content), and you continue to insist that we immediately follow your discussion path. Even if your info supports what this article is about (I don’t know that it does or doesn’t, it seems nonsensical), the way you are going about it and bombing threads repeatedly with these links and demands that we pay attention to them is unacceptable.
So, let me make this easy for you and for our moderators: You are BANNED from WUWT. – Anthony
“The West Side Highway [which runs along the Hudson River] will be under water in 20 years” —with the sea level rising at about 3mm per year and the land still rising at up to 1cm (10mm per year) as post glacial rebound … see:
http://en.wikipedia.org/wiki/Post-glacial_rebound … it’s going to take a bit longer than 20 years for the highway to turn amphibious. Add to that, the reclamations and I don’t think New Yorkers, nor anyone else on the North Eastern seaboard from Hudson Bay south, has anything to worry about at all.
It was precisely this sort of alarmist rubbish that made me look into this AGW stuff further. I started to come across articles which, if you had just had the most basic ability with a calculator, were complete nonsense. Little did I know then that they were just the tip of the iceberg (sorry!).
“Playing craps with our future is an option, just not a very smart one. ”
Once again, a warmist demonstrates that people in their religion never passed sixth grade. Reading comprehension is something you should have learned if you had. I have watched your posts here for about a month now. You have never read anything said by anyone here and chime in with rhetoric which is emotional, non-scientific, and snarky.
Fear and emotional appeals are what religions have been using for centuries to guilt and/or force people into doing things that they do not believe in. Everytime you repeat that, you make the smarter people distance themselves from you even more. So if we made a graph of believers of agw and intelligence, we would find it to be an upside down hockey stick. . . . . Ironic, I know…but you must admit the battle was lost a little over a year ago when the truth came out.
Larry in Texas:
I live on a peninsula that was probably completely underwater much more recently than Texas. All is well here and I seem to be doing fine at 42ft elevation. I also remain amused. The house that I lived in as a kid on the barrier island is on a canal and the sea level is the same distance below the cap on the seawall as it was 40 years ago.
Larry in Florida
“You can even interactively freak yourself out[…]”
Quote of the decade!
@899, (why you picked part of the nomenclature for the AS-899 high band antenna for a countermeasures receiver as a name is beyond me)
But when you YELL…. I, and many others, instantly ignore you. So enjoy your emotional tirade. This is the only response you will get from me… and it was solely because of the name you chose, not what you have to say.