By Joseph D’Aleo, CCM
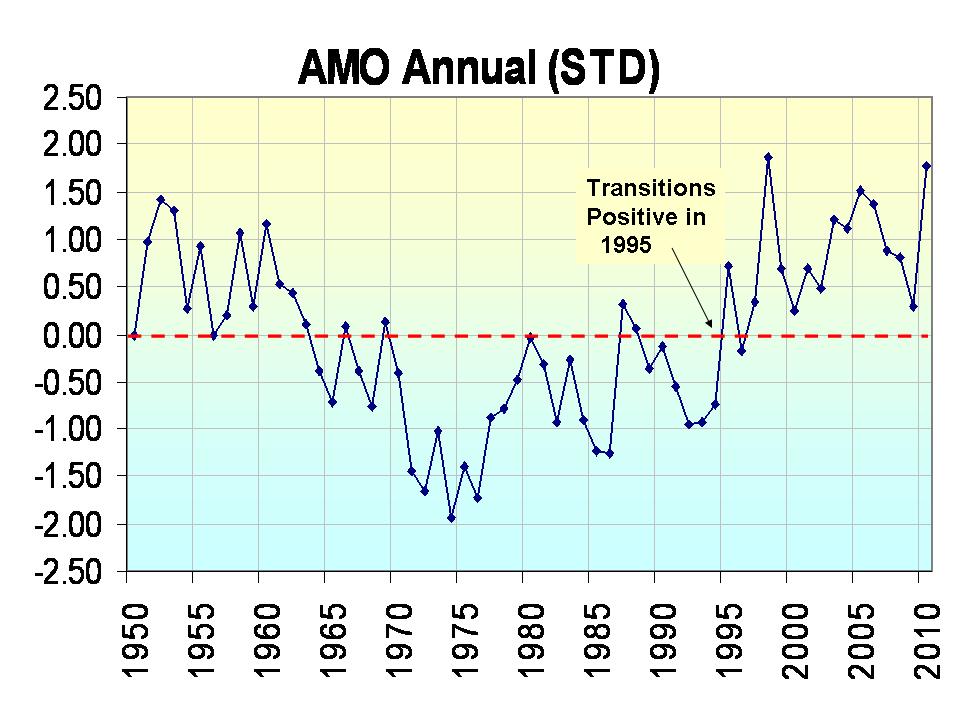
The North Atlantic undergoes a multidecadal oscillation appropriately called the Atlantic Multidecadal Oscillation or AMO. It is officially the mean sea surface temperature anomaly from the equator to 70 degrees North. It went above the longer term mean in 1995. The AMO has a long term cycle of about 60-70 years.
Enlarged here
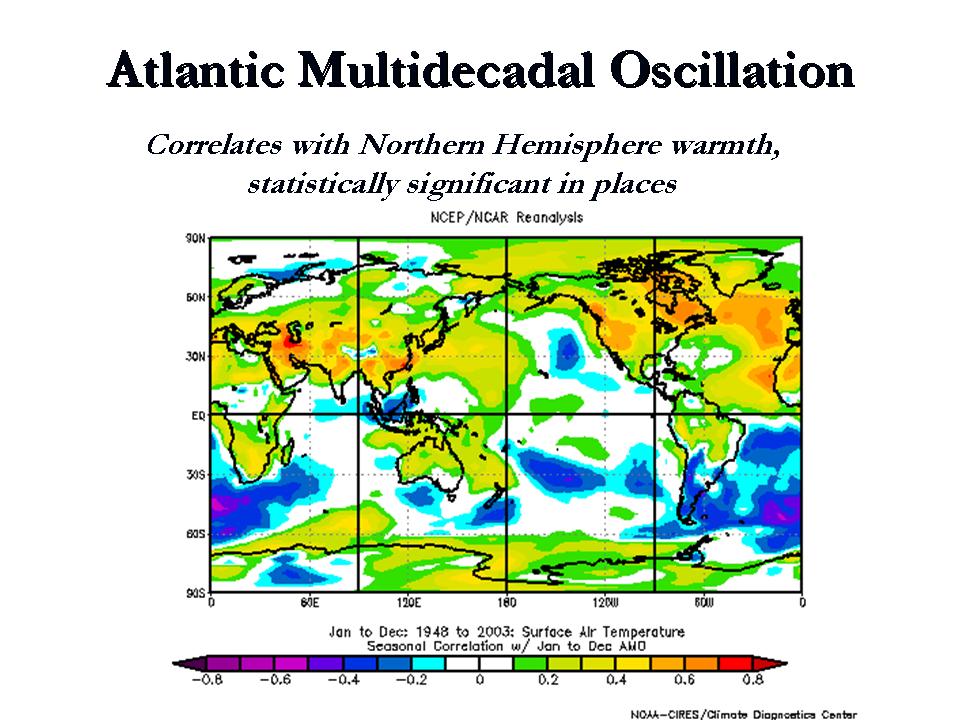
When the AMO is positive (warm) the Northern Hemisphere is warmer than normal on an annual basis across the continents. When it is cold, it is colder. The positive state is associated with a warmer arctic and Greenland and more summer hurricanes in the Atlantic Basin.

Correlation of annual temperatures with the AMO. Yellows to reds are positive and blues negative correlations with the AMO state. Enlarged here.
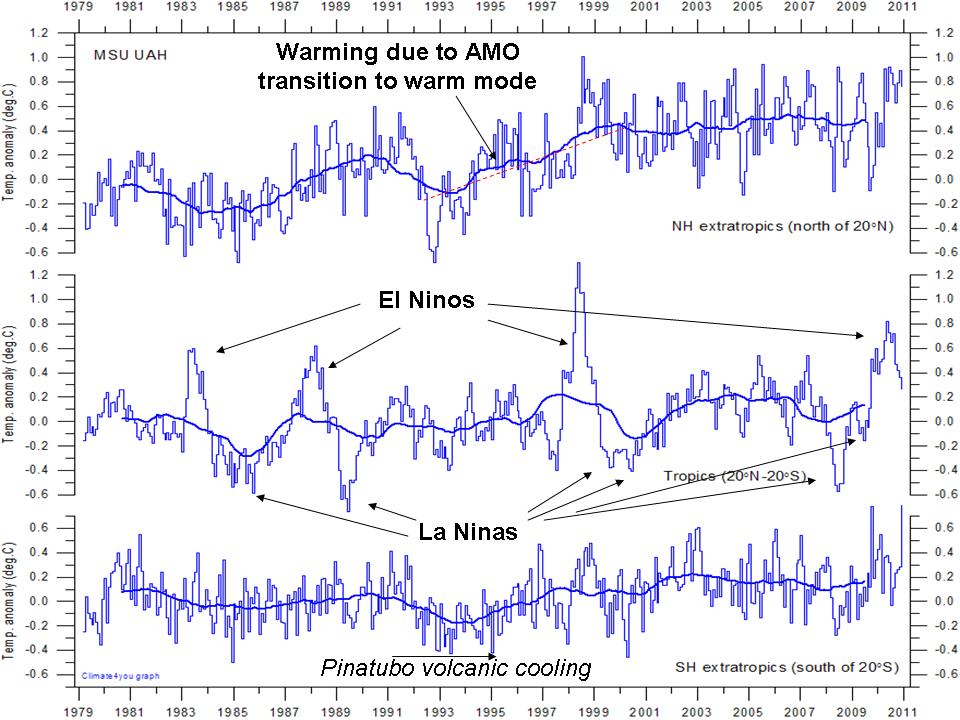
This can be also seen in the satellite derived temperatures for the Northern Hemisphere (north of 20N). There is little continuous trend since 1979. Most of the warming is in the 1995 transition from AMO negative to positive. Note the temperatures in the tropics reflect the ENSO state but has no perceived trend. There is also no trend in the Southern Hemisphere. The only significant departure was with the volcanic cooling also seen in the Northern Hemisphere after Pinatubo in 1991-1994.

UAH Satellite temperatures by latitude zone – Northern Hemisphere poleward of 20N, tropics, 20N to 20S, Southern Hemisphere poleward of 20S. Enlarged here.
The AMO tracks to the solar irradiance with a lag of about 8-9 years. This suggests the current warm AMO state will end by around 2015. Northern Hemispheric temperature will take a leg down. With the cooling of the Pacific now and more La Ninas, look for net cooling especially in the tropics until then.
See more here.
Discover more from Watts Up With That?
Subscribe to get the latest posts sent to your email.
tallbloke says:
November 2, 2010 at 1:57 pm
Incidentally Harald Ynestad found a correlation between lunat cycles and N.Atlantic temperature
So, in cyclomania-land there is a handy lag of 8-9 years between the sun and the moon.
richard telford says:
November 2, 2010 at 2:03 pm
What is the prime mover?
So you want to know the “lapis philosophorum”; alchemist said that it was everywhere…
Or the freemason’s “verbum dismissum”, or the Greek’s “metron”, or Pythagoras “Tetraktis” or the Salomon’ s clavicle or what the two Imams so jealously guarded ?
🙂
richard telford says: November 2, 2010 at 2:03 pm
But what drives these modes of variation? What is the prime mover?
I am putting my idea in a short story for young children. By time they are adults it may be taken seriously!
AMO (as reflected in CETs):
http://www.vukcevic.talktalk.net/CET-NAP.htm
PDO :
http://www.vukcevic.talktalk.net/PDOc.htm
@vuk, AMO is just detrended SST for North Atlantic. Its relatively warm water enters the Arctic basin. Arctic is as “warm” (or cold) as warm is the water entering it. Something also comes from Pacific via Bering strait, so PDO plays its lesser role as well.
Your graph does not prove that Arctic temperature drives Atlantic SST.
That magnetism relation is very striking, but I think those magnetism changes are just a side effect of the real driver, which is, hm, I do not know 🙂
The AMO was high in 1950. It’s high now. Is the global temperature the same now? No, it’s almost 1 degree C higher now. The AMO can’t be responsible for that 1 C.
All the cyclical climate swings (on the timescale of Roman Warm Period / Dark Ages / Mediaeval Warm Period / Little Ice Age / Current Warm Period) we know about are
induced by changes in the level of solar activity but are capable of being
modulated by ocean behaviour.
The increased level of solar activity brings more solar protons into the
mesosphere which cools due to ozone destruction and the ozone holes grow.
The energy flux from the stratosphere increases so it too cools, the
tropopause must rise because the temperature differential between surface
and stratosphere has increased and that draws the jets poleward.
Most seem to agree that the jets move poleward when the sun is more
active (even Michael Mann in a past paper) so no disagreement there. It is only my description as to how the effect is achieved that is novel and that has been forced on me by simple observation. It also fits the recent Haigh data so if that is confirmed in
the future my work will become very significant because I first predicted just such an atmospheric response in an article published last November.
So the cloud bands move poleward, decreasing total cloud quantities and decreasing albedo thus allowing more energy into the oceans which encourages a warming bias towards strengthening El Ninos and weakening La Ninas.
The opposite occurs when the sun is quieter.
Throughout all this there continues to be shorter term solar variability
from flares, sunspots and individual solar cycles which continue in the
normal way.
And since solar protons are charged particles drawn in at the poles along the Earth’s magnetic field lines this description encompasses the varying size of the ozone holes and any climate links to variable magnetic field strengths.
Unfortunately it will also upset many in both the warming proponent and sceptical camps.
Joe- there are a few things I have to take issue with. First and foremost is the designation of “oscillation” for temperature changes that have not been observed for a full cycle and whose dynamics are unknown. This goes for the AMO, the PDO and a host of other candidates nominated to “oscillation” status. The only real oscillation whose dynamics are known is the ENSO and I had to do it myself despite thousands of readings that nobody understood and constantly misrepresented. The second thing is the fantasy of Pinatubo cooling that appears on many temperature curves including yours. What is attributed to that volcano is the La Nina cooling of 1992 and is not volcanic influence. It’s aerosol cloud shot up into the stratosphere and caused some warming initially which turned to cooling two years later. That was at a height of 16 to 22 kilometers and it never reached the troposphere where Roy Spencer has it ensconced. Neither Pinatubo, nor El Chichon, nor Gunung Agung, nor even Krakatao did any tropospheric cooling whatsoever despite what you read about them. What happens is that ENSO – El Ninos alternating with La Ninas – has been active all these years and when a volcano erupts just when a La Nina begins they assign that La Nina cooling to the volcano. That happened with Pinatubo and Gunung Agung. But El Chichon was out of luck – it picked a time when an El Nino was beginning. And Krakatao got in a little bit on the tail end of a La Nina and was assigned 0.2 degrees cooling by the so-called “volcano experts” who don’t know what they are talking about. I have some very interesting figures about this in my new edition that you ought to get when it comes out later this month. As to the satellite curves you show, it is absolutely true that there was no warming in the eighties and nineties before 1998 when that super El Nino arrived. That period was nothing but ENSO oscillations and was comprised five El Nino peaks with La Nina valleys in between. But 1995 has no particular significance beyond being an El Nino year. There really is warming but it begins with the super El Nino of 1998, raises global temperature by a third of degree in four years, and then stops. That’s in 2002 and from that point there has been no warming. It is a flat temperature plateau that lasts for six years which I have called the twenty-first century high. It came to an end with the La Nina cooling of 2008 which signified the return of the oscillating climate we had in the sixties and seventies. As I expected it was followed by the El Nino of 2010 which has now peaked and the next La Nina is already on the way. These are the ENSO oscillations that are present in all temperature curves if some idiot did not wipe them out with a running mean. They have been with us ever since the Isthmus of Panama rose from the sea and are expected to continue for the foreseeable future. They were temporarily interrupted by the super El Nino which is not part of ENSO, and by its aftermath. The warming involved is oceanic in origin and was caused by the huge amount of warm water from the Indo-Pacific Warm Pool that the super El Nino brought over. That was twelve years ago and I am not sure why we haven’t seen it start to go down. This particular warming is the only real warming within the last thirty years. One third of a degree is half of what is assigned to the entire twentieth century and is apparently enough to make the first decade of this century the warmest on record.
richard telford says:
November 2, 2010 at 2:03 pm
But what drives these modes of variation? What is the prime mover?
The Sun and the Moon shift the Earth’s ocean tides more than any other bodies in the solar system.
richard telford says:
November 2, 2010 at 2:03 pm
“What is the prime mover?”
Nothing more than the flap of a butterflies wings perhaps.
richard telford says:
November 2, 2010 at 2:03 pm
I’m afraid that until they stop concentrating on CO2, we’ll not know.
I very much doubt that the current crop of funded investigators are even capable of looking in the right area. 🙁
DaveE.
Hi Rog, nice to see you back at your old favourite haunt.
richard telford says:
November 2, 2010 at 2:03 pm
“It would indeed be interesting to take the output of a GCM run for, say, the A2 scenario and determine how much of the increase in temperature in the model could be accounted for by various mode of variation, such as El Nino, AMO, NAO, PDO and the rest of the alphabet soup. I have little doubt that even at the end of the 21st century, most of the temperature change could be ascribed to such modes, leaving little residual to be explained by CO2.
But what drives these modes of variation? What is the prime mover?“
The ‘alphabet soup’ of quasi-cyclic climate ‘drivers’ is the result of changes to the amount and type of energy from the sun which hits our outer atmosphere. It is not delivered in a continuous even stream, but in spiky bursts often over very short time periods. This results in the turbulence and the deterministic chaos we observe. When peaks or troughs in these overlapping quasi-cycles coincide, it can push weather regime/climate into a different strange attractor (from warm mode to cool mode and vice versa).
This is the elephant in the room that climate science doesn’t want to – or cannot – deal with.
I hope you are all remembering that the AMO is based on DE_TRENDED temperatures, ie North Atlantic temperatures with the warming trend removed. To therefore claim that it is responsible for the warming is a logical impossibility.
Juraj V. says:
November 2, 2010 at 2:29 pm
Your graph does not prove that Arctic temperature drives Atlantic SST.
I did not say that either, I said AMO follows the Arctic temperatures.
There are also the Arctic currents that cool the Atlantic (chicken and egg?). Pacific inflow is about 10% of the Atlantic’s i.e. minor effect.
There is a good reason to think North Atlantic is driven by NAP
http://www.vukcevic.talktalk.net/CET-NAP.htm
and presumably the AMO (which is a recent invention) and I am not particularly impressed by it.
As far as GMF is concerned see the note at the bottom of web page
http://www.vukcevic.talktalk.net/NFC1.htm
Relation between Arctic temperatures, GMF, NAP and SSN is an interesting one
http://www.vukcevic.talktalk.net/AGSN.htm
currently there is no viable and to the science acceptable rationalization for any combination among four of the above.
Leif Svalgaard says: November 2, 2010 at 2:16 pm
—————————–
Hi Doc, nice to see you back too.
I promise not to interfere with your Q & A sessions on SC24.
Prof. Dr. Judith Curry promised to look at this mystery:
http://www.vukcevic.talktalk.net/CET&10Be.htm
(J.C. ” I’m not all that familiar with this issue but it looks important ” )
direct copy of 10Be data from A 600-year annual 10Be record from the NGRIP ice core, Greenland by Berggren et al. from GEOPHYSICAL RESEARCH LETTERS, VOL. 36; published 2 June 2009.
Will keep you posted.
Jeff T says:
November 2, 2010 at 2:31 pm
The AMO was high in 1950. It’s high now. Is the global temperature the same now? No, it’s almost 1 degree C higher now.
Hhhmmmmmm. do we have any evidence that the global temperature is different?
With all the evidence that there is very grave doubt that there is such a thing as a global temperature and the sources of temperature data is “compromised” (To put it mildly!) I would have very grave doubts about your statement
@jimmi, even detrended, the sinusoidal wave remains as well as warming periods 1910-1940 and 1975-2005. If you have two days with equally cold nights and warm noons, there is warming in the morning, even the overall linear trend is flat.
AMO
http://climexp.knmi.nl/data/iamo_ersst_tsa.png
North Atlantic SST
http://climexp.knmi.nl/data/ihadsst2_280-360E_0-70N_na.png
Juraj V. says:
November 2, 2010 at 12:38 pm
“It is interesting, that AMO is some kind of residual of ENSO; at least Bob Tisdale says so. He simply cumulated annual ENSO index values and got almost exact copy of HadCRUT, it means AMO is somehow incorporated in the ENSO.”
As far as I am concerned, Juraj, AMO is just wishful thinking by a climatologist seeking order in chaos. And ENSO has nothing whatsoever to do with AMO. Bob Tisdale’s observation, however, hits the mark. HadCRUT3 does indeed show all the El Nino peaks back to 1880. They are present in all accurate temperature curves that have not been massaged or running-averaged. If Bob was using Nino 3.4 he probably would have picked up the El Nino history that HadCRUT3 embodies. That is because Nino 3.4 is ensconced at the center of the Pacific equatorial countercurrent, the gateway that carries El Nino waves across the ocean.
Leif Svalgaard says:
November 2, 2010 at 2:21 pm
So, in cyclomania-land
*Yawn*
You wouldn’t recognise two mutually amplifying resonances if they joined forces and kicked you up the jacksie simultaneously, so I won’t waste my time.
@JeffT: “The AMO was high in 1950. It’s high now. Is the global temperature the same now? No, it’s almost 1 degree C higher now. The AMO can’t be responsible for that 1 C.”
If we believe global HadCRUT, the difference between 1940s and now is 0.4 C, not 1C. This is including UHI and whatever. If we believe that THIS difference is the underlying warming trend, it is 0.6 C per century, mere 5 to 12 times less than IPCC “best estimate”. But the underlying warming trend can be hardly caused by CO2 which has risen exponentially after WWII, since the steepness of 1910-1940 and 1975-2005 warming is the same.
Problem with IPCC “best estimate” of course is, that it extrapolates the UHI-inflated 1975-2005 warming trend somewhere to 2100, which is like predicting Saturday temperature by extrapolating daily warming between 6AM-2PM.
North Atlantic itself has warmed by mere 0.3 deg C between its warm peaks 1940/2005. SST is something like UHI-free record. Anyway, the cooling period is due.
@Juraj V
Yes a sinusoidal curve remains, but the article claims it explains GLOBAL warming, and the AMO is a local oscillation (in space as well as time i.e when one part gets warmer, another gets cooler) It could, potentially, explain (or more exactly, reproduce, since without a driving mechanism it explains nothing) oscillations in temperature in one area, but cannot logically explain a global effect.
Joseph D’Aleo:
The portrayal of the AMO as purely natural well documented phenomena is not supported by the literature. The phenomena was not identified until 1994 and was not named until 2000. The “cycle” you noted of 60 to 70 years appears to be based on the recent 154 years of data and shows considerable variation in other data sets from 60 years to 110 years (some even suggest the possibility of even shorter swings).
Your presentation of the AMO as if it was a purely natural phenomenon (see previous post at: http://wattsupwiththat.com/2010/11/01/arctic-temperatures-and-ice-%E2%80%93-why-it-is-natural-variability/ ) whose reversal can be tightly predicted is not supported by the literature.
http://www.wcrp-climate.org/decadal/references/WCC3_Decadal_WhitePaper.pdf
Several sites have the following, (I was not able to track down its original source):
“There is no demonstrated predictability for when the AMO will switch, in any deterministic sense. Computer models, such as those that predict El Niño, are far from being able to do this. Enfield and colleagues have calculated the probability that a change in the AMO will occur within a given future time frame, assuming that historical variability persists.”
The lack of predictability was noted in an analysis of a prior presentation you did for this blog.
http://wmbriggs.com/blog/?p=2952
The IPCC at http://www.ipcc.ch/publications_and_data/ar4/wg1/en/ch3s3-6-6.html describe it as:
“Over the instrumental period (since the 1850s), North Atlantic SSTs show a 65 to 75 year variation (0.4°C range), with a warm phase during 1930 to 1960 and cool phases during 1905 to 1925 and 1970 to 1990 (Schlesinger and Ramankutty, 1994), and this feature has been termed the AMO (Kerr, 2000), as shown in Figure 3.33. Evidence (e.g., Enfield et al., 2001; Knight et al., 2005) of a warm phase in the AMO from 1870 to 1900 is revealed as an artefact of the de-trending used (Trenberth and Shea, 2006). The cycle appears to have returned to a warm phase beginning in the mid-1990s, and tropical Atlantic SSTs were at record high levels in 2005. Instrumental observations capture only two full cycles of the AMO, so the robustness of the signal has been addressed using proxies. Similar oscillations in a 60- to 110-year band are seen in North Atlantic palaeoclimatic reconstructions through the last four centuries (Delworth and Mann, 2000; Gray et al., 2004). Both observations and model simulations implicate changes in the strength of the THC as the primary source of the multi-decadal variability, and suggest a possible oscillatory component to its behaviour (Delworth and Mann, 2000; Latif, 2001; Sutton and Hodson, 2003; Knight et al., 2005). Trenberth and Shea (2006) proposed a revised AMO index, subtracting the global mean SST from the North Atlantic SST. The revised index is about 0.35°C lower than the original after 2000, highlighting the fact that most of the recent warming is global in scale.
The AMO has been linked to multi-year precipitation anomalies over North America, and appears to modulate ENSO teleconnections (Enfield et al., 2001; McCabe et al., 2004; Shabbar and Skinner, 2004). Multi-decadal variability in the North Atlantic also plays a role in Atlantic hurricane formation (Goldenberg et al., 2001; see also Section 3.8.3.2). The revised AMO index (Trenberth and Shea, 2006) indicates that North Atlantic SSTs have recently been about 0.3°C warmer than during 1970 to 1990, emphasizing the role of the AMO in suppressing tropical storm activity during that period. The AMO is likely to be a driver of multi-decadal variations in Sahel droughts, precipitation in the Caribbean, summer climate of both North America and Europe, sea ice concentration in the Greenland Sea and sea level pressure over the southern USA, the North Atlantic and southern Europe (e.g., Venegas and Mysak, 2000; Goldenberg et al., 2001; Sutton and Hodson, 2005; Trenberth and Shea, 2006). Walter and Graf (2002) identified a non-stationary relationship between the NAO and the AMO. During the negative phase of the AMO, the North Atlantic SST is strongly correlated with the NAO index. In contrast, the NAO index is only weakly correlated with the North Atlantic SST during the AMO positive phase. Chelliah and Bell (2004) defined a tropical multi-decadal pattern related to the AMO, the PDO and winter NAO with coherent variations in tropical convection and surface temperatures in the West African monsoon region, the central tropical Pacific, the Amazon Basin and the tropical Indian Ocean. ”
Your article failed to note that the AMO is so interconnected with human induced warming that the data supporting the “natural” element has to be altered to remove the influence of greenhouse global warming and there are concerns that this removal still contains an element of global warming.
“The AMO signal is usually defined from the patterns of SST variability in the North Atlantic once a linear trend has been removed. This detrending is intended to remove the influence of greenhouse gas-induced global warming from the analysis, leaving a purely natural variation. However, if the global warming signal is significantly non-linear in time (i.e. not just a smooth increase), variations in the forced signal will leak into the AMO definition (Mann and Emanuel, EOS, 2006). Consequently, correlations with the AMO index may alias affects of global warming.”
http://www.worldlingo.com/ma/enwiki/en/Atlantic_Multidecadal_Oscillation
Another source readily admits the uncertainty over the AMO:
“The Atlantic multidecadal oscillation (AMO) is a hypothesised mode of natural variability occurring in the North Atlantic Ocean and which has its principle expression in the sea surface temperature (SST) field. While there is some support for this mode in models and in historical observations, controversy exists with regard to its amplitude, and in particular, the attribution of sea surface temperatures in the tropical Atlantic in areas important for hurricane development. In addition, many scientists believe that global warming is changing this pattern.”
Romm, Joseph J., Hell and High Water: Global Warming — the Solution and the Politics, pp. 44, 47 (2006) William Morrow & Co. ISBN 0-06117-212-X citing MIT’s and Kerry Emanuel’s research as showing that the AMO has now been supplanted by global warming as the “dominant force” in the Atlantic climate.
There also appears to be confusion over what phase we are currently in as a previous post from 2009 on this blog indicated that we had entered a cold phase that would last for 20 years.
“The last interval change was 1994 or about 15 years ago and according to Enfeld et.al (2005), the probability that AMO will switch to cool in 15 years is about 80%. Based on this analysis , there is a high probability that the current cooling phase of AMO which started in 2009 is real and likely sustainable for the next 20 years at least.”
http://wattsupwiththat.com/2009/07/14/the-atlantic-multidecadal-oscillation-not-quite-cool-yet/
A 2010 study suggests a 50 to 90 year period.
Enfield, David B.; Cid-Serrano, Luis (2010), “Secular and multidecadal warmings in the North Atlantic and their relationships with major hurricane activity”, International Journal of Climatology 30 (2): 174–184, doi:10.1002/joc.1881
Abstract:
“Analysis of recent literature finds weaknesses in arguments to the effect that the Atlantic multidecadal oscillation (AMO)—roughly 50–90 year fluctuations in North Atlantic sea surface temperatures—is externally forced by anthropogenic aerosols and greenhouse gases rather than an internal climate mode, plus indications from other sources that the contrary may be true. We are led to the conclusion that the AMO is probably comprised of both natural and anthropogenic forcing in ways that preclude a physically based separation of the two, using the limited historical data sets. A straightforward quadratic fitting of trend to temperature data accounts for some of the 20th century nonlinearity in secular warming and separates the secular and multidecadal components of variability without inherent assumptions about the nature of the multidecadal fluctuations. Doing this shows that the 20th century secular ocean warming in the North Atlantic is about equal to the peak-to-peak amplitude of the multidecadal fluctuations. However, over the last quarter-century (1975–2000) the most recent multidecadal warming has been almost three times the secular sea surface temperature (SST) increase over the main development region (MDR) for major Atlantic hurricanes. In the last quarter-century the multidecadal increase in late summer Atlantic warm pool (AWP) size (area of SSTs in excess of 28 °C) has been 36%, and the secular increase, 14%. Projections to the year 2025 show that the cumulative change in summer warm pool size since 1975 will depend critically on whether a subsequent cooling in the multidecadal cycle occurs, comparable to the warming between 1975 and 2000 AD. This places a high premium on understanding to what extent the AMO is a man-made or a natural phenomenon.”
The authors of this study indicate that “the AMO is probably comprised of both natural and anthroprogenic forcing in ways that preclude a physically based separation of the two” yet the article you have posted above would lead the reader to believe that their is no connection between AMO and “anthroprogenic forcing”, only a connection between the AMO and global temperature.
While some of the information in your article is supported by the literature, the lack of forthrightness in regards to the basic nature of the AMO and the impact of anthropogenic warming on the AMO is a serious deficiency. It is not clear if the data you are presenting is the full AMO which includes the global warming signal, or if you applied detrending to eliminate the global warming signal in measuring the AMO. In any event, the presentation failed to inform the reader of the links between the AMO and anthropogenic forcing. .
Hi Arno, the multidecadal variation in the North Atlantic is real.
http://climexp.knmi.nl/data/ihadsst2_280-360E_0-70N_na.png
AMO is +- this curve laid down.
Whether AMO is an aftereffect caused by ENSO via induced atmospheric changes, or driven by some planetary tidal effects I do not know. But the simplest way to change SST is to change the cloud cover, since ocean gets warmed by absorption of SW radiation. Satellite cloud observations do show significant variation:
http://www.climate4you.com/images/CloudCoverTotalObservationsSince1983.gif
Juraj V. says:
November 2, 2010 at 2:29 pm
That magnetism relation is very striking, but I think those magnetism changes are just a side effect of the real driver…
That´s because there are “two imams guarding the qubt” at sin =45° and at Cos=135°