By Joseph D’Aleo, CCM
The North Atlantic undergoes a multidecadal oscillation appropriately called the Atlantic Multidecadal Oscillation or AMO. It is officially the mean sea surface temperature anomaly from the equator to 70 degrees North. It went above the longer term mean in 1995. The AMO has a long term cycle of about 60-70 years.
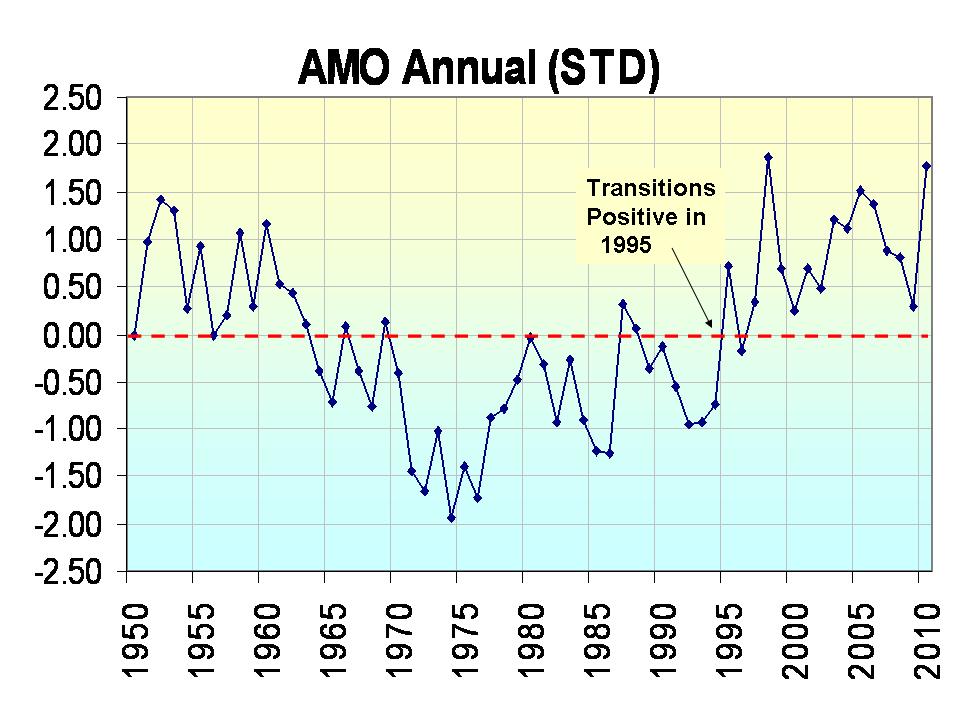
Enlarged here
When the AMO is positive (warm) the Northern Hemisphere is warmer than normal on an annual basis across the continents. When it is cold, it is colder. The positive state is associated with a warmer arctic and Greenland and more summer hurricanes in the Atlantic Basin.

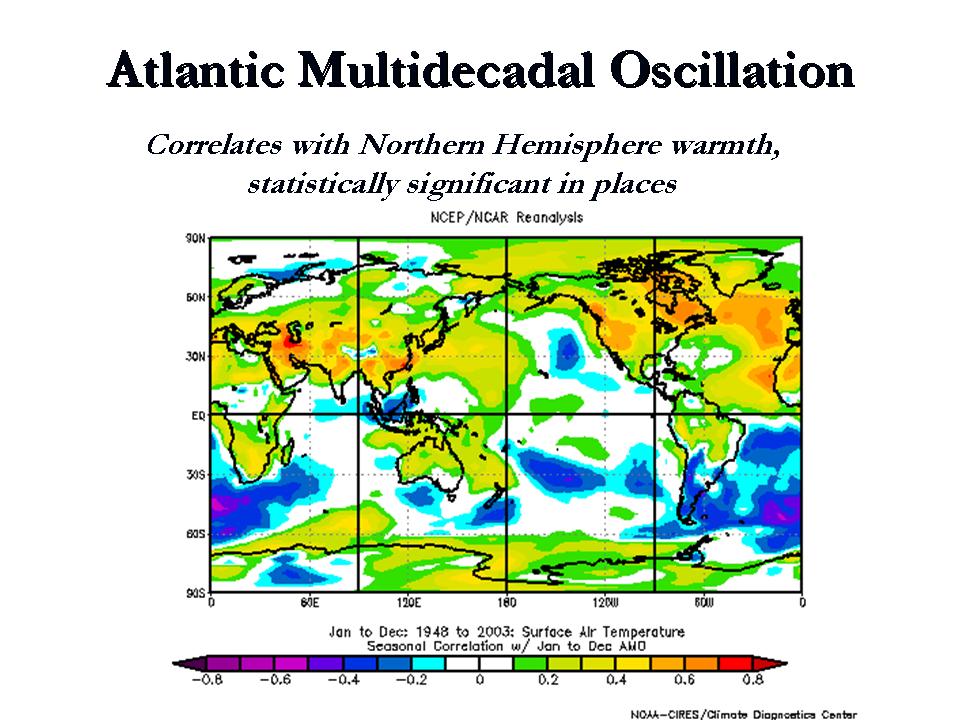
Correlation of annual temperatures with the AMO. Yellows to reds are positive and blues negative correlations with the AMO state. Enlarged here.
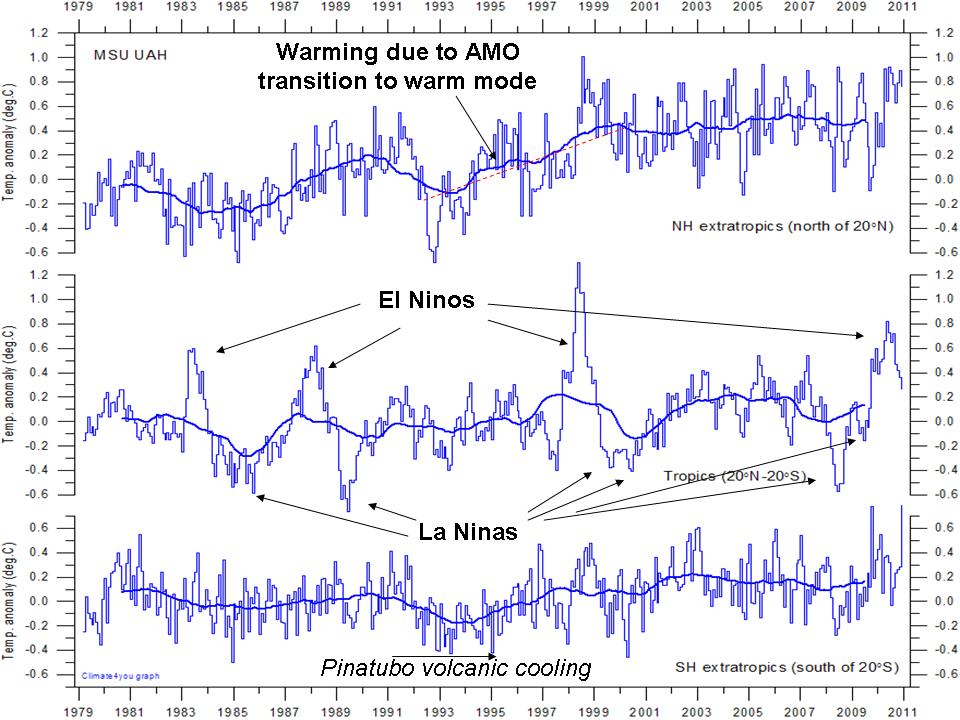
This can be also seen in the satellite derived temperatures for the Northern Hemisphere (north of 20N). There is little continuous trend since 1979. Most of the warming is in the 1995 transition from AMO negative to positive. Note the temperatures in the tropics reflect the ENSO state but has no perceived trend. There is also no trend in the Southern Hemisphere. The only significant departure was with the volcanic cooling also seen in the Northern Hemisphere after Pinatubo in 1991-1994.

UAH Satellite temperatures by latitude zone – Northern Hemisphere poleward of 20N, tropics, 20N to 20S, Southern Hemisphere poleward of 20S. Enlarged here.
The AMO tracks to the solar irradiance with a lag of about 8-9 years. This suggests the current warm AMO state will end by around 2015. Northern Hemispheric temperature will take a leg down. With the cooling of the Pacific now and more La Ninas, look for net cooling especially in the tropics until then.
See more here.
Discover more from Watts Up With That?
Subscribe to get the latest posts sent to your email.
When the AMO and PDO are both negative I expect the politicians will begin the question their “experts”. I eagerly await the “expert’s” responses.
Old news. 🙂
http://fnieuwenhuis.xanga.com/674919203/amo-pdo-and-the-gmst/
I have taken to the idea that man will be able to lift himself out of an ice age, should this come to pass…
It is interesting, that AMO is some kind of residual of ENSO; at least Bob Tisdale says so. He simply cumulated annual ENSO index values and got almost exact copy of HadCRUT, it means AMO is somehow incorporated in the ENSO.
I am glad that AMO is getting much interest today, nothing against Pacific/PDO but Arctic and Europe is obviously driven by Atlantic.
Looks like the Northern Atlantic peaked in 2005.
http://climexp.knmi.nl/data/inodc_heat700_280-360E_0-70N_na.png
Not convinced.
AMO follows the Arctic temperatures, as it can be seen clearly here:
http://www.vukcevic.talktalk.net/NFC1.htm
Joe D’Aleo wrote: “The AMO tracks to the solar irradiance with a lag of about 8-9 years. ”
I does? You’ve provided no documentation of this.
I think we have to remember that step-changing admission by Prof Bob Watson, the UK Government’s Chief Scientific Advisor, on UK Channel 4 News back on 2nd February 2010. I blogged about it at the time here: http://sunriseconsulting.blogspot.com/2010/02/illuminating-interview-on-uk-channel-4.html
In summary, he clearly stated that “The only way we can explain that temperature increase is due [sic] to human activity”.
I pointed out at the time that the whole basis for blaming humanity for GW is that scientists couldn’t find any other causes. If they did find other causes which filled the gap between explained and unexplained GW then AGW was dead. Which of course could explain why research looking for other explanations is so poorly funded….
So this article is yet another blow for the AGW premise because it continues to chip away at the gap. It’s great to read such a well-argued explanation of the effect of AMO on NH climate — which I think is where even pro-AGW alarmists have to admit the only warming is apparent — and even provides predictions based on the theory that are relatively short-term and can be verified.
I look forward to seeing the predictions compared against reality over the next few years.
Doesn’t surprise me. A few years ago, when I first started looking into
global warmingclimate changeglobal climate disruption, I did an analysis of the available temperature record for State College, PA (over 100 years of daily data). After deducting an annual variation (sine wave), a shorter-period variation (another sine wave) and a calculated UHI effect (using US census data for population), the best fit to the rest of the data was a square wave pretty much coinciding with the AMO. Subtracting that left essentially trendless noise.I should note that I didn’t know at the time where to find the specific sea surface temperature anomalies for the AMO; I was going off of a timetable which noted the transitions from positive to negative and vice-versa. It would be interesting to re-run the analysis with the actual anomalies instead of a simple square wave.
This is another step towards my old contention that what really matters for tropospheric air temperatures is the net global rate of energy release by all the ocean surfaces combined at any given time.
http://climaterealists.com/index.php?id=1302&linkbox=true&position=6
from May 2008
It’s possible that others said it first but as yet I haven’t found it.
There is this though:
http://esciencenews.com/articles/2009/08/14/changes.net.flow.ocean.heat.correlate.with.past.climate.anomalies
Joe D’Aleo wrote, “This can be also seen in the satellite derived temperatures for the Northern Hemisphere (north of 20N). There is little continuous trend since 1979. Most of the warming is in the 1995 transition from AMO negative to positive.”
After the dip due to the eruption of Mount Pinatubo, it looks like you are attempting to attribute the rebound in TLT to the AMO.
Actually, the flattening of the extratropical Northern Hemisphere TLT anomalies that is very obvious in your graph occurred after the 1997/98 El Nino. Discussed in this post:
http://bobtisdale.blogspot.com/2009/06/rss-msu-tlt-time-latitude-plots.html
There are two upward steps in the extratropical Northern Hemisphere TLT anomalies and they occurred in response to the 1986/87/88 and 1997/98 El Nino events. The step in 1998 is very easy to see in the Hovmoller provided by RSS that I used in that post.
Vuk etc. says:
November 2, 2010 at 12:44 pm
You are right…but nobody wants to hear or see or whatever. It doesn’t matter for believers that temperature follows the cycles of LOD, which is the same as saying it follows also magnetic fields, and all fields from reality. Science, since the fantasies of the 20th century, has chosen black holes, entangled strings, and other parallel universes, which were best described by Prof.K.Abdusamatov words: “Hollywood Science”, useful for making truculent movie stories . No one can change those “truths”, and not only believers believe in them but practical people who have realized that such a believing pays dividends in cash.
Pete Ward:
If they did find other causes which filled the gap between explained and unexplained GW then AGW was dead
Which is, of course, why they don’t look 🙂
The decline is coming back… the perfect storm!
@vuk, you got it backwards. Arctic temperatures follow the AMO, or more precisely, North Atlantic SST.
Bob, I think the AMO/solar link is discussed here:
http://wattsupwiththat.com/2010/08/18/solar-terrestrial-coincidence/
http://wattsupwiththat.com/2010/09/04/the-north-pacific-solar-cycle-change/
Once again: Temperatures extrapolated to the year 2100
ftp://ftp.fao.org/docrep/fao/005/y2787e/
Document Archive: y2787e08.pdf pp.50
by Professor Leonid B. Klyashtorin, of the Federal Institute for Fisheries and Oceanography, Moscow, Russian Federation (e-mail: Klyashtorin@mtu-net.ru)
which, what a coincidence, shows a low at the year 2020, the same as Vuk’s extrapolation of Sun’s polar fields:
http://www.vukcevic.talktalk.net/PF.gif
However, the “post normal scientists” will say “ex-cathedra”: “It’s just numerology”
Who will stop the lemmings from jumping into the abyss?…None, then, as the oriental sage said: “Just sit at your front door and you’ll see….” (Confucius)
Nothing to do but…Buy more popcorn!
[REPLY – When it rains lemmings, make lemmingade. ~ Evan]
Great stuff as always from Joe.
The really interesting question is why the 60-70 year envelope cycle? – and is this in fact the same as the PDO cycle of around 60 years? I suspect they are BOTH primarily a result of (with some different phase ETC factors) the Solar-Lunar-Amplification-Magnetic (SLAM) process we announced in New York March 2009, although there might not be enough data to confirm this. For more on this see – especially the VIDEO (world climate forecast issued June 2009) – linked in 4th comment on the ClimateRealist ongoing thread “World Cooling has….” http://bit.ly/bpZDlp
Thanks Piers
Enneagram says: November 2, 2010 at 1:11 pm
——————————–
All in good time.
Rome wasn’t built in a day but was burnt in a night or two.
Can you here a lyre floating over the Tiber, or a gentle strain from the Sack of Ilium refrain ?
Bob Tisdale says:
November 2, 2010 at 1:07 pm
Joe D’Aleo wrote: “The AMO tracks to the solar irradiance with a lag of about 8-9 years.”
It does? You’ve provided no documentation of this…
After the dip due to the eruption of Mount Pinatubo
It was? You’ve provided no documentation of this. 😉
As a matter of fact, there was a downturn in TSI around the time of Pinatubo. You’ll remember the discussion here maybe:
http://tallbloke.wordpress.com/2010/08/05/volcanos-dont-cause-global-cooling/
Incidentally Harald Ynestad found a correlation between lunat cycles and N.Atlantic temperature:
http://tallbloke.wordpress.com/2009/11/30/the-moon-is-linked-to-long-term-atlantic-changes/
Juraj V. says: November 2, 2010 at 1:19 pm
@vuk, you got it backwards. Arctic temperatures follow the AMO, or more precisely, North Atlantic SST.
Plot the data!
I did.
http://www.vukcevic.talktalk.net/AGA.gif
It would indeed be interesting to take the output of a GCM run for, say, the A2 scenario and determine how much of the increase in temperature in the model could be accounted for by various mode of variation, such as El Nino, AMO, NAO, PDO and the rest of the alphabet soup. I have little doubt that even at the end of the 21st century, most of the temperature change could be ascribed to such modes, leaving little residual to be explained by CO2.
But what drives these modes of variation? What is the prime mover?
tallbloke says:
November 2, 2010 at 1:57 pm
Definitely as farmers from thousand of years knew, the Moon modulates Sun’s influence on climate, its eccentricity goes from 0,03 to 0,08 . But…lemmings were said to jump…because their SUV’ S were changing climate and now it’s too late: all departed to the precipice… 🙂
Bob Tisdale says:
November 2, 2010 at 12:45 pm
Joe D’Aleo wrote: “The AMO tracks to the solar irradiance with a lag of about 8-9 years.”
I does? You’ve provided no documentation of this.
Indeed he has not.