Steven Goddard writes below that he agrees with the prediction I made in late 2009 that we’d see another 500,000 km2 of Arctic sea ice recovery in 2010. The Arctic Oscillation seems to be negative again, and according to NSIDC, this figures greatly in making thicker ice thus lowering summer losses. – Anthony

Source: Climate Prediction Center
NSIDC regularly puts out a news article describing the deteriorating state of the Arctic, called the Sea Ice News. In their May 5, 2008 article, they stated:
…the Arctic Oscillation was in its positive phase through the winter season, associated with a wind pattern helping to flush thick ice out of the Arctic, leaving thinner ice. This is one of the factors helping to set the stage for pronounced ice losses this summer.
Additionally, Dr. Walt Meier from NSIDC told WUWT:
The NAO/AO (Arctic Oscillation) is a particularly prominent one and a substantial amount of the decline in the sea ice during the late 1980s and early 1990s could be attributed to a strong positive mode during winters because the positive mode favors the loss of thicker ice (through drift) that is less likely to melt during summer.
In their January 5, 2010 article NSIDC states that we are in an “Extreme negative phase of the Arctic Oscillation” which can be seen in this NOAA graph below. Oddly (but not surprisingly) the article failed to mention how this affects drift.

If a positive Arctic Oscillation flushes out the Arctic into the Atlantic, the implication is that a negative phase would tend to retain ice. This indeed appears to be the case. Arctic buoys show very light polar drift this winter.

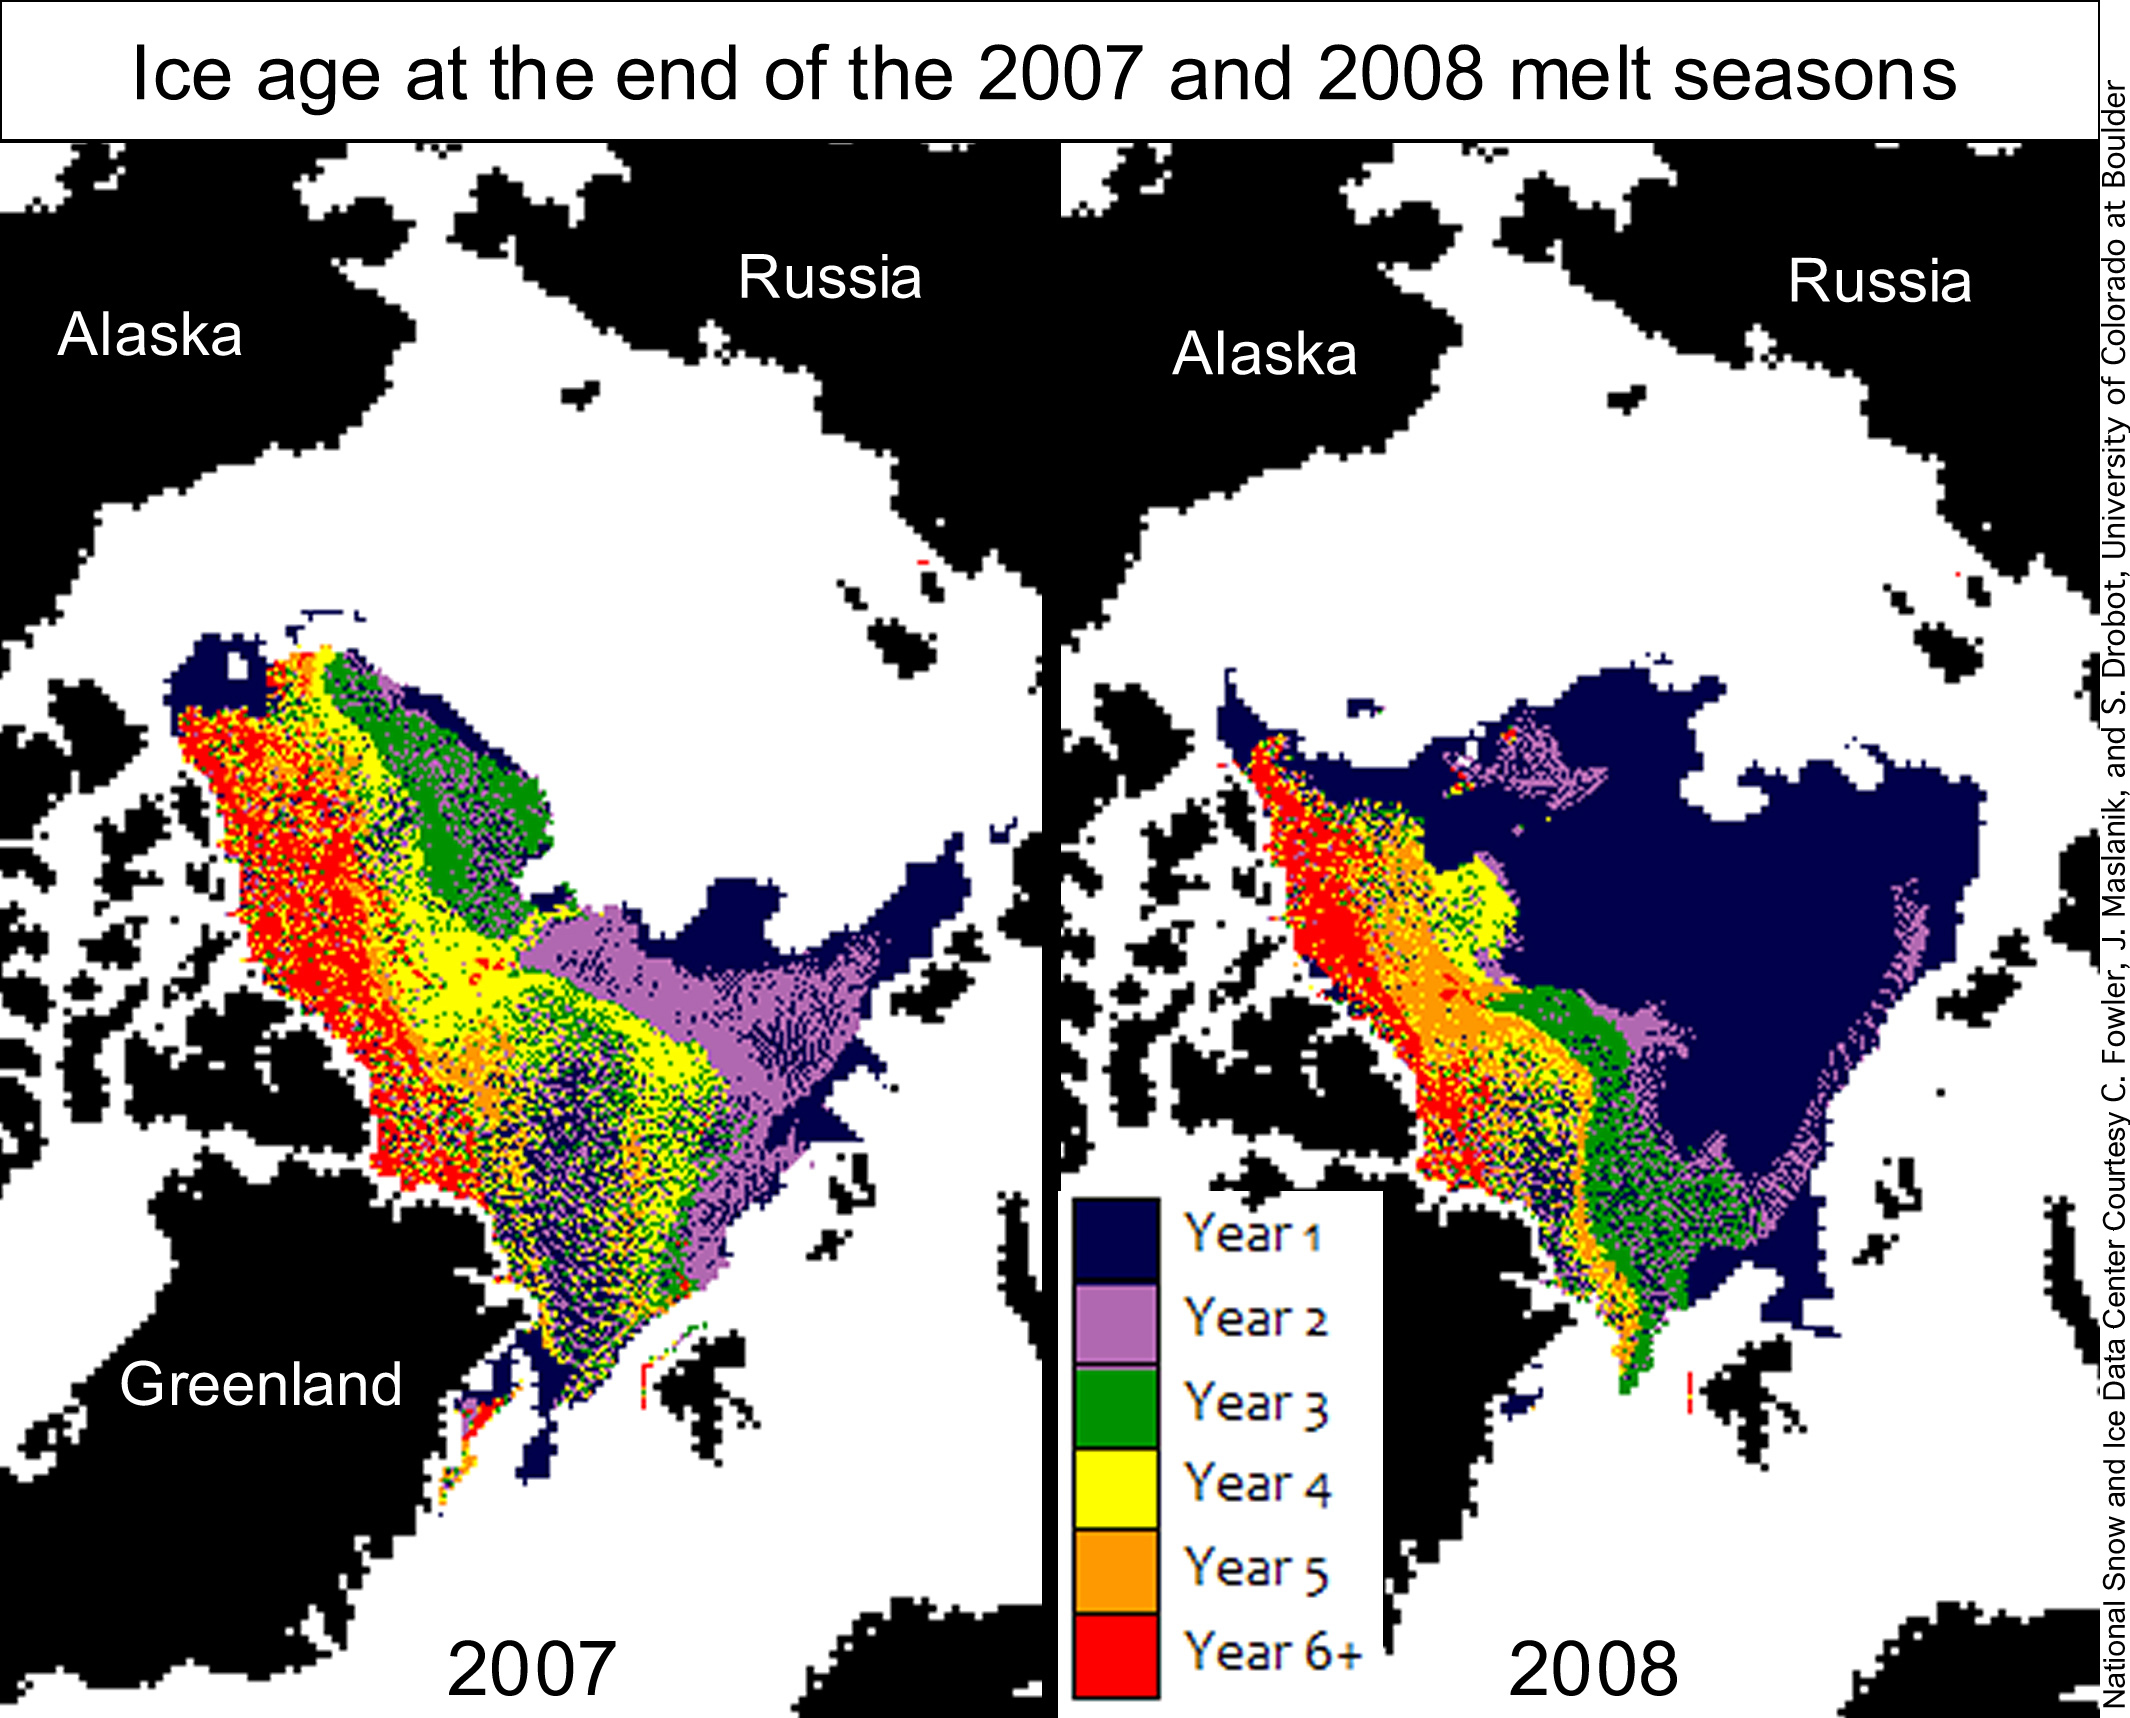
NSIDC made a big deal about loss of multi-year ice in the Arctic during 2007-2008, but this was due more to drift in the winter than melting in the summer, as can be seen in the NSIDC map pair below. Note that most of the 2007 multiyear ice was replaced by first year ice after the 2007 melt season ended and (necessarily) before the 2008 melt season started. The only way this could have happened was due to drift during the 2007-2008 winter, i.e. it could not be the result of summer melt -because ice only forms in the winter.

If the ice is not drifting (i.e. not under tensile stress) the concentration should be high. This indeed appears to be the case. According to UIUC maps, sea ice concentration is high (above 90%) across the Arctic Basin.
http://arctic.atmos.uiuc.edu/cryosphere/NEWIMAGES/arctic.seaice.color.000.png
The Arctic ice minimum extent increased by about 25% between 2007 and 2009, and many indications (negative AO, light drift, high concentration) point to the idea that it will continue to increase in 2010.

http://www.ijis.iarc.uaf.edu/seaice/extent/AMSRE_Sea_Ice_Extent.png
We can also expect that the average age of the ice has increased this winter, continuing a trend started in 2009.

Here’s your chance to weigh in:
Prediction: Arctic Ice Will Continue to Recover this Summer
NSIDC regularly puts out a news article describing the deteriorating state of the Arctic, called the Sea Ice News. In their May 5, 2008 article, they stated:
the Arctic Oscillation was in its positive phase through the winter season, associated with a wind pattern helping to flush thick ice out of the Arctic, leaving thinner ice. This is one of the factors helping to set the stage for pronounced ice losses this summer.
Additionally, Dr. Walt Meier from NSIDC told WUWT:
The NAO/AO (Arctic Oscillation) is a particularly prominent one and a substantial amount of the decline in the sea ice during the late 1980s and early 1990s could be attributed to a strong positive mode during winters because the positive mode favors the loss of thicker ice (through drift) that is less likely to melt during summer.
In their January 5, 2010 article NSIDC states that we are in an “Extreme negative phase of the Arctic Oscillation” which can be seen in this NOAA graph below. Oddly (but not surprisingly) the article failed to mention how this affects drift.

If a positive Arctic Oscillation flushes out the Arctic into the Atlantic, the implication is that a negative phase would tend to retain ice. This indeed appears to be the case. Arctic buoys show very light polar drift this winter.

NSIDC made a big deal about loss of multi-year ice in the Arctic during 2007-2008, but this was due more to drift in the winter than melting in the summer, as can be seen in the NSIDC map pair below. Note that most of the 2007 multiyear ice was replaced by first year ice after the 2007 melt season ended and (necessarily) before the 2008 melt season started. The only way this could have happened was due to drift during the 2007-2008 winter, i.e. it could not be the result of summer melt -because ice only forms in the winter.
If the ice is not drifting (i.e. not under tensile stress) the concentration should be high. This indeed appears to be the case. According to UIUC maps, sea ice concentration is high (above 90%) across the Arctic Basin.

http://arctic.atmos.uiuc.edu/cryosphere/NEWIMAGES/arctic.seaice.color.000.png
The Arctic ice minimum extent increased by about 25% between 2007 and 2009, and many indications (negative AO, light drift, high concentration) point to the idea that it will continue to increase in 2010.

http://www.ijis.iarc.uaf.edu/seaice/extent/AMSRE_Sea_Ice_Extent.png
We can also expect that the average age of the ice has increased this winter, continuing a trend started in 2009.
Poll:
What will the 2010 Summer Arctic Sea Ice Extent Be?
It will be greater than 2009
It will be greater than 2008 but not 2009
It will be less than 2007
It will be near normal
The North pole will be “ice Free” in 2010
Well I look at the JAXA ice graph more or less daily; mostly out of fascination; and no way do I want to get in the game of prediction of future data. I’m just looking at what has apparently happened since 1979. So I’ve read most of the explanations for the 2007 summer minimum (actually fall), and all that is interesting. I’m happy that people keep track of that. I also look at the DMI Arctic temperature which is even more fascinating; specially those wild five degree up and five degree down daily swings. Dare I suggest that those graphs scream of Nyquist sampling violation ? The whole of the Arctic can jump five degrees C in a day. Well I guess it is only north of +80 Latitude, so not really the whole of the Arctic.
Almost seems like just weather moving in, rather than climate change.
Phil talks about the ice thickening slowing due to the insulating effect of the thick ice abobe the ice/water interface; which almost by definition is underwater; and that doesn’t seem to be a debatable issue. Along the same line though, the growth of ice at that underwater interface; which by definition should be at the freezing point of sea water; also results in the expulsion via the segregation coefficients, of both salts, and CO2 from the growing solid. So I believe the boundary layer must be somewhat more saline than the bulk of the sea, and that is going to depress the freezing point of the boundary layer even further, so that too, must be a factor in the slowing of thickness growth, once a surface ice layer is formed.
I would think that the open surface water, should be somewhere near Henry’s law equilibrium as far as dissolved CO2 goes, so the expulsion of CO2 from the growing ice, could result in venting to the atmosphere, of excess CO2. Well we know from NOAA three D graphs, that the atmospheric CO2 over the North Pole cycles with about 18 ppm p-p amplitude. That 18 ppm decline seems to happen in about 5 months, while the recovery; presumably during the melt season takes seven months.
That doesn’t look like any 200 year residence time to me. If I took “residence time” to mean about five time constants, that would make for a 40 year time constant, and there’s no way, that a reduction of 18 ppm in 5 months, can go on for 40 years.
Remember in ordinary exponetial decay, that governs many kinds of physical processes, the INITIAL rate of change following a step change in the driving force, is such as to complete the complete transition to the new state in one time constant. So if that 18 ppm in 5 months was a linear decline, it would go 100 ppm (the present excess roughly) in 5.5 times five months or two and a bit years. But that 5 months fall is a bit curved rather than straight so the initial rate is even faster. So I would say the time constant is more like two years, than 40 years.
However a friend at Scripps in La Jolla, who is a CO2 expert, says that that NOAA graph is simulated, and not really measured data; so it is more of an “artists impression” than real scientific data. Maybe the Mauna Loa Data is real, but that global pole to pole 3-D graphs is not. Maybe that is why NOAA pulled it, and hid it away. But I have about a dozen hard color copies of it, so it isn’t going to stay lost.
John Silver:
“I guess ‘normal’ here means the average of the years 2002- 2009?”
————
Why would anyone only incorporate the last 7 years, when scientists at the NSIDC have been using satellite imaging since 1979 to monitor the Arctic sea ice extent?
——-
Looking over the entire season, this winter continues the recent trend of slower Arctic ice growth. During the 1980s, the average rate of ice growth for January was approximately 90,000 square kilometers (35,000 square miles) per day. In comparison, during the 1990s, the average rate of January growth fell to about 40,000 square kilometers (15,000 square miles) per day. Including 2010, the average for the 2000s is 39,000 square kilometers (15,000 square miles) per day. http://www.nsidc.org/arcticseaicenews
——–
During January 2010, ice extent grew at an average of 34,000 square kilometers per day, continuing the 3.2% decline per decade.
re: your poll of vistors (“What will the 2010 Summer Arctic Sea Ice Extent Be?”)
One of the options is “It will be normal.” Like Daryl M and John Silver, I’d like to know the definition of normal. I imagine most WUWT readers (and those expected to pay for “carbon reduction strategies, too) would like to know as well.
I contend that we don’t know what the “normal” extent of Arctic sea ice is, nor do we know it’s full range for a reasonable period of time (beyond 30 years)…
What we DO have is a very short period of “comprehensive” historical records, with NASA’s (the AMSR-E data) being the shortest, but most accurate (reportedly), and the military’s (NSIDC) being longer but less accurate. (This short history of direct measurements is also the case with instrument records for temperature and atmospheric CO2.)
The satellite records only go back 30 YEARS [as pointed out by Alexej Buergin as well]. That’s far too short to really make any realistic assessment as we have nothing of similar accuracy or precision against which to compare for other periods, such as the 30’s and 40’s, but also versus the LIA, MWP & RWP. As I’ve tried to research the ice extent issue for some time, it’s clear that even choosing which statistical analyses to run is problematic. Do we, for example, assume that either the NSIDC or AMSR-E records reflect the REAL range, average and standard deviations for the entire range of conditions that have ever existed,or are they merely a subset of a larger collection for which we simply do not have records? If it’s the latter (which is I believe is more likely the case), how variable is the extent of ice in the Arctic? That’s the $10 billion question.
Statistical measures are based on assumptions of what the underlying date MIGHT look like, assumptions that could well be quite wrong. And we do know what may happen when we “assume” things. Plus, what period to pick — IFF we could just step into the time machine and create a dataset in the past– is problematic too. Hypothetically (this is a rhetorical question), would we expect that there was a small amount of Arctic Ice 70,000 years ago when the Wisconsonian Glacier was modifying the path of Ohio River at Cincinnati? Does using data such as that starts at the Little Ice Age make sense (since it’s been “warming” since)? Or would we want data that go back only somewhat farther, such as back to the MWP or the Roman Warm Period?
Unfortunately, we simply do not have comprehensive accurate and precise measurements (not proxy data) for Arctic Ice Extent for more than 30 years. We cannot therefore compare and contrast different periods of ice extent against each other or against other data (atmospheric temps and CO2, for example) as a means to see if there might be correlations.
———–
There’s also one other little, itty, bitty problem: “long-term” decreases in Arctic sea ice extent over time merely indicates “warming” but not the CAUSE of the warming, just as increases in ice extent might indicate “cooling.” Causation remains the object of hypothesis, conjecture, theory and great debate. Ice extent records, short as they are, tell us nothing about the cause, be it natural, anthropogenic, or some mix of the two.
Eugene Langschwager, Executive Director
Climate Science Coalition of America
http://www.climatescienceamerica.org
AndyW:
“Antarctic sea ice is increasing. The trend is very slightly up, but still not by very much at all. the last two years have been on the average for instance.”
————–
Again, why would anyone want to take a year or two out of context of the past 30+ years of satellite imaging to get an increase in Arctic sea ice extent?
The overall trend is a steady decline, whether it’s 30+ years of winter maximum or summer minimum, so comparing 2009/2010 to one or two years previous, is hardly scientific — just skewed results.
While I certainly don’t think we’ll see anything close to a record minimum in 2010, I’ll have to disagree on the prediction of Arctic sea ice recovery this year, even with more second-year, thicker ice.
To use a tired cliche here, is there not a 600 pound gorilla in the room: ocean and ocean currents, and their decadal variations? Not SST – which comes from the upper 1mm of the water column – the rest of the water column from 2mm depth to the bottom, where practically all the climate energy resides. All this discussion about Arctic ice seems to assume only air temps and solar variations were significant. Ocean currents at all depths (deep circulation can be very different from upper circulation) will transfer much more energy around the Arctic than air or even sun in terms of rate at a given time.
Barents Sea variation of up to 4C (upper few 100 m) in correlation with the AMO indicates the oscillation is linked variation in the North Atlantic Drift. Other currents no doubt vary cyclically around the Arctic.
Solar input will of course affect ocean heat over long timescales. The atmosphere may be a passive player between ocean and sun.
doc lakota,
It would appear that the minimum of 2007 was the result of a mostly positive Arctic Oscillation since 1989. It’s not much of a stretch to suggest that this was caused by a multidecadal process which now seems to have swung the other way. I understand why you say the long term trend is down, but if someone identifies why it was down and then changed to up in the last couple of years and that it will continue an upward trend for the same reason then that’s fine too.
Personally I think that very thick ice was formed this year and that Mr. Goddard’s prediction will be fulfilled.
Crosspatch said
“While it is true that the weather was sunnier than normal, the ice did not melt in place. The transportation of ice past Greenland into the Atlantic was quite dramatic. Sunshine notwithstanding, wind was the primary cause. Also note that while is was sunnier, it was also a colder than normal summer.”
From NSIDC
“Another factor that conspired to accelerate the ice loss this summer was an unusual atmospheric pattern, with persistent high atmospheric pressures over the central Arctic Ocean and lower pressures over Siberia. The scientists noted that skies were fairly clear under the high-pressure cell, promoting strong melt. At the same time, the pattern of winds pumped warm air into the region. While the warm winds fostered further melt, they also helped push ice away from the Siberian shore.”
http://nsidc.org/news/press/2007_seaiceminimum/20071001_pressrelease.html
So the actual main melt reasons was not ice being pushed past Greenland and out, it was due to clear skies, warm winds ( melting in situe) and those same winds pushing ice away from Siberia to the north so reducing the extent.
Andy
Do we know what the AO was like in 2006? Because 2006 is an interesting comparison if you look at JAXA. It’s the lowest March maximum in the 2002-2009 record, but well above 2007-2009 September minimums.
geo (22:32:20) :
Do we know what the AO was like in 2006? Because 2006 is an interesting comparison if you look at JAXA. It’s the lowest March maximum in the 2002-2009 record, but well above 2007-2009 September minimums.
As pointed out above the March maximum doesn’t tell us much, 2006 and 2007 were very close in March: 13.78 vs 13.94 but quite different in the summer.
Here’s an addition to the Ice Age figure to include 2009, note that all the ice flowing out of the Fram is multi-year ice which will necessarily be replaced with first year ice.
http://nsidc.org/images/arcticseaicenews/20091005_Figure5.png
Phil,
The ice flowing out into the Fram Strait is almost always multi-year ice. That is why Arctic ice never gets to be much more than about five years old.
Steve Goddard (08:16:39) :
Phil,
The ice flowing out into the Fram Strait is almost always multi-year ice. That is why Arctic ice never gets to be much more than about five years old.
Exactly, and there’s less and less of that every year so the amount lost through the Fram in winter is a larger fraction of what’s left, which is being replaced by first year ice.
Phil,
3+ year old ice is most likely going to be more extensive in 2010 than it was in 2009.
Steve Goddard (09:55:27) :
Phil,
3+ year old ice is most likely going to be more extensive in 2010 than it was in 2009.
Not a chance Steve.
I haven’t spent any time looking at the arctic detail geography, or where and when the multiyear ice forms or gathers; and frankly I don’t intend to much, because there is only so many hours in a day; so I’ll leave that to those who are up on it.
But it does seem to me, that the basic question of whether the arctic sea ice acts as a significant contributor to the albedo, or whether the open water acts as a significant near black body radiation sink, is largely a question of ice acreage, and so far, even in 2007, despite the large ice loss, the fall/winter period, did grow lots of first year ice; which basically switches the BB sink to an albedo reflector.
Then if the area of open sea does increase, and its temperature, that would seem to encourage, more evaporation, which presumably becomes precipitation somewhere; possibly depositing lots of snow, either on existing sea ice, or the surrounding land; of which there is an abundance in the arctic. So what really happens to the total planetary albedo, with that ice loss, and what of the increased CO2 uptake, in the larger open water areas (cold water too).
Well I’m not into either prediction or projection; especially about the future; but I will watch with interest.
I’m presently reading Clive Cussler’s Arctic Drift “whodunit”, which he wrote along with his son Dirk.
I haven’t determined if Cussler is a AGW believer or not. He did make some mistakes in the book.
He has a German WW-II in his hangar garage, along with his Ford Trimotor,a nd a lot of antique or classic cars; but it isn’t an ME-162 as he says in the book; more likely to be an ME-262.
Then he has Dirk Pitt’s son and daughter measuring CO2 laden water sampled from the inside passage off Vancouver (where it is now snowing); and declaring it to be as acidic as “battery acid”.
I’m not a chemist; but I somehow don’t think you can get enough CO2 fizz into water, to give it the same pH as H2SO4 in a car battery.
Maybe some of the Chemexperts, can clue me in on the truth about carbonic acid.
And Cussler seems to think that you can get hydrogen out of water, and carbon out of CO2 without expending more energy than you get if you burn either of those as a fuel. Now even catalysed and sunlight aided; those decomposition processes (if real) still don’t overcome the basic problem of free clean green renewable solar energy (sunlight); It is too damn diffuse to collect any sizeable amount of it economically; well without totally destroying the pristine environment of course.
It will be interesting to find out if Cussler can get us out of this fix. In the course of his book, he did manage to nearly wipe out those crazies who went ice fishing back in 2008 or whenever that was to measure the ice thickness; was that the Donner party ? In the book, the twin Otter never picked them up, but a renegade warship ran right through their science lab out there on the first yeqar ice. Unfortunately or maybe not, three of them were picked up by the books heroes.
I’m going to say slightly less than 2009 but more than 2008. I’m basing this off of two reasons.
The first is persistence. The long term trend puts us slightly below 2009. Also, ice has never recovered a million sq km and remained at such high levels. All previous 1 and 2-yr increases in ice extent were followed by a decrease. Through the 30 yr NSIDC record it has never increased for 3 straight years.
The second is the El Nino state and high global temperatures. The past 5 years ice has tracked the ENSO index perfectly. Nino summers had less extent than the previous year, Nina summer has more. Summer 05 was a fading Nino, ice extent decreased. Summer 06 was a fading Nina, ice extent was higher than previous years. Summer 07 was a fading Nino, ice extent decreased (dramatically). Summer 08 was a Nina, ice extent increased. Summer 09 was a fading Nina, ice extent increased. If you go back far enough in time this correlation breaks (03 was a mod-strong Nino and had very high extent). But it seems to have worked for the last 5 years particularly well, and there may be a significant correlation on longer timescales but I haven’t seen such a study. The relationship between high global temperatures and ice melt is obvious.
Phil,
There is no question that there will be more three year old ice than last year.
In 2007, essentially all of the first year ice melted. That led to there being almost no three year old ice in 2009. In 2010, the 2008 first year ice has it’s third birthday. So yes, we will see an increase in three year old ice in 2010.
@Phil. (05:50:21) :
AO status + March maximum should tell us something tho, right? That’s why I want to know if the AO was positive or negative in the winter of 2005-2006.
If I have grokked the conversation thus far, for a given March maximum amount if you know that’s been compacted by a negative AO, or spread by a positive AO, then you can say something useful about its comparison to other March maximum amounts as to their impact on the September minimums. . . if you know those other March’s AO status as well.
Said another way, presumably a larger March maximum is still good if it goes along with a strongly negative AO –that’s “best of both worlds”. And a small March maximum with a strongly positive AO would be “worst of both worlds”.
FergalR:
“Personally I think that very thick ice was formed this year and that Mr. Goddard’s prediction will be fulfilled.”
———–
You could very well be correct here, especially since the negative AO favors more multi-year ice, depite the warmer winter. Also, even though the Arctic sea ice extent was lower at the end of January than it was in Jan. 2007, there’s still one and half months of growing this winter.
What also has me concerned is the relative thickness of the ice, which is also in decline, no matter whether it is first-year or multi-year ice according to NOAA. I hadn’t seen the longer historical record of ice thickness from declassified sonar measurements from US Navy submarines, which indicates a decline in thickness. The overall mean winter thickness of 3.6 m in 1980 can be compared to a 1.9 m mean during the last winter of the ICESat record—a decrease of 1.7 m in thickness.
While the multiyear ice extent was similar in March 2008 and 2009, its distribution was quite different. More specifically, in 2008 there was a significant amount of multiyear ice the Beaufort Sea and in 2009 there was a large amount of multiyear ice the central Arctic Ocean.
http://www.arctic.noaa.gov/reportcard/seaice.html
Steve Goddard (12:45:31) :
Phil,
There is no question that there will be more three year old ice than last year.
In 2007, essentially all of the first year ice melted. That led to there being almost no three year old ice in 2009. In 2010, the 2008 first year ice has it’s third birthday. So yes, we will see an increase in three year old ice in 2010.
Maybe so but that wasn’t the original statement.
I’m not sure where people are getting the idea that the Arctic has been warm this winter. NSIDC says in their February news report that there were “cool temperatures over most of the Arctic Ocean in January”
February 3, 2010
Despite cool temperatures over most of the Arctic Ocean in January, Arctic sea ice extent continued to track below normal.
http://nsidc.org/arcticseaicenews/index.html
In mid January, the Arctic had the coldest average temperature it has seen since 2004.
http://ocean.dmi.dk/arctic/meant80n.uk.php
Phil,
3+ year old ice should nearly double this year.
http://nsidc.org/images/arcticseaicenews/20090406_Figure5_thumb.png
Look at the right edge of the lower graph to see why.
Steve Goddard (18:40:35) :
I’m not sure where people are getting the idea that the Arctic has been warm this winter. NSIDC says in their February news report that there were “cool temperatures over most of the Arctic Ocean in January”
Maybe because this site links to a site that shows that the last ~100 days of 2009 was ~5ºC over average? Not to mention the MSU data.
Phil,
MSU doesn’t cover much of the Arctic Basin, and the DMI graph looks neutral for January.
Are you always this contrary?
Is there a URL or two where a readable table of the numeric values of daily ice extents (or areas) is updated daily? There must be somewhere, because the charts are updated daily, but I haven’t been able to find a readable source for the data the charts are based on. TIA.
Roger,
So far as I know only the IJIS/JAXA data is published daily.
There is a provisional figure in plain view on the web page, plus the whole data in CSV format directly available. This is for Arctic extent only.
Work I have done shows that ice area and extent deviation figures are the same. Antarctic sea ice, a ring around a large landmass, is of low interest, doesn’t change much.
If you look further up this web page I posted reference to a dataset I have made available. This is so far as I know the only complete 1978 through to current daily dataset. This was done by joining a stale dataset (ceases Dec 2007) with IJIS/JAXA data and can be validly updated every day by you if that is what you want. Validity/accuracy: best I could do at the time but it hasn’t been reviewed by others.
Producing plots seems somewhat pointless. It takes time in return for nothing. A better move is try and make things easily accessible, enable other people. Not many will actually do anything.
A long discussion here is inappropriate. If you want to talk privately about this email me tc gpsl.net if you can get past the spam shark, if not, try again.