Guest post by Joseph D’Aleo AMS fellow, CCM
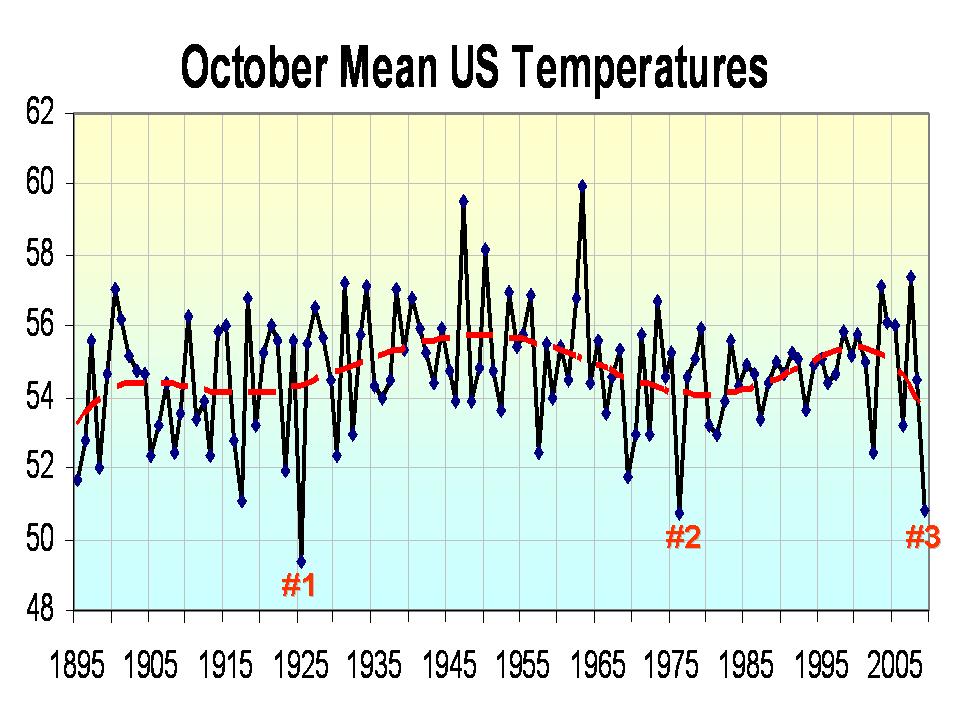
NCDC has compiled the October temperatures and it ended up the 3rd coldest in 115 years. As we have shown it was cold over almost all the lower 48. Indeed only Florida came in above normal. There is no [NOAA/NCDC] press release out yet but it should be interesting.

Enlarged here
October with a mean of 50.8F was behind only 1976 with 50.7F and 1925 with 49.4F.

Enlarged here
Also the University of Alabama global temperature is out and it is down this month. Hadley came in late for September but it was down. The trends since 2002 continue down for both even as CO2 rise.

Temperatures may pop globally with the second surge in El Nino the next two months. A warm pool (depression of the thermocline) induced by a westerly wind burst last month with a negative Southern Oscillation Index has been pressing east. A prior surge had produced a first peak in El Nino in July. It weakened after with a cooling of the water in the eastern Pacific as the first warm surge was mixed out and cold water upwelling increased off South America. The same thing will happen after the El Nino comes to a second larger peak in early December. Typically in cold PDO phases, El Ninos, are truncated – that is they end early and tend to be weaker (up to moderate strength). See the similarity to other years in this post here.
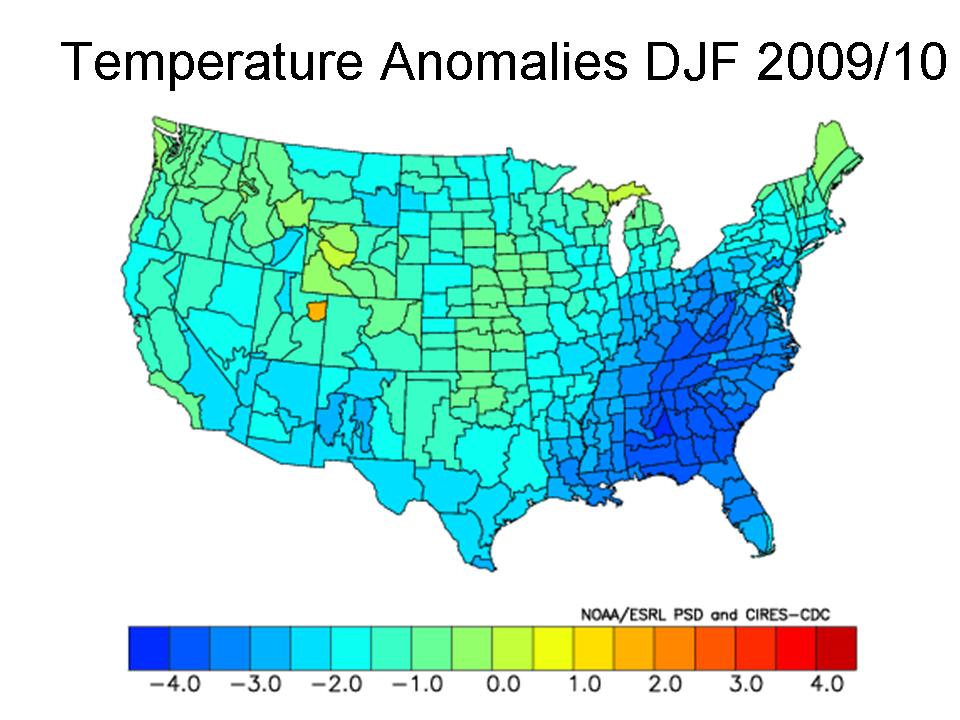
When you look at other years in cold PDO with a quiet sun and transition to an easterly QBO (Quasi-Biennial Oscillation) you get a cold winter especially in the east.

Enlarged here
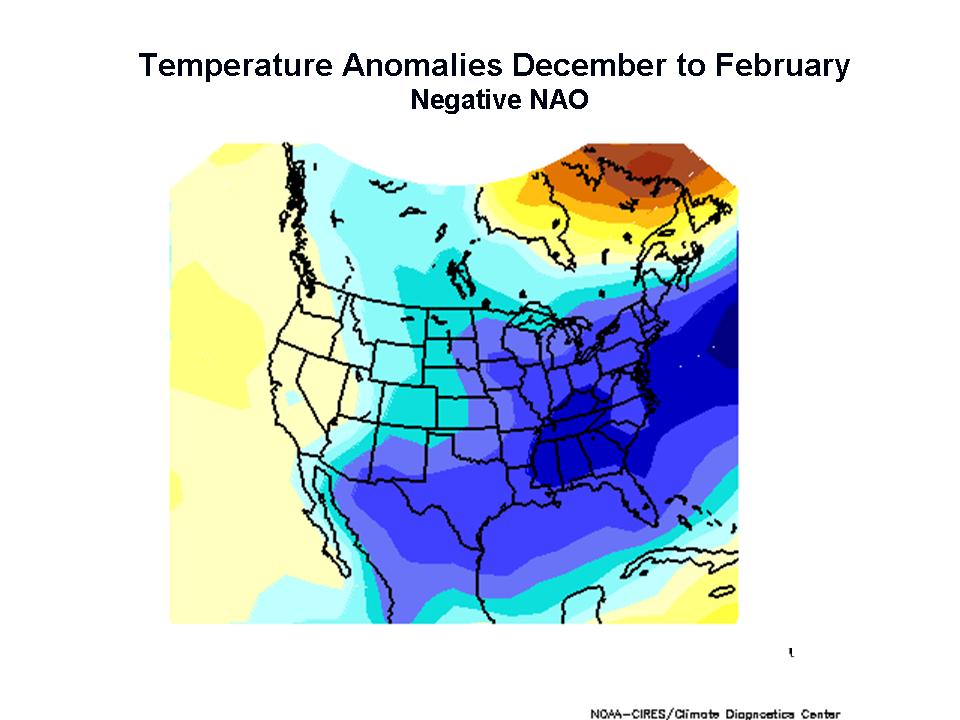
A stratospheric warming is more likely in these conditions, favoring high latitude blocking and cold air intrusions. We have seen much more blocking this year in part due to El Nino, in part to low solar and in part to high latitude volcanoes (Redoubt and Sarychev). See how a negative North Atlantic Oscillation (NAO) and Arctic Oscillation (AO) correlate with winter temperatures.

Enlarged here
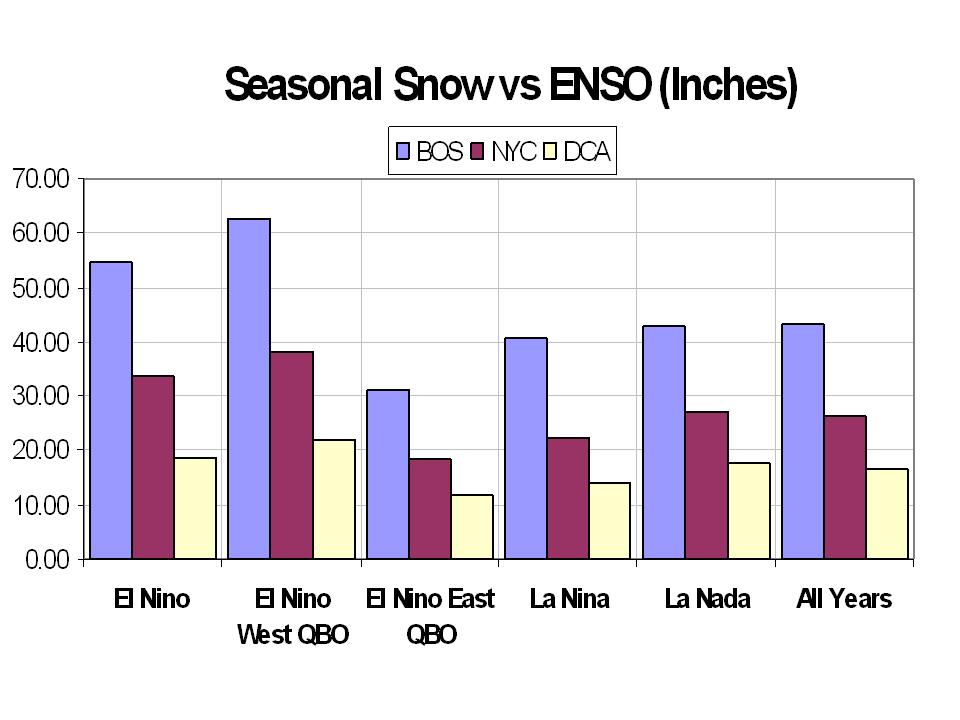
Big east coast storms for DC, New York or Boston are very likely in westerly QBO winters but not easterly. Since we will be transitioning from west to east, one might think we may still manage a few decent coastal storms and maybe a blockbuster, if the cold comes early and the QBO is slow to flip. Often in easterly winters, the snow is actually heavier south (like Norfolk).

Enlarged here
A negative NAO though is favorable for east coast storms and snow. This graph is for Boston, New York and DC are similar.

Enlarged here
Printable PDF version of this article here.
Based on what Bob Tisdale has reported for the Nino3.4 Region, I am hoping for a warm/mild Autumn-Winter for 2009-2010. I drive 50 miles to work, and much of that is in the Lake Effect Snow Belt of North-Central Indiana. I could really dig a 40 deg Christmas with only occiasonal snow-rain, and lows in the upper 20s to lows 30s. Otherwise, I fear a repeat of the El Nino 1976-1977 winters which brought temps below 0 F, and huge amounts of snow.
http://www.bellaonline.com/articles/art38570.asp
Snow Ice Cream Recipes Remember those days of snow angels, snow men and snow ice cream? Mom or dad would get a bowl of fresh fallen snow and make that delicious seasonal treat we loved! As many of you are in areas getting snowfall I thought I’d share a few snow ice cream recipes and ideas. Let’s go back to the “good old days” and make some memories (and a sweet treat too).
http://www.agriculture.com/ag/story.jhtml;jsessionid=K5JSWXUWRLTZACQCEAQB42Q?storyid=/templatedata/ag/story/data/1257261099483.xml
Corn, soybean harvest accelerating in the Corn Belt
Reading the .pdf D’Aleo’s forecast could be considered to hold water because he takes quite a bit more than just ENSO into account, but who will be more right, D’Aleo or the old farmer’s almanac?
Pamela Gray (14:14:21)
“I noticed yesterday that weather systems (clouds, moisture, etc) were traveling at a pretty good clip East to West along the equatorial belt.”
Would this mean a La Nina on the way, if it continued?
Key to your East Coast winter is what happens on the West Coast. If High Pressure blocks, it means the storm tracks head north to BC and loop down upon the plains to Midwest pickup up brutal cold from Canada and mixing it with Gulf stream moisture. If that happens, you all will get buried.
A more straight West-East situation is the better for all concerned.
Any projections?
Pamela Gray (14:14:21) :
Good eye, Pam. The lack of Solar Activity says nothing to drive the weather systems. The squirrels are on strike, the rubber band goes limp, and the gears stop turning.
Meanwhile, back at the loony ranch, mouthpieces are blasting their infinite-loop warming mantra in total oblivion, perched atop thier MSM soapboxes.
Adam from Kansas (19:05:25) :
Reading the .pdf D’Aleo’s forecast could be considered to hold water because he takes quite a bit more than just ENSO into account, but who will be more right, D’Aleo or the old farmer’s almanac?
That’s an interesting question.
Last year it was Joseph D’Aleo who made the Old Farmer’s Almanac forecast.
Maybe he made the forecast for this year as well but made a revision after the October data came in.
If Old Farmer’s Almanac would place a revision at their web site, they would generate a lot of traffic.
Why don’t we ask him?
Thermodynamics be damned?
While shivering in our homes, unable to afford to heat them because of Cap-n-Trade, we must remember that we are saving the world’s oceans, which NASA and HadCRUT tell us are about to boil, because Maxwell’s demon is alive and well and channeling all the heat away from land and into the oceans.
Now, isn’t that comforting?
P.S. – I live in Central Florida, and if I am not forced to move, I’m not about to.
Happy to see the worst(relatively speaking) out east. Looking at the vote last night, it is owed.
The sun continues to slumber – watch the cold deepen!
Henry chance (07:22:26) :
The only thing controlled by man is tax rates.
I don’t think so… Tax rates are controlled by politicians, and there is insufficient evidence to assert their humanity… 🙂
I’m honestly confused about all the data sources. For example under “tools” at the right http://discover.itsc.uah.edu/amsutemps/ show a lot of samples higher. How to interpret all this???
In a “mild winter” in Alaska its only 20 below. What balmy weather.
red432 (08:07:42) :
“Tools?” I don’t see it.
yes tools on the right in the list of list of links area just above blog stats and just below skeptical views.
Ron de Haan (20:59:10) :
I just did, he’s busy enough so he may not respond.
One problem with articles in the OFA is the lead time and I don’t think they’re set up to update things on the web.
Joe’s best stuff is at icecap.us and http://www.intellicast.com/Community/
I got a lot more back from Joe D’Aleo than I expected. He doesn’t take credit for last year’s (or this year’s) OFA forecast, but I think the OFA was strongly influenced by his article.
He adds:
I did not do the Old Farmer’s Almanac Forecast last year or this year, only a story on natural factors in climate change last year.
I do the forecast each winter for other applications and sites using many different factors as was noted. The forecasts used to appear on Intellicast where I was Dr. Dewpoint and then used successfully as a partner in a hedge fund for 3 years before all the markets went crazy which caused us to disband just in time (even though we were ranked #2 among 167 funds the first two years). I am using the same technique in an Ag forecasting effort for WSI now (I helped them develop statistical models for seasonal forecasting for their energy market in the early 2000s).
We correctly caught the Indian and southeast Asian monsoon issues, the drought in Argentina this year, the flooding in central Brazil, the cold wet springs and summers the last two years with delayed plantings and harvests, the drought in the southeast and then south central US the last two years.
I present the winter forecast and do snow forecasts for Boston each year at the Boston NWS Winter Weather Workshop for the media. I called the cold snowy 2000/01 winter, explained the 2001/02 on the basis of the strong second solar max (which leads to ultraviolet induced ozone production and warming in low and mid latitudes and a ‘zonal’ winter). Based on the head of NWS seeing that presentation, I was invited to talk to CPC in October 2002 where I explained the importance of inputting actual solar conditions into climate AND forecast models. We showed that during high solar flux periods, the model errors varied with a correlation of over 70% with one month delays). The models consider input into the top to be constant.
During that meeting, I predicted a cold and snowy eastern US winter. I was told that I would be wrong, it was a “slam dunk warm winter’ forecast. It ended up as I predicted. I was invited back the next year but my company refused.
We had a strong signal for the frigid cold in January’s 2004 and 2005 and December 2005. We also called for Katrina’s track two days ahead of TPC.
When I returned to WSI, in 2008 we went for very cold and snowy winters and springs in the northwest and north central and northeast the last two winters.
This winter we are in transition with a few key factors. We have an El Nino that will likely fade after early December, are in a background PDO state but may be slightly positive due to the El Nino early, we have very low solar, a warm tripole in the Atlantic (favors negative NAO), some leftover effect of Redoubt and Sarychev (favors negative NAO/AO) and a QBO that is transitioning slowly to east from top (30mb) to bottom (50mb). East QBOs mean a trough from east central US to northern Europe and storms that head out to sea south of where they go in west El Nino (a little like what Ida’s remains will do).
East QBO low solar years favor stratospheric warmings, which also favor negative AO/NAO and a long stretch of below normal.
Negative AO and NAO means cold. The most similar years had coldest relative to normal month January. Some of the years were warmer in December western and central especially.
Those years were drier than most El Ninos in California and Texas but wetter along Gulf and southeast coast and in Florida. Lots of lake effect snows.
One big wildcard is the solar. No analogs since 1950 have been this extreme, maybe more like one of the winters in the early 1900s or better yet late 1700s, early 1800s.
red432 (18:54:37) :
“yes tools on the right in the list of list of links area just above blog stats and just below skeptical views.”
@this website?
http://discover.itsc.uah.edu/amsutemps/
There in no list of links and it isn’t a blog, at least not on my display (in FireFox).
It’s a nifty website, though. Thanks for the link.
______________________________________________________________
ASIDE1 – from their “Daily global average temperature at: Sea Surface” plots I don’t see anything unusual, just what appears to be normal variation.
If anything, 2007 and 2008 were abnormally low compared to the rest of them, which are rather closer (check all boxes back to 2003, and click on “redraw.”
And why is the peak in the temperature data in March? Is it because the bulk of the ocean data comes from the Southern hemisphere? It shows March (end of Southern Summer) temps running around 70.5F, while for Sept (‘dog days’ of the North) it shows another, but lower peak at 70.0F. Just curious.
___________________________________________________________________
ASIDE2 – and if the report at this link is correct (lead article) that’s even more evidence that they aren’t being totally honest with us.
http://antigreen.blogspot.com/2009/10/ocean-is-heated-from-below-globe-is.html
___________________________________________________________________
NOAA: “…third coolest October on record.”
“The average October temperature of 50.8°F was 4.0°F below the 20th Century average and ranked as the 3rd coolest based on preliminary data.
For the nation as a whole, it was the third coolest October on record. The month was marked by an active weather pattern that reinforced unseasonably cold air behind a series of cold fronts. Temperatures were below normal in eight of the nation’s nine climate regions, and of the nine, five were much below normal. Only the Southeast climate region had near normal temperatures for October.”
http://www.ncdc.noaa.gov/sotc/?report=national&year=2009&month=10&submitted=Get+Report
Sounds like they called it like they see it.