The Solar and Heliospheric Observatory (SOHO) satellite is back in operation after some required downtime to keep it operating.
Alas, it didn’t miss anything, the sun remains spotless.

From Spaceweather.com
According to NOAA sunspot counts, the longest stretch of spotless suns during the current solar minimum was 52 days in July, August and Sept. of 2008. The current spate of blank suns is putting that record in jeopardy. There have been no sunspots for almost 42 days and there are none in the offing. Deep solar minimum continues.
Spotless Days
Current Stretch: 42 days
2009 total: 184 days (79%)
Since 2004: 695 days
Typical Solar Min: 485 days
There’s some contention over that claim, as WUWT readers may recall that SIDC in Belgium last year retroactively counted a sunspeck from a drawing by Catainia observatory, nullifying the stretch of sunspotless days in August 2008. NOAA’s SWPC appears not to recognize that sunspeck and so their claim is for a 52 day stretch.
Will SIDC pull another sunspeck stunt this August? I’m sure they are “poreing” over the sketches now.
Joe D’Aleo puts this current stretch in perspective:
Today, Thursday, August 20th marked the 41st straight day without a sunspot, one of the longest stretches this solar minimum.

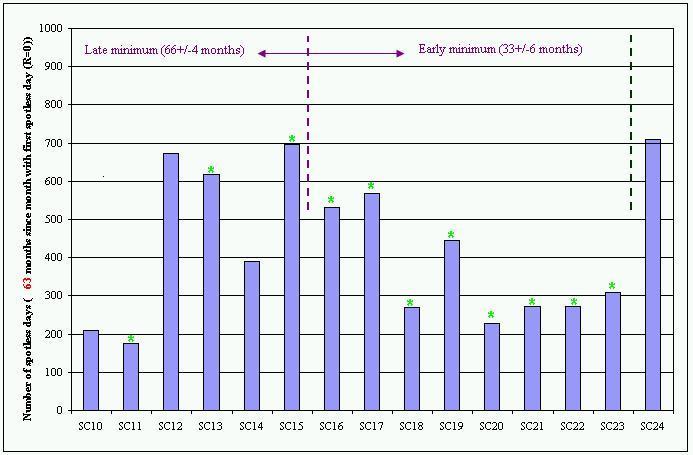
In fact it rises into 10th place among all spotless periods since 1849 (first table here). The total number of spotless days this transition from cycle 23 to 24 is now 694 rapidly approaching the approximate number leading into cycle 15 in the early 1900s (below, enlarged here).

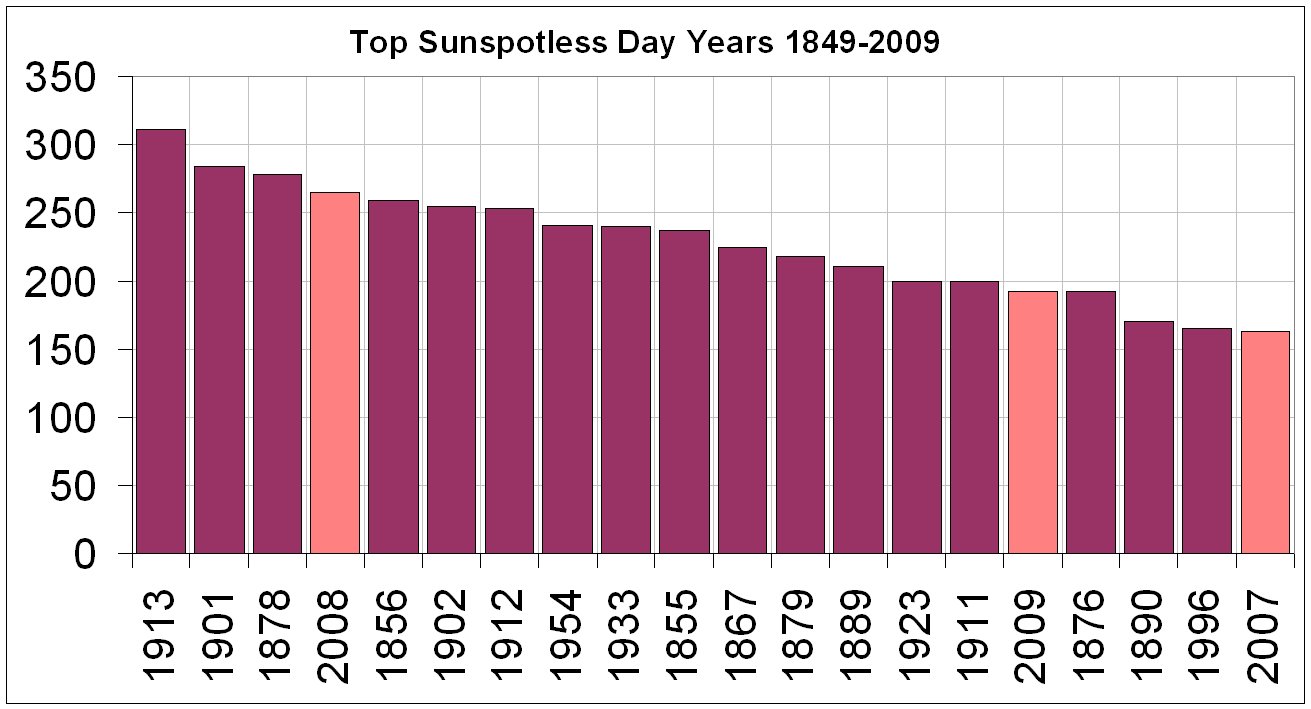
We have had 183 spotless days this year (79% of the days). We are in the top 20 years in 17th place. We will very likely rapidly rise up the list in upcoming weeks and rival 2008’s 265 days and likely end in the top 5 years. 2007, 2008, 2009 will only have 1911, 1912, 1913 in the top 20 as string of 3 per transition (below, enlarged here).

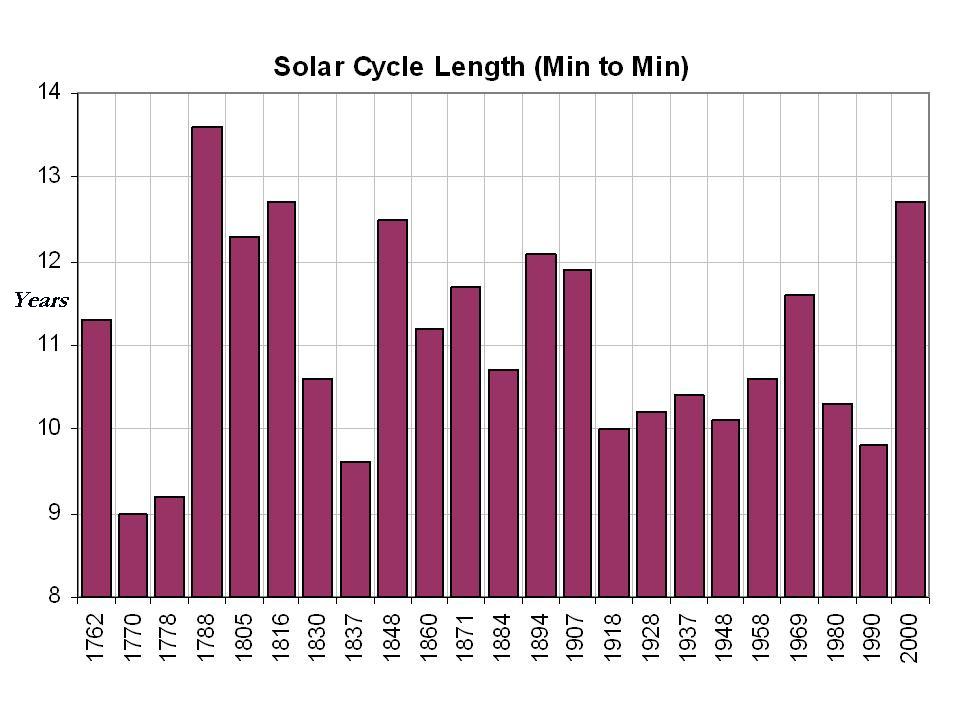
The cycle minimum probably was December, 2008. January 2009 13 month average came up a bit due to slight bump in activity in June and July but if August should end up sunspotless and September low, we could have a double bottom. The 12.7 years assuming December 2008 was longest in two centuries (below, enlarged here).

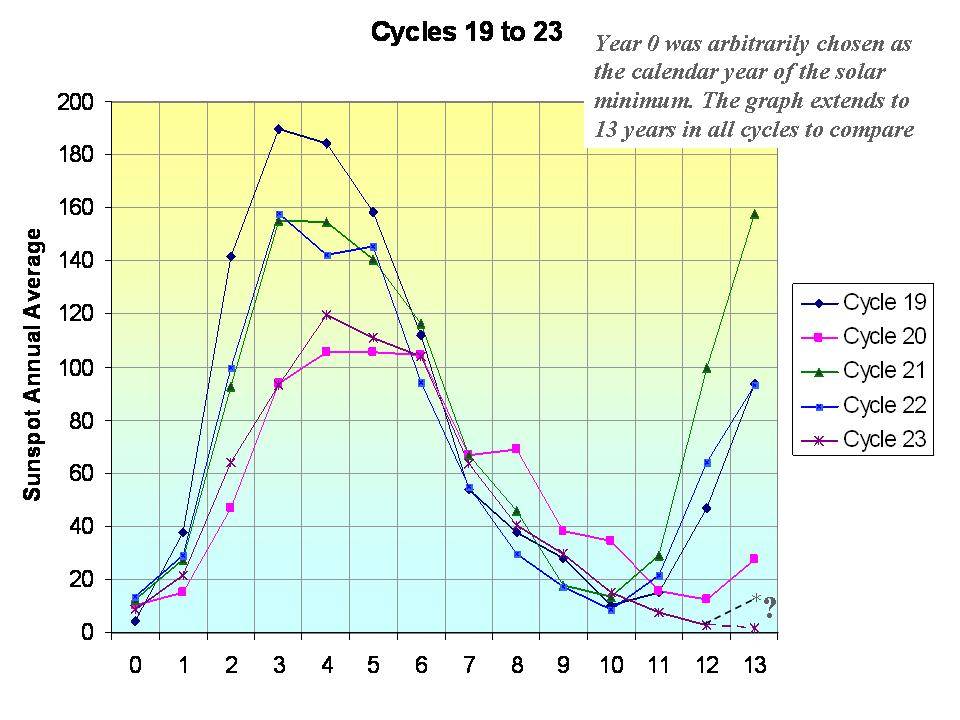
You can see on this chart, by 13 years after the solar minimum year, most of the last 5 cycles already had recovered, in one case already to the solar max (below, enlarged here).

This cycle has continued to decline in the solar irradiance, solar flux, sunspot number and geomagnetic activity after 10 years. On the following chart produced by Anthony Watts, you can see the Total Solar Irradiance declining whereas the prior cycle was rebounding(below, enlarged here).
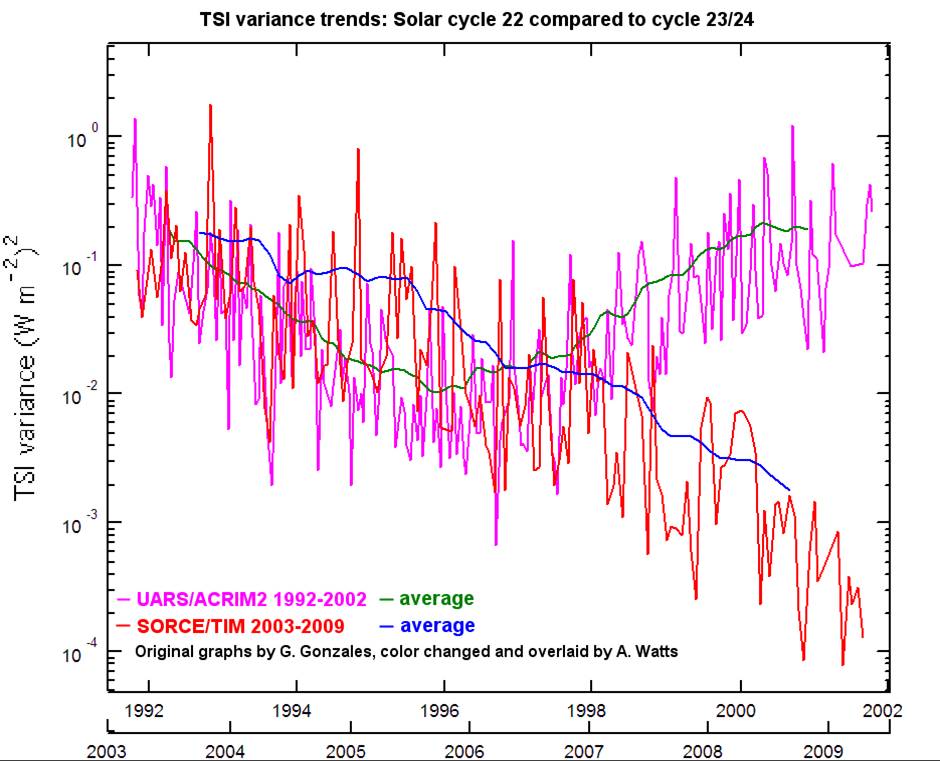

Clilverd et al 2006 suggests using a statistical analysis of the various cycles (11, 22, 53, 88, 105, 213, and 426 years) shows the next two cycles will likely be very quiet much like those of 200 years ago in the early 1800s, the so called Dalton Minimum, the time of Dickens (with snows and cold in London like last winter) (below, enlarged here).
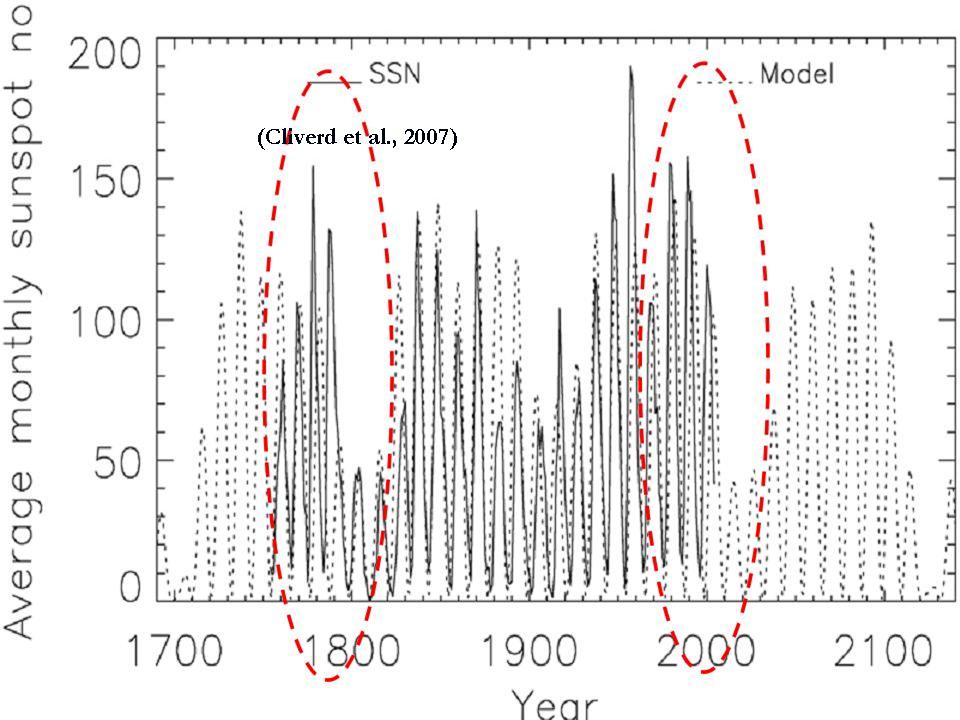

See what David Archibald shows what the result might be if Clilverd is correct here. Some have not ruled out an even stronger Maunder like Minimum. See more complete PDF here.
Discover more from Watts Up With That?
Subscribe to get the latest posts sent to your email.
Willy (13:53:26) :
To E.M.Smith: The sun does indeed appear to radiate about 6.6% stronger in Winter, every Winter — this is because Earth is closest to the Sun in January, when the Earth is at perihelion.
And be thankful that it is. Due to precession of the equinoxes, in a few thousand years time, the greater insolation will be in the Southern Oceans. The Northern landmasses will get VERY COLD – prepare for ice ages.
The distribution of the land masses have an incredible effect on the climate. I assume that, eventually, the landmasses will all end up around the equator. I’m puzzled by how Antartica appears stuck on the South Pole. I mean. even Australia is moving.
Carsten Arnholm, Norway (14:23:50) :
Mr. Alex (11:22:03)
See the SOHO thread for Leif’s explanation of his “semi-sun-speck”.
UK Sceptic (10:28:51) :
Alan the Brit
If our lot don’t do anything stupid the Ashes will be ours…all ours!
Here I was thinking a little good news on the fight for reason at this site would cheer me up, unlikely to be anything here about the terrible cricket news. Doh!
Come on. Cricket is teh ghey.
Steven Hill (13:22:31) :
“So, if this period causes cooling, is it delayed? I don’t see that much cooling.”
The oceans store an immense amount of heat, whereas the change in solar output appears to be relatively small. Given this scenario it could take many years for Earth to cool down, unless another factor, e.g. a major volcano, altered the balance.
“Does anyone know for certian?”
No. Nor will we for many years. This is what is so troubling about the supposed scientific consensus on anthropogenic global warming. We don’t understand how the sun works, we don’t understand how the clouds work, yet Warmists claim to understand Earth’s climate and its future trajectory with absolute certainty. At present we have a rudimentary understanding of Earth’s climate system.
“Or is this period of low activity keeping us from the hockey stick rise in temp?”
Possibly, but the evidence that CO2 is a major driver of Earth’s temperature is quite flimsy. The Hockey Stick graph has been thoroughly discredited and we don’t know what other evidence might have been falsified. I am an avid reader and very openminded and based on a preponderance of the evidence, I’m skeptical.
If the little pipsqueak peek-a-boo spots stand in official counts, then the 1911-13 and 1898-1901 records are also reduced. They had those type of spots, weak and fleeting, and they are recorded on photoeheliograms but not in the official counts.
How do the keepers of the count wish to slice this?
A.) Keep to the standards by which NOAA has 52 spots in 2008 or
B.) go back and insert the phantoms in the historic record and prune the spotless days counts?
Your wish is my command. Standing by and ready to take the machette to the confetti.
The kicker is, that no matter how you count or don’t count Casper the Friendly Sunspeck, Solar Activity for very long stretches was and is at very low levels.
Knock, knock, knockin’ on Daltons Door.
Richard (15:22:14) :
Strange things can happen to a slightly lowered TSI and raised UV as it strikes obliquely in the high latitudes. Blurring due to refraction is a problem in the UV, and it accelerates much faster than IR as the angle increases.
Also, those EIT 284’s are showing a healthy increase in GCR hits, much like the early HST WFPC1 images did on long exposure last solar minimum.
Somehow I don’t see lone Coronal Hole high-speed streams now & then as helping matters much.
10.7 is rising; Leif can’t be wrong about that. I think we are seeing the Livingston and Penn effect; but for the Chesiring of the Cat, we’d see a few small Cycle 24 spots. They’re comin’ round the mountain occultly spinnin’ yarns.
=====================================
rbateman (16:36:46) :
If the little pipsqueak peek-a-boo spots stand in official counts, then the 1911-13 and 1898-1901 records are also reduced. They had those type of spots, weak and fleeting, and they are recorded on photoeheliograms but not in the official counts.
How do the keepers of the count wish to slice this?
A.) Keep to the standards by which NOAA has 52 spots in 2008 or
B.) go back and insert the phantoms in the historic record and prune the spotless days counts?
Your wish is my command. Standing by and ready to take the machette to the confetti.
The kicker is, that no matter how you count or don’t count Casper the Friendly Sunspeck, Solar Activity for very long stretches was and is at very low levels.
Knock, knock, knockin’ on Daltons Door.
~~~~~~~~~~~~~~~~~~~~~~~~~~~~~~~~~
Or knock, knock, knockin’ on Maunder’s door…
kim (17:22:05) :
10.7 is rising; Leif can’t be wrong about that.
it was rising, but taken an odd little dip. And if the sun continues blank, it may stay low. We shall see how it goes.
Or sing along with Mitch Miller.
A funny thing happened on the way to the Dalton….the SSN bounced up & down 4 times.between Jan 1798 and May 1800. If someone wants to claim the ball bounced higher on the way to the Dalton, they would probably be right.
As for knockin’ on Maunder’s door, the Paris Observatory should have a nice collection of sunspot drawings from who’s who in Early Modern Astronomy. Picard is reported to be a perfectionist supreme and the one La Hire drawing I have seen is a masterpiece.
What I wouldn’t give to see that stuff !!!
Still waiting for the next Nasa Cycle 24 forecast.
Robert Wood (15:35:45) :
The distribution of the land masses have an incredible effect on the climate. I assume that, eventually, the landmasses will all end up around the equator. I’m puzzled by how Antartica appears stuck on the South Pole. I mean. even Australia is moving.”
Why do you assume that the landmasses will land up at the equator? And why are you “puzzled by how Antartica appears stuck on the South Pole”? Australia maybe “moving” but then so is New Zealand and Antarctica and every other tectonic plate in the world.
In 200 million years Europe and the America’s will be very far apart. The Atlantic larger than the Pacific, North America straddling the equator, Australia in the northern hemisphere, etc. But dont expect to see any changes tomorrow, or even in the next thousand years. The movement is very slow.
Do a google search for “Continental Drift” and you will get plenty of information on this.
Due to precession of the equinoxes, in a few thousand years time, the greater insolation will be in the Southern Oceans. The Northern landmasses will get VERY COLD – prepare for ice ages.
It is when summers get cooler that “ice ages” start by melting less of the previous winter’s ice and snow.
Precession is not the only way that the Earth’s climate is affected astronomically.
The axial tilt varies from 22.1 degrees to 24.5 degrees and back again on a 41,000-year cycle. Currently, this is at 23.44 degrees and decreasing. Minimum means more favourable conditions for an ice age, because the mean insolation reduces in high latitudes as well as reduction in summer insolation.
It will reach the minimum value around 10,000 AD.
Then there is the orbital inclination about the invariable plane. This has a 100,000 year cycle matching the 100,000 year cycle of the ice ages. It is hypothesised (and I favour that), that this passes through a disk of panetary dust which causes the ice ages.
The Earth presently moves through this plane around January 9 and July 9, very close to the perihelions and aphelions.
I think this combined with the half cycle of the precession, which is around 10,300 years is connected with the length of the interglacials, as the correspondence of the lenghts is very good.
If this be so then the next ice age is not too far away and if CO2 is indeed keeping us warmer then it may just be our best friend, as Svante Arrhenius, the adopted father of the warmers, thought it would be.
PS The half-cycle of the precession is about 10,800 years, which will hopefully give us a couple of centuries more of warm weather.
Here on, whether reference is to Sun or Snipe, there is more misinformation than otherwise. However, more certainty seems to involve the Snipe than the Sun. See:
http://images.google.com/images?hl=en&q=snipe+birds&revid=1457072127&resnum=0&um=1&ie=UTF-8&ei=yGKPSveqKY_KsQPXn40M&sa=X&oi=image_result_group&ct=title&resnum=4
or
http://www.mbr-pwrc.usgs.gov/Infocenter/i2300id.html
Robert Coté (10:11:02) asked:
“What is that old saying about a ‘watched pot?’ ”
Yes, the very act of all us skeptics watching the sun for its next spot will be blamed for changing the normal observation of many spots ala the quantum-level “Observer Effect!”
Sorta like Krakatoa’s recent rumblings and ramp up? The big anniversary is next week too.
Interesting times indeed.
http://www.dailymail.co.uk/news/worldnews/article-1203028/Will-Krakatoa-rock-world-Last-time-killed-thousands-changed-weather-years-deadlier.html
Rhys Jaggar (09:37:11) :
What odds on neither the NE Passage NOR the NW passage being navigable this summer?
9 hours ago: “Beluga ships travel northeast passage”:
http://www.google.com/url?sa=t&source=web&oi=news_result&ct=res&cd=1&url=http%3A%2F%2Fwww.joc.com%2Fnode%2F413026&ei=FnKPSoWSKo6wsgPy5rgO&usg=AFQjCNHCZRRwbCBvYtLqy5XHRc29WmuaVw&sig2=X_JEHNHxOt-VobkI180YlQ
Roger Knights (21:22:01) :
Rhys Jaggar (09:37:11) :
What odds on neither the NE Passage NOR the NW passage being navigable this summer?
9 hours ago: “Beluga ships travel northeast passage”:
I think the odds are that both will be (WILL BE) navigable this summer. Thats because we still have about 20-25 days of ice melt left.
However to claim that the Beluga ships have already traversed the northeast passage is a little premature. They are on their way. There still seems to be a bit of ice around the Russian Ostrov Oktyabrskiy Revolyutsii, that might give them a bit of trouble.
Michael (13:09:01) :
On the El Nino scale, how does our current El Nino measure up?
As one of the forecasters that actually got the ENSO forecast right the last two years, I’ll take this one.
It is mild, and at the moment, in decline. To get El Nino conditions, you need SST anomalies of +0.5ºC or better. Right now we are between 0.5 and 1.0 in all four regions, and like I said, in decline.
Contrast this to 82-83 and 97-98 with SST index anomalies roughly in the +2.8º range. Most since then have been between +1 & +2ºC on the SST index.
NASA and NCEP, being who they are, are looking for a strong El Nino in the +2.4 and +2ºC range respectively. I’d bet one of my snowmobiles that they aren’t even close. Again.
More on topic, it is good to have SOHO back, even if there isn’t much to look at. Yet. Enter the Watts Effect in 3…2…1….
While the MDI’s are relatively blank, the EIT’s of SOHO are still giving much information.
Primarily the 171, 195 and 284.
The 284 is a smorgasbord of GCR strikes.
There’s nothing wrong with the Sun. It looks like a healthy orange to me.
Aren’t you happy it got rid of the acne spots?
Robert Wood (15:23:29) :
Be patient, Steve, teh thermal time constant of the ocean is massive, and I reckon they cool more slowly than they warm.
That’s all well and good but does anyone have an estimate of the time constant. Although it can depend on which sun/climate “correlations” you look at, the temperature response seems pretty immediate. In some cases it’s responded before the change in solar activity.
I’m also a bit concerned that the solar activity peak, i.e. the “grand maximum” peak, was in the early 1990s which was nearly 20 years ago. SC23 was a fairly average cycle in terms of SSN. The temperature dip in 2008 was claimed by many to be solar-related when it was, in fact, simply due to a long-overdue La Nina.
So what is the official solar/climate theory position?
I have a question for anyone. It seems that every year the “Global temperatures” peak in July and they are the minimum in January. July max is about 2.9 C warmer than Jan min.
http://discover.itsc.uah.edu/amsutemps/execute.csh?amsutemps
Now why should this be so? When it is summer in the northern hemisphere its winter in the Southern and vice versa. Why should temperatures vary in this way? Specially since aphelion also falls in July, if anything July should be colder
That link doesnt work. Use this:
http://discover.itsc.uah.edu/amsutemps/amsutemps.html
At the bottom left hand choose Near Surface Layer (CH4) and Celsius. Tick a few years and draw graph