As promised, I contacted Dr. John Christy regarding the seasonal signal that the anonymous blogger “deepclimate” says he/she has identified in the UAH data, seen below. He/she says: “I am a Canadian citizen residing in Canada. For private and professional reasons, I prefer to remain anonymous to the general public, at least for now.”
I’ve never understood the need for some people to remain anonymous while at the same time attempt to do science. Imagine the furor if scientists like Christy or Spencer created an anonymous blog and then were later discovered. I’m sure it would be immediately up there on sourcewatch with “tsk tsk” attached.
Science really should be done out in the open. Here’s Dr. Christy’s in the open response.
Dr. Christy has made a response in the readme file at the UAH website here:
http://www.nsstc.uah.edu/data/msu/t2lt/readme.18Jul2009
Update 18 Jul 2009 ************************************
Corrected trend values (1700 CST)
It was brought to my attention by Anthony Watts that there has been some discussion about the noticeable annual cycle in the LT and MT trends when done by months. In other words, the trend for Februaries is on the order of 0.12 C/decade warmer than the trend for Mays. Other data sets don’t have such a large range in trends when calculated by months, RSS for example has a range of 0.05 C/decade. (Note, this issue doesn’t affect the overall trend.)
The feature arises when the AMSU data are adjusted and merged into the MSU data stream beginning with NOAA-15 in Aug 1998, then carries forward with NOAA-16 and AQUA (both of which are AMSUs too). The process involves at one point
the removal of a mean annual cycle in the anomaly differences from one satellite to another. It turns out that all satellites have a residual annual cycle due to each instrument’s peculiarities. In the end, all annual cycles are matched to NOAA-6 and NOAA-7.
Detecting the impact of this peculiarity is difficult. For example, it is not seen when
gridded data are directly compared against radiosondes (see Christy
and Norris 2006 and 2009.) However, an annual cycle in the difference time series is clear in RSS data when compared with balloons (see Fig. 2 of both papers.)
I’ve tested a number of alternate processing methods (basically versions of
not removing the annual cycle in the difference time series from the first
AMSU onward) and the range from the highest to lowest is reduced
to just under 0.09 C/decade. This in effect establishes a new annual
cycle for the AMSUs based on the first AMSU.
I think the magnitude of the annual cycle in the monthly trends is a
legitimate problem to address. The range in the current v5.2 LT looks too large
(about 0.12 C/decade). However, one should expect differences from month to month, especially when ENSOs and a volcano have different impacts by months so
so the range shouldn’t be zero. I’ll keep looking into this and if a
reasonable result is produced, I’ll rename the dataset v5.3.
The important point in all of this is that the overall global trend of the entire
time series ranges insignificantly from +0.123 to +0.125 C/decade even
under the different merging methods used to date. This is because the removal of the annual cycle of differences from satellite to satellite does not add any bias
to the time series, so the overall trend doesn’t change.
A consipiricy theorist might suggest that the name deepclimate has connections to the name of the watergate informer deepthroat, Hanson has always been interested if not obsessed with the romantic idea of being a whistle blower type peoples hero and makes no secret of his admiration for ‘secret squirrels’ jumping out of the vipers nest with planet saving information.
Dave Clarke from the Dave Clarke five, a popular band and a favourite of Hansons to boot, of course the above is just a lateral thinking brain anomoly and may well explain how my mind works, so please snip at will.
If nothing else its amusing!
DC……..phone home.
1of10 (11:57:04) :
“REPLY: try getting an anonymously authored paper published in a peer reviewed journal. – A”
Yeah, but the reviewers get to be anonymous to the author.
John (18:01:30) :
There are large, very profound cracks along the seabed where water is already making contact with the fire inside the Earth. These cracks are due entirely to the atomic tests.
I really think you should look up Ring of Fire, and the Hawaiian island chain, as well as the history of Iceland. Facts are that there are probably more active undersea volcanoes then you see on land. They spit and spudder, they have lava flows, but it is a very difficult science to get info on because we barely have the means to research them effectively. Just recently a volcano topped the surface of the ocean near Tonga. It was quite impressive and had nothing whatso ever to do with Nukes:)
Some of the most pronounced sea levels rises we are seeing are in highly volcanic areas. I also suspect that some of the sea temp changes we see might have a volcanic helper or two, but wind currents and ocean currents decide where it is mixed. But… that is a guess on my part. I defer to the experts on that stuff.
http://sealevel.colorado.edu/maps.php
re. anononymous researchers.
There are some employers that don’t like their bright minds in the public eye. I seem to recall there was some guy called “student” (back to stats 101) who liked comparing means of data sets. This guy who worked for some Irish brewery had his research published in Biometrika 1908.
Dr. Christy –
Thank you for the post. Very informative.
Well even though I’m firmly in the sceptic camp, I can understand why some want to be anonymous. Let’s be honest, there are an awful lot of loony tunes out there in Netland. I’ve run into a few while posting on forums. The first time I came on here was with a pseudonym, until I could see that the debates are quite civil and moderated – it stops the crazys from getting hot under the collar about something one might write. Incidentally, if you’ve never read the realclimate site, you should do so just to read the ramblings of dhogaza. The man is possessed. It’s very amusing.
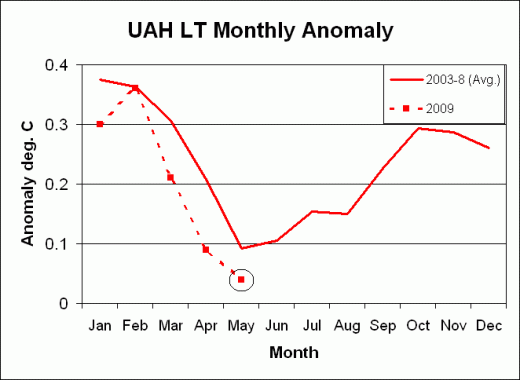
This is really poor. Just 5 May data points and we are suppposed to use that to question the validity of UAH.
For one thing, the ENSO alone could have an effect on these numbers – remember El Ninos and La Ninas normally peak in November to January and there is a three month lag before the impact is felt.
In the five 2000 to 2008 spring data points, there were three La Nina events (3 months earlier) out of the five years.
The AMO as well seems to have declined in the spring 3 times out of the 5 years as well.
If anything, the other temperature databases should have a similar variability in the “seasonal cycle” of these particular 5 years (when the normal seasonal cycle is determined over 31 years to 159 years).
Bill Illis (06:12:01) :
For one thing, the ENSO alone could have an effect on these numbers – remember El Ninos and La Ninas normally peak in November to January and there is a three month lag before the impact is felt.
I already made that point to Paul K, Blue Grue and Deep Climate on another thread, but they ignore it, don’t answer it, and keep tooting the same horn regardless.
Childish really.
Paul Vaughan (16:58:03) :
–
Those who are promoting the notion that the small amounts involved are irrelevant should consider brushing up on Stat 101 – (see chapter 2). It is not the magnitude of the residuals that violates the model assumptions; it is the scatter.
Taking account of real phenomena and not homogenising the data to death is quite important too.
Through the first 19 days of July, the average high in Louisville, Ky has been 81.4 which is the coolest ever. Morning lows are averaging about the 22nd coolest ever so the clouds have been holding that daytime high way down.
Daily average temperature Daily maximum temperature Daily minumum temperature
Standiford Airport (Louisville) 73.8 (7th coolest) 81.8 (1st coolest) 66.6 (22nd coolest)
Lexington Airport 72.1 (11th coolest) 83.8 (2nd coolest) 63.8 (23rd coolest)
Bowling Green Airport 74.7 (8th coolest) 80.3 (6th coolest) 65.5 (27th coolest)
From WAVE3
“Jim (18:28:12) :
Paul K (16:24:58) : What is your position on the GISS data? Are you privy to the computer code and methods used to massage the raw data. Do you consider it to be a better representation of the temperature trend that either RSS or UAH or both?”
Paul K. – Where did you go? Are the questions too hard for you? If you don’t knw how GISS “adjusts” data, then you would only have “faith” that the numbers are accurate and meaninful. Faith ain’t science.
Bill Illis (06:12:01) :
This is really poor. Just 5 May data points and we are suppposed to use that to question the validity of UAH.
Actually 6 and this year is following the same pattern.
For one thing, the ENSO alone could have an effect on these numbers – remember El Ninos and La Ninas normally peak in November to January and there is a three month lag before the impact is felt.
In the five 2000 to 2008 spring data points, there were three La Nina events (3 months earlier) out of the five years.
The AMO as well seems to have declined in the spring 3 times out of the 5 years as well.
If anything, the other temperature databases should have a similar variability in the “seasonal cycle” of these particular 5 years (when the normal seasonal cycle is determined over 31 years to 159 years).
There is some similar structure in RSS but not to the same extent as UAH, the key is that UAH have made a methodology change for that period RSS hasn’t.
Paul K (16:51:07) :
Frustrating to say the least. This site is the most heavily censored site I have ever posted on.
Paul, you know deep down that’s not true. You’ve posted this on WUWT:
Paul K (16:24:58) :
In fact, some of the commentators above might want to read his three posts on the UAH seasonal swing in reported anomalies (the links are already given above), and in the other two WUWT posts here. Please guys, at least read the other two recent WUWT posts on the monthly global anomalies, starting with the completely off the wall post ridiculing the GISS report, before starting with the conspiracy theories again.
http://wattsupwiththat.com/2009/07/14/giss-for-june-way-out-there/
http://wattsupwiththat.com/2009/07/16/ncdc-june-2009-second-warmest-on-record-globally/
Change your blog name to something anonymous, and try posting that on RC.
To the moderator: Thank you for reinstating my post out of the spam bucket. It helps a lot if readers can at least read the studies they are critiquing, along with previous commentary on WUWT.
To Bill Illis: Please read the analysis on Deep Climate’s site (3 posts there) repeatedly linked to here on WUWT. They answer your questions. There is no doubt a significant seasonal swing in the UAH record, much higher than the RSS record, which should be the closest comparative record. Even Dr. Christy admits this is a significant variation in his comments.
REPLY: “Sorry” (for jumping to conclusions and assuming he was being censored and making that accusation) is not in Paul K’s vocablulary apparently. But given how mean Paul K is and the things he says about WUWT on other blogs, one really would not expect him to be capable of doing so.- Anthony
Jim (18:28:12) :
Paul K (16:24:58) : What is your position on the GISS data? Are you privy to the computer code and methods used to massage the raw data. Do you consider it to be a better representation of the temperature trend that either RSS or UAH or both?
I am not the most qualified person who posts here, to answer your question, but here are my thoughts and conclusions on this:
The numerical values of the anomalies of the various temperature records cannot be compared directly, due to a host of issues. Many of the records use different base periods to calculate the anomalies, and thus the reported number would need to be adjusted for this. The different records combine the satellite and other recorded temperatures differently and they handle the polar regions differently (RSS and UAH in particular differ greatly on this, even though they both are primarily satellite data based).
GISS data is collected and calculated more directly on input like sea surface temperatures (SSTs) and so there could be valid and real differences between GISS and UAH: i.e. both could have different measurement results, and both could be valid for the variable data they collected. This is especially true for short term data, like month to month data.
If you look at June reports, the GISS and NOAA reports are clearly picking up the cyclical rise in SSTs as we move into what seems to be an emerging El Nino. These SSTs are clearly pushing the monthly reported number up.
The UAH report is based on lower and mid-troposphere temperature readings, and doesn’t use the SSTs directly.
To me, both reports could be accurate within their uncertainties, and both could end up being modified or corrected down the road. I don’t think a direct comparison at this point is meaningful. And I certainly don’t believe that this comparison justifies the accusations of data manipulation and f____ that posters on WUWT jumped to.
The anomalies of the various temperature records are best compared by looking at the warming trends that can be calculated from the records over a number of years. This is in fact the metric that Dr. Christy used in his response above. Bottom line, I trust UAH scientists are doing their best to collect and report data using the system they have, and that GISS scientists are doing likewise. We need to be knowledgeable enough to understand the limitations of their reports, and avoid jumping to conclusions.
I will finish by agreeing with Roger Pielke Sr. and a host of comments on the other recent WUWT post on sea level rise… Global warming is really best measured by the increase in ocean heat content (OHC), and the best measure of OHC is sea level rise over time, since the bulk of sea level rise so far is the thermal expansion of sea water. There is far more heat being stored in the oceans over time, than in the atmosphere. The oceans seem to exchanging heat with the atmosphere in short term cycles, and there may be a connection with sea levels rising faster during emerging El Nino periods. I would watch the sea level information over the next 24 months very carefully, and if sea levels hit new highs, this is a very strong signal of global heating.
David Ball said:
“The truth is starting to catch up with these guys and they are now knocking over garbage cans as they run in order to delay the inevitable. The harsh light of reality burns away the false veneer. I’m looking at you, deepclimate.”
I basically agree. Maybe it’s wishful thinking, but the warmists seem to be getting more and more desparate. For example, in the last year or two, I have started hearing claims that we have “X months” or “Y years” to save the planet from global warming.
I think what’s driving the desperation is that surface and ocean temperatures have been flat or declining for a number of years now, without any volcano to point at. If this trend continues for a few more years, the warmists are dead meat and they know it.
My opinion only.
Paul K (09:16:41) : Thank you for that answer, Paul. I infer from your answer that you are not privy ot the methods uses by NASA to adjust GISS data.
The GISS data is based on relatively sparse measuring stations, sparse relative to the surface area of the Earth. We know from the research done by Anthony so far, that many of these stations have been re-sited, that urbanization has occurred around them, some have been taken out of service, many have had equipment replaced over the years, the temperature measuring instruments are in some cases precise to only +/- 2 degrees, the time of day the temperature is read is variable, the physical condition of some enclosures have deteriorated; and we know neither NASA nor NCDC know the details of these changes. They have not validated the source of the GISS data. You tell me how some magical, statistical fairy dust can tease any meaningful data out of that mess without even knowing the details of the sensors?? I can see why they won’t publish the “adjustment” methods because I’m 95% sure they would end up impaled upon the same sword as Steig, Mann, and Rahmstorf.
Couple of points –
Cassandra King, does your brain anomaly trend differently in the winter than in the summer? Hey, I’m just asking… 🙂
FatBigot, i don’t care “what” you are, i’m going to love you for “who” you are. 🙂
crosspatch, again, RIGHT-ON! “Looking” in the wrong place for errors can make one very frustrated – – opps, sorry. Did i just hit the nail on the head – deepclimate? Hmm, i don’t think i’ll add that name to my spellchecker…
LOL, Laughing Out Loud, wws. But what does “Brits” mean? LOL – again!
….. and how do we KNOW a trend difference (as defined here, winter to summer) is an indication of an error? If the system we’re measuring is by definition unstable i.e., always changing, including the overall trend AND we do not know if this system is in one of those overall trend change phases…..
Any unstable analog system can produce short cycle “trend” differences within those short cycles, but especially during long cycle phase changes. Yes, keep analyzing but I’d hold off on that trip to Vegas if your betting those trends are errors in calculation.
Iceagenow has reported more than 100 low temperature records each during the last 2 days over the entire Eastern half of the U.S. the latest day saw that low temperature records were made in nearly every corner of my state of Kansas.
NOAA reports the July low max temp. record numbers officially left June in the dust with 1755 records either new or tied, which almost doesn’t make sense if UAH channel 5 is suggesting one of the warmest Julys ever since 1979.
Paul K (09:03:36) :
Even Dr. Christy admits this is a significant variation in his comments.
In your dreams.
“The range in the current v5.2 LT looks too large
(about 0.12 C/decade). However, one should expect differences from month to month, especially when ENSOs and a volcano have different impacts by months so
so the range shouldn’t be zero. I’ll keep looking into this and if a
reasonable result is produced, I’ll rename the dataset v5.3.
The important point in all of this is that the overall global trend of the entire
time series ranges insignificantly from +0.123 to +0.125 C/decade even
under the different merging methods used to date. This is because the removal of the annual cycle of differences from satellite to satellite does not add any bias
to the time series, so the overall trend doesn’t change.”
Adam from Kansas,
If I’ve understood correctly UAH ch05 covers the whole globe. Not just the US which covers about 3% of the global land mass (I thought it was). Does that make sense?
tallbloke: Christy said right in the quote you excerpted, that there was a range in the warming trend of 0.12 C/ decade (from the ‘high’ Jan/Feb trend, to the ‘low’ May trend). And he said that this range looks too large, and no kidding, it is! The entire UAH series itself only shows warming of +.123 to +.125, so the range in the monthly trends that is as large as the entire series trend, is a very significant month to month variation.
That is why we shouldn’t be using the monthly UAH data, particularly for May and June! How long does it take for you to understand this? And its not in my dreams, as you claim, but right out of Christy’s comments.
It does cover the globe, though for the U.S it doesn’t seem like it’s close to the hottest July on record, that means it must mean some part of the globe is experiencing way above normal temps. or the data is in error. Though with recent stories of below average temperatures around the globe one may wonder what the exact reason is.