As promised, I contacted Dr. John Christy regarding the seasonal signal that the anonymous blogger “deepclimate” says he/she has identified in the UAH data, seen below. He/she says: “I am a Canadian citizen residing in Canada. For private and professional reasons, I prefer to remain anonymous to the general public, at least for now.”
I’ve never understood the need for some people to remain anonymous while at the same time attempt to do science. Imagine the furor if scientists like Christy or Spencer created an anonymous blog and then were later discovered. I’m sure it would be immediately up there on sourcewatch with “tsk tsk” attached.
Science really should be done out in the open. Here’s Dr. Christy’s in the open response.
Dr. Christy has made a response in the readme file at the UAH website here:
http://www.nsstc.uah.edu/data/msu/t2lt/readme.18Jul2009
Update 18 Jul 2009 ************************************
Corrected trend values (1700 CST)
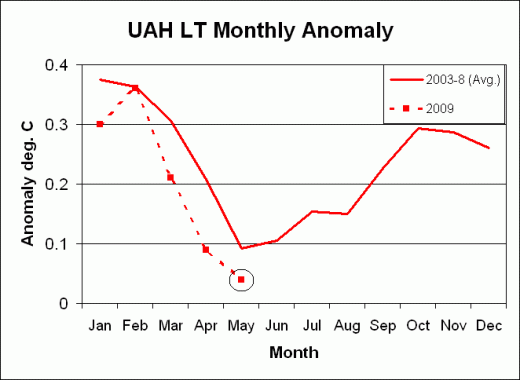
It was brought to my attention by Anthony Watts that there has been some discussion about the noticeable annual cycle in the LT and MT trends when done by months. In other words, the trend for Februaries is on the order of 0.12 C/decade warmer than the trend for Mays. Other data sets don’t have such a large range in trends when calculated by months, RSS for example has a range of 0.05 C/decade. (Note, this issue doesn’t affect the overall trend.)
The feature arises when the AMSU data are adjusted and merged into the MSU data stream beginning with NOAA-15 in Aug 1998, then carries forward with NOAA-16 and AQUA (both of which are AMSUs too). The process involves at one point
the removal of a mean annual cycle in the anomaly differences from one satellite to another. It turns out that all satellites have a residual annual cycle due to each instrument’s peculiarities. In the end, all annual cycles are matched to NOAA-6 and NOAA-7.
Detecting the impact of this peculiarity is difficult. For example, it is not seen when
gridded data are directly compared against radiosondes (see Christy
and Norris 2006 and 2009.) However, an annual cycle in the difference time series is clear in RSS data when compared with balloons (see Fig. 2 of both papers.)
I’ve tested a number of alternate processing methods (basically versions of
not removing the annual cycle in the difference time series from the first
AMSU onward) and the range from the highest to lowest is reduced
to just under 0.09 C/decade. This in effect establishes a new annual
cycle for the AMSUs based on the first AMSU.
I think the magnitude of the annual cycle in the monthly trends is a
legitimate problem to address. The range in the current v5.2 LT looks too large
(about 0.12 C/decade). However, one should expect differences from month to month, especially when ENSOs and a volcano have different impacts by months so
so the range shouldn’t be zero. I’ll keep looking into this and if a
reasonable result is produced, I’ll rename the dataset v5.3.
The important point in all of this is that the overall global trend of the entire
time series ranges insignificantly from +0.123 to +0.125 C/decade even
under the different merging methods used to date. This is because the removal of the annual cycle of differences from satellite to satellite does not add any bias
to the time series, so the overall trend doesn’t change.
Does anyone happen to know what variables they consider and may compensate for? For example: Orbit relative to equatorial bulge, tidal influence, local barometric pressure at point of measurement, etc., in addition to wave height and so on. I’m sure there are many more, and I think it would be interesting and informative to know the details of the measurement process. Without knowing the precise protocol it’s impossible to judge the reliability of the estimates.
We’re currently in a forecast streak of 80 degree days with few days forecast to reach 90 and a forecast in the 70’s Tuesday, in perspective we’re supposed to be around 93-94 degrees for the last half of July and the early part of August.
rbateman’s favorite long-range forecasting site (theweatherwiz.com) is suggesting this unusually cool spell could go on almost halfway through August, and this is a big change from previous years where we could be in the 100’s throughout nearly any week in August (though the June heatwave helps to cancel out the current cool spell some but may not cancel it out completely)
@deepclimate – “…Regarding anonymity: I have my reasons, which are largely personal and which I suppose will be revealed at some point. Meanwhile the following points may be of interest…”
@1of10 – “…Anonymity is not a factor. I can come up with greatest theory, algorithm, discovery, or invention, and as long a it is verifiable, it doesn’t matter if I am anonymous…”
I agree with 1of10. Science is nothing to do with personalities – anonymous or otherwise. I may be inclined to pay more attention to Steve McIntyre, for instance, rather than Sir David King, because Steve’s reputation is much greater, but that’s a human thing. If an anonymous message raises an issue which turns out to be important, we don’t reject it because we don’t know the author.
An anonymous scientist runs the risk of not acquiring prestige through being associated with the discoveries he/she may make, but, again, I can’t see that is an issue for pure science….
REPLY: As I said above, try getting an anonymously authored paper published in a peer reviewed journal. – A
It is quite interesting, that some people try to fingerpoint on such a small trend independant variation, while totally neglecting for example a 0.7° C/century warming bias of NOAA even against the presumably warming biased GISS.
However, at least satellite people address even these queries highly professional.
Thanks to John for the thoughtful answer! 🙂
Anthony:
I can quite understand the person who asked “not to be identified”.
I know of several employment situations where the “powers that be” are
complete, vile, untrustworthy, self centered left wing liberal loonies.
Conservatives who work for such people (usually in some technical capacity, say “underling MD’s” in a large medical situation, or real technical types, in a “high tech” company, where the execs are all LWL’s (left wing loonies).
Alas, LWL’s have NO trouble in being VILE and EVIL to those around them.
AND they have a HATRED of people of opposing points of view that makes certain actions in a “well educated country” (of 60 years ago) look civilized in contrast.
Perhaps we should point out Kepler, the astronomer/astrologer…who knew all the astrology he did was BUNK! But he did it, because the “rubes” paid him.
Well, if I had a good job..but continuance in it meant “keeping my political mouth shut”, I’d “keep my political mouth shut”.
SAD BUT TRUE!
Why shouldn’t there be a sine wave in the data on a yearly basis?
1) The Earth gets closer and farther away each trip around the sun
2) SH has much more water than the NH
Clearly the generosity of Dr. Christy is to be applauded. This is the correct way to answer an enquiry, regardless of the origin -extra terraneous or not- of this enquiry. Anyone should compare this with the attitude seen elsewhere in the climate blogosphere…
New from the (U.S. weather is not climate and doesn’t represent the world) department
The 300+ new or tied low high temp. records yesterday officially pushes the number of record low highs in July above the number seen in June, and there’s still 11 days left in the month, and you will not expect a peep about this in the national media.
http://www.ncdc.noaa.gov/oa/climate/research/records/index.php?ts=daily&elem=lomx&month=7&day=0&year=2009&submitted=Get+Records
Compare the numbers above to June posted here
http://www.ncdc.noaa.gov/oa/climate/research/records/index.php?ts=daily&elem=lomx&month=6&day=0&year=2009&submitted=Get+Records
The warmers can switch the record type to record highs if they want to, there are quite a few (though fewer in number)
Okay, I looked at deepclimate’s website and that told me all I ever will need to know about this poster.
One of dhogaza’s troll buddies, ’nuff said.
@ur momisugly Steven Hill (11:07:17) :
Issued by The National Weather Service
Nashville, TN
6:12 am CDT, Sun., Jul. 19, 2009
… UNSEASONABLY COOL TEMPERATURES TODAY AND TONIGHT…
CANADIAN HIGH PRESSURE WILL CONTINUE TO CONTROL THE WEATHER ACROSS MIDDLE TENNESSEE TODAY AND TONIGHT. CLOUDS WILL FORM TODAY AND KEEP TEMPERATURES IN CHECK. THE RECORD LOW HIGH TEMPERATURE AT THE NASHVILLE INTERNATIONAL AIRPORT TODAY IS 79 DEGREES SET IN 1897. A NEW RECORD WILL BE SET TODAY.
THE RECORD LOW TEMPERATURE TONIGHT IN NASHVILLE IS 59 AND IN CROSSVILLE IS 57… SET IN 1947 AND 1970 RESPECTIVELY. NEW RECORD LOWS ARE EXPECTED.
Seems to me a seasonal component to the trends is to be expected. More ocean area in the southern hemisphere, earth orbit is at perigee in southern hemisphere summer, etc. The possibility that the effect is real needs to be considered.
http://www.dnsstuff.com/tools/whois/?ip=http%3A%2F%2Fdeepclimate.org
This ‘whois’ search says the registrant name for deepclimate.org is someone called Dave Clarke.
pochas (14:53:36) :
Exactly my thoughts also… the earth dosnt posses a uniform albedo. And it stands to reason that there should be seasonal patterns to the “noise”.
I’ve found in Internet discourse that the most vocal and insulting people tend to be anonymous. When one uses their real name, one tends to be a bit more civil since there are potentially real world consequences for their on-line behavior. For this reason alone I’d prefer that people used their real name on-line.
“He/she says: “I am a Canadian citizen residing in Canada. For private and professional reasons, I prefer to remain anonymous to the general public, at least for now.”
Could this be Dr. Hansen? (LOL)”
Actually given Steve McIntyre is “he who shall not be named” by the Hockey Team, perhaps he’s just taking them at their word…
I’d prefer to see the actual data points. If an average line is included, it should have error bars. Also, I’d like some estimate of the error in each data “point” included in the analysis. Also, why the 2003-2008 set? There may be a good reason for that, but some explanation would be informative.
Normally, I would be supportive of someone’s desire to stay anonymous. See that I only have a single name above! But deepclimate is not just discussing “science” – almost every single posting I saw was in the form of an attack against someone or some group. I see why Anthony expresses distaste for his anonymity – especially after I saw shallowclimate attacking Freeman Dyson, who has an intellect that most of the “deep” thinkers in the AGW crowd could only hope to even approach. Shallowclimate should be ashamed, but like most of today’s dishonest liberals (who are actually not true liberals, but who instead show very distinct and distrubing strains of fascistic thinking) use the tactics of destroy the messanger, or imply conspiracy, rather than answer direct questions. Occasional commenters who stay civil should be allowed to be anonymous. I suppose, so should people who run full time attack web sites. But it doesn’t mean I won’t hold them in contempt. Contrast with Anthony Watts, who is doing a great service to his country – by asking questions that need to be asked before a multi-trillion dollar economic burden is placed on his fellow citizens in the name of unsupported data, Shallowclimate shows himself to be a bottomfeeder of the worst kind.
I don’t see a problem with making scientific arguments (based on publicly available information) anonymously. As others point out, such arguments can stand or fall on their own merits.
What’s more problematic, or at least ironic, is that Deep Climate has attacked Freeman Dyson’s bona fides and accused others of “astroturfing.”
Seems to me that Deep Climate should grant Freeman Dyson the same courtesy he is asking from the rest of us: viz., to assume good faith and evaluate Freeman Dyson’s arguments on their own merits.
My opinion only.
You said:
I’ve never understood the need for some people to remain anonymous while at the same time attempt to do science.
I can think of one VERY good reason for this. We want to keep our jobs. I suspect that a large portion of your viewers are scientists (or engineers like myself) who agree with your positions, but have a family to feed. Entering into this discussion could have very serious ramifications to the non-self-employed. All it takes is a few dozen AGW believers complaining about your view, and most corporations will fire you, or at least demand your silence.
Now you know.
I originally posted the link to Deep Climate’s post, since I thought it read the clearest among information posted over the last year on the UAH seasonal swing.
In fact, some of the commentators above might want to read his three posts on the UAH seasonal swing in reported anomalies (the links are already given above), and in the other two WUWT posts here. Please guys, at least read the other two recent WUWT posts on the monthly global anomalies, starting with the completely off the wall post ridiculing the GISS report, before starting with the conspiracy theories again.
http://wattsupwiththat.com/2009/07/14/giss-for-june-way-out-there/
http://wattsupwiththat.com/2009/07/16/ncdc-june-2009-second-warmest-on-record-globally/
Skeptics seem to prefer the UAH temperature record, so it is somewhat surprising that they weren’t aware of the sizable seasonal shift occurring in the UAH record. Not only Deep Climate was aware of this problem, but this issue was discussed at Tamino’s site with two posts last fall, and Atmoz posted on this issue, and in fact, someone noticed that the UAH data showed this strange seasonal swing in the monthly data as far back as 2003.
http://tamino.wordpress.com/2008/10/21/rss-and-uah/
http://tamino.wordpress.com/2008/10/30/annual-cycle-in-uah-tlt/#more-1164
I think the moral of studying all this analysis, is that:
1. We need to be very, very careful in jumping to conclusions based on the monthly anomaly data.
2. Comparisons between different temperature records is difficult to do, and very problematical for short term data.
3. The UAH record is showing a change in the seasonal cycle, but we don’t know if this is real or an artifact of the processing of the satellite data. The data seem to be showing a delay in lower troposphere heating in May and June, but then a prolonged cooldown (with warmer temps) through the following February.
It will be interesting to see if the discrepancy between the UAH analysis of the satellite data, and the RSS analysis which shows only a slight seasonal shift, can be explained.
Mike D. (15:23:25) :
I’d prefer to see the actual data points. If an average line is included, it should have error bars. Also, I’d like some estimate of the error in each data “point” included in the analysis. Also, why the 2003-2008 set? There may be a good reason for that, but some explanation would be informative.
Mike D, if you bothered to read the original posts by Deep Climate, and the posts by Tamino, your questions would be answered. We argued about this on the other WUWT discussion boards, but the bottom line, the seasonal shift in the UAH data is statistically meaningful. What we don’t know, is whether it might be “real”, versus an artifact of the UAH process.
I don’t have a problem with people being anonymous while doing science. The name of the person is not relevant. It should not matter if a paper is submitted by Alan Smithee or Michael Mann. It should receive the same review, scrutiny, and level of respect.
The science should be what matters, not the person behind it.
REPLY: try getting an anonymously authored paper published in a peer reviewed journal. – A
Trevor (13:36:11) “dunce t acronyms.” and “Brits a BBQ summer”
Well, Trevor, I deciphered most of this but what does “Brits” mean?
Mike D. (15:23:25) :
I’d prefer to see the actual data points. If an average line is included, it should have error bars. Also, I’d like some estimate of the error in each data “point” included in the analysis. Also, why the 2003-2008 set? There may be a good reason for that, but some explanation would be informative.
As I’ve explained when I’ve brought this point up in the “Pielke Sr. – Hypothesis on daily UAH LT records” thread 2003-present is the period for which UAH uses the AQUA data whereas their mean is based on a period when an orbit decay correction was used.